Renal agenesis in mice homozygous for a gene trap mutation in the gene encoding heparan sulfate 2-sulfotransferase - PubMed (original) (raw)
Figure 1
Characterization of the ST125 insertion site. (A) Alignment of deduced amino acid sequence of mouse Hs2st cDNA with those of hamster and Xenopus Hs2st and Drosophila S1 cDNAs. Identical residues are boxed in black. The published carboxy-terminal 52 amino acids of Drosophila S1 are excluded on the basis of new sequence data (C. Merrill and B. Ganetzky, pers. comm.). (Arrow) Position of gene trap vector insertion site. Residues carboxy-terminal to this site are not predicted to be encoded by the gene trap allele. The conserved block sharing homology with several sulfotransferases is boxed in red. (B) Partial alignment of hamster HS2ST (GenBank protein accession no. 2196446) with human phenol sulfotransferase (accession no. 1711607), rat minoxidil sulfotransferase (accession no. 310179), rat dopamine-tyrosine sulfotransferase (accession no. 1711584), human thyroid hormone sulfotransferase (accession no. 2290540), rat _N_-hydroxyarylamine sulfotransferase (accession no. 1711569), rat estrogen sulfotransferase (accession no. 1711599), mouse alcohol sulfotransferase (accession no. 1711587), Flaveria bidentis flavonol-3-sulfotransferase (accession no. 1706738), chick chondroitin-6-sulfotranferase (accession no. 2494838), Drosophila S1 (accession no. 11013), and the predicted protein product of a human EST (GenBank nucleotide accession no. AA334103). Identical residues are shaded in black, conservative changes are shaded in gray. (C) Metaphase spread of ST125 ES cells subjected to fluorescent in situ hybridization with a probe specific to the mouse Hs2st genomic sequence (green) and a probe specific to the gene trap vector (red). Areas of overlap between the two signals are yellow. Chromosomes were counterstained with DAPI (blue). Hybridizing chromosomes were classified as chromosome 3, using Quips Karyotyper (data not shown). In 15 spreads, no other chromosome consistently gave a signal. (D) FISH to metaphase spread from human blood, using a human HS2ST genomic fragment as a probe. Both copies of chromosome 1p3 show hybridization (green spots). In 10 spreads no other chromosome consistently gave a signal.
Figure 2
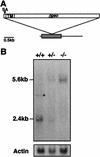
Hs2st transcripts are disrupted by the gene trap insertion. (A) Schematic of mouse Hs2st cDNA showing position of gene trap vector insertion site. The shaded box represents a 1068-bp ORF; the integration site corresponds to position 588 (start of translation = position 1). (SA) Splice acceptor; (TM) transmembrane-encoding region. (B) Northern hybridization of 10 μg of total RNA isolated from a wild-type (+/+), a heterozygote (+/−), and a homozygous mutant (−/−) 15.5-d.p.c. embryo using a probe specific to the ST125 5′ RACE product. The weak 4-kb signal (asterisk) detected in the wild-type RNA may represent an endogenous unprocessed Hs2st RNA or splice variant that is disrupted in the mutants and is represented too poorly in a heterozygote RNA population to be visualized. β-Actin was used as a loading control.
Figure 3
Expression pattern of Hs2st revealed by lacZ reporter activity in heterozygous embryos (A,C,E,G,H,I,J) and whole-mount in situ hybridization with an antisense Hs2st probe (B,D,F). (A) A 7.5-d.p.c. sagittal section of a late headfold stage embryo (anterior to the left) showing widespread β-gal activity, with elevated levels in the node (arrow) and embryonic ectoderm (arrowhead). (B,C) An 8.5 d.p.c., lateral view of 12 somite embryos. Widespread expression persists, but there is elevated β-gal activity in rhombomeres 2 and 4 (arrowheads). (D,E) Lateral view of a 10.0-d.p.c. embryo showing elevated expression in the roof plate (black arrowhead), floor plate (white arrowhead), and midbrain–hindbrain junction (arrow). (F,G) Transverse section through an 11.5-d.p.c. embryo. Strong expression is exhibited by the floor plate (arrow). (H) A 12.5-d.p.c. lateral view. The roof plate (red arrow), telencephalic vesicles (red arrowhead), vibrissa follicles (black arrow), and limb mesenchyme (black arrowhead) express high levels of lacZ. (I) Transverse section through a 13.5-d.p.c. embryo showing vibrissa follicle expression localized to the mesenchyme (arrowheads) and the developing hairshaft (arrow). (J) Sagittal section through a 14.5-d.p.c. embryo, dorsal to the left. Reporter gene activity is associated with the perichondria surrounding the ribs (arrowheads). Scale bar in J: 125 μm (A); 425 μm (B,C); 1000 μm (D,E); 150 μm (F,G); 1800 μm (H); 500 μm (I); 375 μm (J).
Figure 4
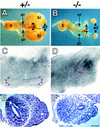
Bilateral renal agenesis in Hs2st mutant mice and its embryological basis. Dissected urogenital systems of normal (heterozygous) (A) and homozygous mutant (B) newborn mice. Homozygotes display bilateral renal agenesis and possess a blind-ended ureter (ur). The remainder of the mutant urogenital system is normal. (ad) Adrenal gland; (b) bladder; (ki) kidney; (o) ovary. (C–F) Morphology of representative 11.5-d.p.c. heterozygous (C,E) and mutant (D,F) embryonic kidney rudiments viewed in whole-mount (lateral view) (C,D) or as 8 μm-transverse sections stained with haematoxylin and eosin (E,F). (C) In heterozygotes, the ureteric bud has invaded the mesenchyme and bifurcated once to form a T-shape surrounded by a mantle of condensed mesenchyme (double-headed arrow). (D) In mutants, the ureteric bud has emerged from the Wolffian duct and invaded the mesenchymal blastema but failed to bifurcate and there are no overt signs of mesenchymal condensation. In C and D the position of the ureteric bud tip(s) is highlighted by red dots. (E) A dilated ureteric bud (arrowheads) is present in the heterozygotes surrounded by condensed mesenchyme. (F) In mutants, the ureteric bud (arrowhead) has not dilated, and there are no overt signs of condensation in the mesenchyme. (Arrow in E and F) Wolffian duct. Scale bar in F, 1300 μm (A and B); 30 μm (C–F).
Figure 5
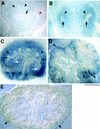
Hs2st expression during kidney development revealed by lacZ reporter activity in heterozygous tissue. (A) Transverse section through a 10.75-d.p.c. embryo. Weak β-gal activity is detected in the metanephric mesenchyme (black arrowheads), ureteric bud epithelium (arrow), and the Wolffian duct (red arrowhead). (B) Transverse section through an 11.5-d.p.c. embryo showing β-gal activity in the kidneys specific to the metanephric mesenchyme (arrowheads). Expression is absent from the ureteric bud (arrows). Kidney rudiments (11.5 d.p.c.) were cultured for 24 hr (C) or 96 hr (D) before X-gal staining. (C) Expression is restricted to the undifferentiated metanephric mesenchyme (black arrowheads) and is absent from the ureteric bud system (black arrows), and mesenchymal aggregates (white arrows). (D) Expression is localized to undifferentiated mesenchyme at the periphery of the culture (arrowheads). (E) Section through a 14.5-d.p.c. embryo showing weak β-gal activity in mesenchyme at the periphery of the kidney (arrowheads) where new nephric tubules are being induced. Scale bar, 100 μm (A–C); 200 μm (D,E).
Figure 6
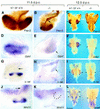
Expression of molecular markers for metanephric development in Hs2st mutants in dissected 11.5-d.p.c. kidney rudiments (A,B, D,E,G,H) and 12.5-d.p.c. urogenital regions (C,F,I,L). Heterozygous (+/−) or wild-type (+/+) (A,D,G,J and left-hand specimen in C,F,I,L) and homozygous mutant (−/−) (B,E,H,K and right-hand specimen in C,F,I,L) specimens subjected to immunostaining with anti-Pax-2 antibody (A–C) or whole-mount in situ hybridization with probes specific to Gdnf (D–F), c-ret (G–I), Wnt11 (J,K), or Sox9 (L). Kidney rudiments are labeled with black arrowheads in C, F, I, and L. (A) At 11.5 d.p.c, Pax-2-positive cells are abundant in the metanephric mesenchyme surrounding the ureteric bud, which also expresses Pax-2 and has bifurcated twice. (B) In mutants at 11.5 d.p.c., Pax-2 expression is detected in the unbranched ureter (black arrow) and in the mesenchyme concentrated in a small population of cells at a distance from the ureteric bud tip. Note the “stream” of Pax-2-positive cells adjacent to the bud tip (white arrow). (C) At 12.5 d.p.c., Pax-2 expression is localized to the mesonephric tubules (mt), Wolffian ducts (wd), and ureteric epithelium in mutant and heterozygous or wild-type urogenital systems. Mutants have unbranched Pax-2-expressing ureters (white arrowheads) and possess few Pax-2 positive cells in the mesenchyme (black arrowheads). (D) At 11.5 d.p.c., strong Gdnf expression is detected in the mesenchyme surrounding the bifurcated ureteric bud. (E) In mutants, Gdnf expression in mesenchyme adjacent to the unbranched ureteric bud is attenuated (black arrow).(F) In 12.5-d.p.c. Hs2st mutant kidney rudiments, Gdnf transcripts are no longer detected. (G) At 11.5 d.p.c., c-ret transcripts are detectable throughout the ureteric bud (black arrow) and are abundant in the ureteric bud tips. (H) In mutants at 11.5 d.p.c., c-ret expression in the ureteric bud is comparable to wild-type or heterozygous kidneys, but strong expression is not detected in the unbranched ureteric bud tip (black arrow). (I) At 12.5 d.p.c., c-ret transcripts are abundant in the bifurcated ureteric bud tips of the heterozygous or wild-type kidney and are no longer detectable in mutant kidney rudiments. (J) At 11.5 d.p.c., Wnt11 is expressed in ureteric bud tips and in mesenchyme proximal to the Wolffian duct (arrow). (K) In mutants, Wnt11 expression is undetectable in the unbranched ureteric bud (position highlighted by black dots). (L) In heterozygous or wild-type kidneys at 12.5 d.p.c., Sox9 transcripts are detected in the ureteric system. In mutants, expression persists at apparently normal levels in the unbranched ureter (white arrowheads). Black arrows show expression of Sox9 in the male gonads [the mutant urogenital region is female and, therefore, does not express Sox9 in the gonad (Kent et al. 1996; Morais da Silva et al. 1996)]. Scale bar in L: 100 μm (A,B,D,E,G,H,J,K); 800 μm (C,F,I,L).
Figure 7
Defects of the skeleton and the eye in newborn Hs2st mutants. (A–D) Alcian blue-alizarin red skeletal preparations of wild-type (A, D, and left-hand specimen in C) and Hs2st mutant (B, D, and right-hand specimen in C) newborn mice (ossified tissue, red; cartilage, blue). Compared with wild types (A), _Hs2st_−/− mice (B) exhibit skeletal abnormalities associated with increased bone mineralization. Note proximal shortening and increased girth of the long bones in mutants. (C) Wild-type and mutant scapulae. Note increased girth in the mutant. (D,E) Comparison of mutant and wild-type rib cages. In the wild type (D), costal cartilage crosses the sternum. In mutants (E), the sternum is fused. Additional patterning abnormalities are often observed (arrow). Note the decreased width of the mutant rib cage. (F) Comparison of mutant and wild-type eyes. Hs2st mutants exhibit iris colobomas associated with defective pigmented epithelium differentiation.


