Effects of regulated expression of mutant RhoA and Rac1 small GTPases on the development of epithelial (MDCK) cell polarity - PubMed (original) (raw)
Effects of regulated expression of mutant RhoA and Rac1 small GTPases on the development of epithelial (MDCK) cell polarity
T S Jou et al. J Cell Biol. 1998.
Abstract
MDCK cells expressing RhoA or Rac1 mutants under control of the tetracycline repressible transactivator were used to examine short-term effects of known amounts of each mutant before, during, or after development of cell polarity. At low cell density, Rac1V12 cells had a flattened morphology and intact cell-cell contacts, whereas Rac1N17 cells were tightly compacted. Abnormal intracellular aggregates formed between Rac1N17, F-actin, and E-cadherin in these nonpolarized cells. At all subsequent stages of polarity development, Rac1N17 and Rac1V12 colocalized with E-cadherin and F-actin in an unusual beaded pattern at lateral membranes. In polarized cells, intracellular aggregates formed with Rac1V12, F-actin, and an apical membrane protein (GP135). At low cell density, RhoAV14 and RhoAN19 were localized in the cytoplasm, and cells were generally flattened and more fibroblastic than epithelial in morphology. In polarized RhoAV14 cells, F-actin was diffuse at lateral membranes and prominent in stress fibers on the basal membrane. GP135 was abnormally localized to the lateral membrane and in intracellular aggregates, but E-cadherin distribution appeared normal. In RhoAN19 cells, F-actin, E-cadherin, and GP135 distributions were similar to those in controls. Expression of either RhoAV14 or RhoAN19 in Rac1V12 cells disrupted Rac1V12 distribution and caused cells to adopt the more fibroblastic, RhoA mutant phenotype. We suggest that Rac1 and RhoA are involved in the transition of epithelial cells from a fibroblastic to a polarized structure and function by direct and indirect regulation of actin and actin-associated membrane protein organizations.
Figures
Figure 1
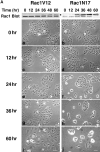
(A) Time course of Rac1V12 and Rac1N17 expression in MDCK cells and effects on the cell morphology in low-density cultures. Low-density cultures of Rac1V12 (left) and Rac1N17 (right) MDCK cells were grown in the absence of DC for the indicated times. (Top) At each time, cells were lysed in SDS sample buffer and processed for Western blotting with an anti-Rac1 monoclonal antibody to detect induction of mutant protein and levels of endogenous protein. *Note that addition of the myc epitope tag to Rac1V12 and Rac1N17 caused them to migrate more slowly than endogenous Rac1. (Bottom) Phase contrast micrographs of cell colonies at different times after Rac1V12 or Rac1N17 induction. (B) Time course of RhoAV14 and RhoAN19 expression in MDCK cells and effects on the cell morphology in low-density cultures. Low-density cultures of RhoAV14 (left) and RhoAN19 (right) MDCK cells were grown in the absence of DC for the indicated times. (Top) At each time, cells were lysed in SDS sample buffer and processed for Western blotting with an anti-RhoA monoclonal antibody to detect induction of mutant protein and levels of endogenous protein. *Note that addition of the myc epitope tag to RhoAV14 and RhoAN19 caused them to migrate more slowly than endogenous RhoA. (Bottom) Phase contrast micrographs of cell colonies at different times after RhoAV14 or RhoAN19 induction. Bars, 10 μm.
Figure 2
Effects of long-term expression of Rac1V12 and Rac1N17 on mutant protein expression and MDCK cell morphology. Rac1V12 and Rac1N17 MDCK cells were cultured in the presence of DC, 0 d, or in absence of DC for 1.5, 7, or 21 d. (Top) At each time, cell lysates were analyzed by Western blotting with an anti-Rac1 antibody to assess the expression of Rac1V12 or Rac1N17, and endogenous Rac1. *Note that addition of the myc epitope tag to Rac1V12 and Rac1N17 caused these proteins to migrate more slowly than endogenous Rac1. (Bottom) Phase contrast micrographs of Rac1V12 and Rac1N17 cells grown in the presence (+DC) or absence of DC (−DC) for 21 d. Bar, 10 μm.
Figure 3
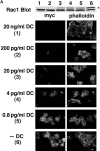
Dose-dependent effects of Rac1V12 (A), Rac1N17 (B), RhoAV14 (C), and RhoAN19 (D) on the subcellular distributions of mutant protein (myc-tagged), F-actin distribution (phalloidin), and cell morphology. Low-density MDCK cells were grown for 40 h in the presence of different concentrations of DC. (Top) After 40 h, cell lysates were analyzed by Western blotting with a mouse anti-Rac1 or RhoA antibody to assess the expression of mutant protein (*) and endogenous protein. The number above each lane refers to the concentration of DC shown on the left hand side. (Bottom) After 40 h, cells were fixed and double stained with a mouse anti-myc antibody to detect mutant RhoA or Rac1, and phalloidin to detect F-actin. Bar, 10 μm.
Figure 4
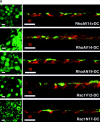
F-actin distribution and morphology of confluent monolayers of control (RhoAV14+DC) and RhoA and Rac1 mutant– expressing MDCK cells (−DC). RhoAV14, RhoAN19, Rac1V12, and Rac1N17 MDCK cells were grown in the presence (control; first column) or absence (all other columns) of DC at low cell density for 24 h, trypsinized and plated in LCM for 3 h, and then cultured for 16 h in HCM to induce cell–cell adhesion (+/−DC). (Top) Phase contrast micrographs of cells. (Middle) Cells were fixed and stained with phalloidin and examined by confocal microscopy: xy sections at the level of the apical junction (Apical Section), and basal membrane (Basal Section). (Bottom) xz sections of cell monolayers. Bar, 10 μm.
Figure 5
Colocalization of Rac1 mutants with either E-cadherin or GP135, depending on cell density. Rac1V12 and Rac1N17 cells were cultured without DC for 16 h at low (a, a′, d, d′, e, e′, and f), intermediate (b, g, and g′), or high cell density (c, c′, and h) in LCM (e and e′) or HCM (a, a′, b, c, c′, d, d′, f, g, g′, and h). Cells were fixed and processed for immunofluorescence microscopy with anti-myc (a, b, c′, d, e, f, g, and h) and either anti–E-cadherin (a′, e′, and g′) or anti-GP135 (c) antibodies, or FITC phalloidin (d′). Bar, 10 μm.
Figure 7
(A) Distribution of E-cadherin and β-catenin in confluent monolayers of control (RhoAV14+DC) and RhoAV14 (−DC), RhoAN19 (−DC), Rac1V12 (−DC), and Rac1N17 (−DC) expressing MDCK cells. RhoAV14, RhoAN19, Rac1V12, and Rac1N17 MDCK cells were grown in the presence (control; left column) or absence (all other columns) of DC at low cell density for 24 h, trypsinized and plated in LCM for 3 h, and then cultured for 16 h in HCM to induce cell–cell adhesion (with or without DC). After fixation, cells were stained with anti–E-cadherin (top) and β-catenin (bottom) antibodies and then examined in a confocal microscope. xy sections (large panels), at the level of apical junction, and xz sections are shown. (B) Distributions of E-cadherin and GP135 in confluent monolayers of control (RhoAV14+DC) and RhoAV14 (−DC), RhoAN19 (−DC), Rac1V12 (−DC), and Rac1N17 (−DC) expressing MDCK cells. RhoAV14, RhoAN19, Rac1V12, and Rac1N17 MDCK cells were grown in the presence or absence of DC at low cell density for 24 h, trypsinized and plated in LCM for 3 h, and then cultured for 16 h in HCM to induce cell–cell adhesion (+/−DC). After fixation, cells were costained with anti–E-cadherin (TRITC, red) and anti-GP135 (FITC, green) antibodies. xy sections (left, GP135 only) were collected by epifluorescence microscopy, and xz sections (right, E-cadherin and GP135) were collected by confocal microscopy. Bars: (A) 5 μm; (B) 10 μm.
Figure 6
Protein levels of the E-cadherin, β-catenin, and α-catenin complex in cells expressing Rac1 or RhoA mutants. Rac1V12, Rac1N17, RhoAV14, and RhoAN19 MDCK cells were grown on Transwell™ filters for 16 h in the presence (lanes labeled +, control) or absence (lanes labeled −) of DC and then processed for immunoprecipitation with E-cadherin antibody followed by Western blotting of the coimmunoprecipitated complex with antibodies specific for E-cadherin, β-catenin, or α-catenin.
Figure 8
Distributions of rab11, Rac1V12-myc, GP135, and F-actin in monolayers of control cells (Rac1V12 +DC) or Rac1V12 (−DC) expressing MDCK cells. Rac1V12 MDCK cells were grown in the presence (+DC, control) or absence (−DC) of DC at low cell density for 24 h, trypsinized and plated in LCM for 3 h, and then cultured for 16 h in HCM to induce cell–cell adhesion (+/−DC). After fixation, cells were costained with anti-myc (TRITC, red) and anti-rab11 (FITC, green) antibodies, or TRITC-phalloidin (red) and anti-GP135 (FITC, green) antibody; double exposures for myc/rab11 and phalloidin/GP135 are shown on the right. xy sections were collected by epifluorescence microscopy. Bars, 10 μm.
Figure 9
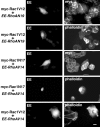
Distribution of RhoA and Rac1 mutants, and F-actin in MDCK cells expressing combinations of Rac1V12, Rac1N17, RhoAV14, and RhoAN19. Rac1V12 (myc) expressing cells were transiently supertransfected with either RhoAN19 tagged with a Glu-Glu epitope (EE) or RhoAV14 tagged with a Glu-Glu epitope (EE). After 24 h, cells were fixed and stained with anti– Glu-Glu epitope tag antibody (EE) to detect cells that expressed RhoAN19 or RhoAV14, and double stained with either myc epitope antibody (myc) or phalloidin to detect Rac1V12 and F-actin, respectively. Rac1N17 (myc) expressing cells were transiently supertransfected with RhoAV14 tagged with a Glu-Glu epitope (EE), stained with antibody recognizing Glu-Glu epitope tag (EE), and double stained with either myc epitope antibody (myc) or phalloidin to detect Rac1N17 and F-actin, respectively. Bar, 10 μm.
Similar articles
- Structural and functional regulation of tight junctions by RhoA and Rac1 small GTPases.
Jou TS, Schneeberger EE, Nelson WJ. Jou TS, et al. J Cell Biol. 1998 Jul 13;142(1):101-15. doi: 10.1083/jcb.142.1.101. J Cell Biol. 1998. PMID: 9660866 Free PMC article. - Selective alterations in biosynthetic and endocytic protein traffic in Madin-Darby canine kidney epithelial cells expressing mutants of the small GTPase Rac1.
Jou TS, Leung SM, Fung LM, Ruiz WG, Nelson WJ, Apodaca G. Jou TS, et al. Mol Biol Cell. 2000 Jan;11(1):287-304. doi: 10.1091/mbc.11.1.287. Mol Biol Cell. 2000. PMID: 10637309 Free PMC article. - Regulation of cell-cell adhesion by rac and rho small G proteins in MDCK cells.
Takaishi K, Sasaki T, Kotani H, Nishioka H, Takai Y. Takaishi K, et al. J Cell Biol. 1997 Nov 17;139(4):1047-59. doi: 10.1083/jcb.139.4.1047. J Cell Biol. 1997. PMID: 9362522 Free PMC article. - Cdc42, Rac1, and their effector IQGAP1 as molecular switches for cadherin-mediated cell-cell adhesion.
Kuroda S, Fukata M, Nakagawa M, Kaibuchi K. Kuroda S, et al. Biochem Biophys Res Commun. 1999 Aug 19;262(1):1-6. doi: 10.1006/bbrc.1999.1122. Biochem Biophys Res Commun. 1999. PMID: 10448058 Review. - Ras-related GTPases and the cytoskeleton.
Hall A. Hall A. Mol Biol Cell. 1992 May;3(5):475-9. doi: 10.1091/mbc.3.5.475. Mol Biol Cell. 1992. PMID: 1611153 Free PMC article. Review.
Cited by
- Junctional actin assembly is mediated by Formin-like 2 downstream of Rac1.
Grikscheit K, Frank T, Wang Y, Grosse R. Grikscheit K, et al. J Cell Biol. 2015 May 11;209(3):367-76. doi: 10.1083/jcb.201412015. J Cell Biol. 2015. PMID: 25963818 Free PMC article. - p120 catenin: an essential regulator of cadherin stability, adhesion-induced signaling, and cancer progression.
Kourtidis A, Ngok SP, Anastasiadis PZ. Kourtidis A, et al. Prog Mol Biol Transl Sci. 2013;116:409-32. doi: 10.1016/B978-0-12-394311-8.00018-2. Prog Mol Biol Transl Sci. 2013. PMID: 23481205 Free PMC article. Review. - A novel role of nectins in inhibition of the E-cadherin-induced activation of Rac and formation of cell-cell adherens junctions.
Hoshino T, Shimizu K, Honda T, Kawakatsu T, Fukuyama T, Nakamura T, Matsuda M, Takai Y. Hoshino T, et al. Mol Biol Cell. 2004 Mar;15(3):1077-88. doi: 10.1091/mbc.e03-05-0321. Epub 2003 Dec 29. Mol Biol Cell. 2004. PMID: 14699074 Free PMC article. - p190 RhoGAP promotes contact inhibition in epithelial cells by repressing YAP activity.
Frank SR, Köllmann CP, Luong P, Galli GG, Zou L, Bernards A, Getz G, Calogero RA, Frödin M, Hansen SH. Frank SR, et al. J Cell Biol. 2018 Sep 3;217(9):3183-3201. doi: 10.1083/jcb.201710058. Epub 2018 Jun 22. J Cell Biol. 2018. PMID: 29934311 Free PMC article. - Freeze-fracture electron microscopic study of tight junction strands in HEK293 cells and MDCK II cells expressing claudin-1 mutants in the second extracellular loop.
Inai T, Sengoku A, Hirose E, Iida H, Shibata Y. Inai T, et al. Histochem Cell Biol. 2009 Jun;131(6):681-90. doi: 10.1007/s00418-009-0571-7. Epub 2009 Feb 21. Histochem Cell Biol. 2009. PMID: 19234713
References
- Amano M, Ito M, Kimura K, Fukata Y, Chihara K, Nakano T, Matsuura Y, Kaibuchi K. Phosphorylation and activation of myosin by Rho-associated kinase (Rho-kinase) J Biol Chem. 1996;271:20246–20249. - PubMed
- Bourne HR. GTPases. A turn-on and a surprise. Nature. 1993;366:628–629. - PubMed
Publication types
MeSH terms
Substances
LinkOut - more resources
Full Text Sources
Research Materials


