Targeted gene disruption reveals a role for natural secretory IgM in the maturation of the primary immune response - PubMed (original) (raw)
Targeted gene disruption reveals a role for natural secretory IgM in the maturation of the primary immune response
M R Ehrenstein et al. Proc Natl Acad Sci U S A. 1998.
Abstract
Accelerated development of the secondary immune response may be attributable in part to the rapid delivery of antigen to lymphoid follicles by circulating antibody elicited on primary immunization. Here we provide evidence indicating that the nonspecific IgM present in naive mice (natural antibody) plays a role in the acceleration of the primary response. Targeted deletion of the Ig microseconds polyadenylation site by use of Cre recombinase allowed the creation of mice that, although harboring a normal number of B cells expressing surface IgM, completely lacked serum IgM while retaining the other Ig isotypes. These mice retained a broadly normal B lymphocyte distribution (although containing a somewhat expanded peritoneal B1a subset) but exhibited substantial delays in mounting affinity-matured IgG responses to T cell-dependent antigens. The T cell-independent response, however, was augmented. The data indicate that the IgM present before antigen challenge (as well, possibly, as that elicited immediately after immunization) accelerates maturation of the primary response, presumably by complexing with the antigen and facilitating lymphocyte activation and/or antigen trapping.
Figures
Figure 1
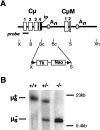
Creation of μs−/− mice. (A) The targeting construct. Restriction endonuclease cleavage sites are abbreviated: B, _Bam_HI; Bc, _Bcl_I; S, _Spe_I; X, _Xba_I; Xh, _Xho_I. The locations of the secretory μ tailpiece (tp), the μs and μm polyadenylation (An), sites and the LoxP sites (▴) are indicated. The Tk-Neo cassette was inserted between the _Bcl_I sites of Cμ. The fragment used for ES cell targeting extends from the _Bam_HI to _Xho_I sites of the resulting construct. (B) Southern blot analysis of tail DNA from μs+/+, μs+/−, and μs−/− mice digested with _Spe_I and hybridized with the probe shown in A.
Figure 2
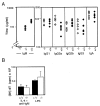
(A) Concentrations of serum Ig in 8-week-old μs−/− (open symbols) and control mice (solid symbols) derived from breedings against C57BL/6 were determined by ELISA. The concentration of serum IgM in μs−/− mice was below the sensitivity of the ELISA (50 ng/ml); that in heterozygotes is indicated by half-filled symbols. The small difference between μs−/− and control mice seen with respect to IgG2a levels was not observed in mice in which the μs− allele was bred against BALB/c (data not shown), suggesting that the apparent difference in IgG2a levels seen here reflects differential recognition of IgG2aa and IgG2ab by the developing anti-IgG2a antiserum (also see PharMingen data sheet). (B) Proliferative responses of spleen cells from normal (solid bars) and μs−/− mice (open bars) to 9 μg/ml bacterial lipopolysaccharide (LPS) or 10 μg/ml F(ab′)2 goat anti-μ antibody + 500 units/ml interleukin 4 (IL-4) were determined by monitoring the incorporation of [3H]thymidine after 48 h in culture. Each bar depicts the mean incorporation of three individual mice; the background incorporations for individual control and μs−/− mice were below 1,600 cpm.
Figure 3
Flow cytometric analysis of B cell populations. The profiles are representative of results obtained with between four and six mice. (A) Spleen cells were stained with fluorescein isothiocyanate-conjugated anti-IgM and either phycoerythrin-conjugated anti-CD45R(B220) or anti-IgD. The median fluorescence of the anti-IgM staining of the CD45R(B220)+ cells in the μs−/− mice was 475 ± 80, compared with 225 ± 20 in their normal littermates. (B) Bone marrow. (C) Peyer’s patch cells were stained for B220 and peanut agglutinin (PNA). (D) Peritoneum. Analysis of CD5/CD45R(B220) staining is shown for cells gated as IgM+. In μs−/− mice, 65 ± 9% of the CD45R(B220)+ peritoneal cells were CD5+ compared with 38 ± 7% in controls.
Figure 4
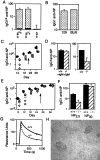
T cell-dependent anti-NP responses. (A) Comparison of the day 12 IgG1a anti-NP response to NP-CG immunization in mice in which one IgH allele was of b allotype (derived from C57BL/6) and the other was either wild type a allotype (derived from 129; a-μs+), a allotype but carrying the targeted μs deletion (a-μs−), or b allotype (b). These mice (sets of four) were derived from breeding the ES cell-derived chimeras against C57BL/6. The solid section at the base of each histogram depicts the prebleed titer. The titers are given in arbitrary units as detailed under Materials and Methods. (B) Comparison of the day 12 total IgG1 anti-NP response to NP-CG immunization in 129 and C57BL/6 mice. (C) Comparison of the titers of IgG1 anti-NP antibody in μs−/− (open symbols) and wild-type mice (solid symbols) immunized with soluble NP-KLH and boosted (arrow) on day 24 as measured by ELISA on NP30-BSA-coated plates. Tail bleeds were obtained on the days indicated on the x axis. (D) Titers of IgG1 anti-NP antibody 12 days after NP-KLH immunization were compared in μs−/− and control mice in which the antigen challenge had been given together with pooled serum IgM from unprimed mice (an amount equivalent to the IgM present in 0.5 ml of serum). (E) Comparison of the titers of IgG1 anti-NP antibody in μs−/− (open symbols) and control littermates (solid symbols) immunized with alum-precipitated NP-CG and boosted (day 26) as monitored by ELISA on NP2.5-BSA-coated plates. (The magnitude of the day 12 IgG1 anti-NP response in NP13-CG immunized control mice is about 8-fold greater than in NP13-KLH mice when both are compared on NP30-BSA coated plates.) (F) Comparison of the titers of IgG1 anti-NP antibody in the day 12 serum of the NP13-CG immunized mice as assayed plates coated with NP2.5-BSA and NP30-BSA. (G) Analysis by surface plasmon resonance of the binding of serum antibody to NP6-BSA immobilized on the chip. The serum samples were obtained from μs−/− and μs+/+ siblings 12 days after challenge with NP-CG, and the 7S Ig fraction was purified as described in Materials and Methods. The bulk of the antibody in the μs− sample that is bound initially to the chip clearly has a dissociation rate severalfold higher than that in the control, although the heterogeneity of the serum antibody and resultant complexity of the dissociation curves preclude a simple calculation of k off. (H) Germinal centers in the spleens of μs−/− mice 12 days post-NP-CG immunization were visualized by staining for peanut agglutinin.
Figure 5
Responses to phOx-CSA and NP-Ficoll. (A and B) Comparison of the serum titers of total IgG anti-phOx or anti-CSA antibody in μs−/− (open symbols) and control littermates (solid symbols) immunized with alum-precipitated phOx6-CSA and boosted (day 24). (C) Comparison of the serum titers of IgG3 anti-NP antibody in μs−/− (open symbols) and control littermates (solid symbols) immunized with NP-Ficoll.
Similar articles
- Affinity maturation occurs in channel catfish (Ictalurus punctaus) following immunization with a T-cell dependent antigen.
Wu L, Fu S, Yin X, Leng W, Guo Z, Wang A, Ye J. Wu L, et al. Fish Shellfish Immunol. 2019 Jan;84:781-786. doi: 10.1016/j.fsi.2018.10.057. Epub 2018 Oct 25. Fish Shellfish Immunol. 2019. PMID: 30393175 - IgM accelerates affinity maturation.
Corley RB, Morehouse EM, Ferguson AR. Corley RB, et al. Scand J Immunol. 2005 Jul;62 Suppl 1:55-61. doi: 10.1111/j.1365-3083.2005.01610.x. Scand J Immunol. 2005. PMID: 15953185 - Differential requirements for expression of CD80/86 and CD40 on B cells for T-dependent antibody responses in vivo.
Lumsden JM, Williams JA, Hodes RJ. Lumsden JM, et al. J Immunol. 2003 Jan 15;170(2):781-7. doi: 10.4049/jimmunol.170.2.781. J Immunol. 2003. PMID: 12517941 - B-1 B cell IgM antibody initiates T cell elicitation of contact sensitivity.
Askenase PW, Tsuji RF. Askenase PW, et al. Curr Top Microbiol Immunol. 2000;252:171-7. doi: 10.1007/978-3-642-57284-5_18. Curr Top Microbiol Immunol. 2000. PMID: 11125474 Review. - Primary selective IgM deficiency: an ignored immunodeficiency.
Louis AG, Gupta S. Louis AG, et al. Clin Rev Allergy Immunol. 2014 Apr;46(2):104-11. doi: 10.1007/s12016-013-8375-x. Clin Rev Allergy Immunol. 2014. PMID: 23760686 Review.
Cited by
- B-1 and B-2 cell-derived immunoglobulin M antibodies are nonredundant components of the protective response to influenza virus infection.
Baumgarth N, Herman OC, Jager GC, Brown LE, Herzenberg LA, Chen J. Baumgarth N, et al. J Exp Med. 2000 Jul 17;192(2):271-80. doi: 10.1084/jem.192.2.271. J Exp Med. 2000. PMID: 10899913 Free PMC article. - Comprehensive review of autoantibodies in patients with hyper-IgM syndrome.
Barbouche MR, Chen Q, Carbone M, Ben-Mustapha I, Shums Z, Trifa M, Malinverno F, Bernuzzi F, Zhang H, Agrebi N, Norman GL, Chang C, Gershwin ME, Invernizzi P. Barbouche MR, et al. Cell Mol Immunol. 2018 Jun;15(6):610-617. doi: 10.1038/cmi.2017.140. Epub 2018 Feb 5. Cell Mol Immunol. 2018. PMID: 29400703 Free PMC article. Review. - Secreted IgM deficiency leads to increased BCR signaling that results in abnormal splenic B cell development.
Tsiantoulas D, Kiss M, Bartolini-Gritti B, Bergthaler A, Mallat Z, Jumaa H, Binder CJ. Tsiantoulas D, et al. Sci Rep. 2017 Jun 14;7(1):3540. doi: 10.1038/s41598-017-03688-8. Sci Rep. 2017. PMID: 28615655 Free PMC article. - Loss of Id3 (Inhibitor of Differentiation 3) Increases the Number of IgM-Producing B-1b Cells in Ischemic Skeletal Muscle Impairing Blood Flow Recovery During Hindlimb Ischemia.
Osinski V, Srikakulapu P, Haider YM, Marshall MA, Ganta VC, Annex BH, McNamara CA. Osinski V, et al. Arterioscler Thromb Vasc Biol. 2022 Jan;42(1):6-18. doi: 10.1161/ATVBAHA.120.315501. Epub 2021 Nov 23. Arterioscler Thromb Vasc Biol. 2022. PMID: 34809449 Free PMC article. - Enhanced humoral immune responses against T-independent antigens in Fc alpha/muR-deficient mice.
Honda S, Kurita N, Miyamoto A, Cho Y, Usui K, Takeshita K, Takahashi S, Yasui T, Kikutani H, Kinoshita T, Fujita T, Tahara-Hanaoka S, Shibuya K, Shibuya A. Honda S, et al. Proc Natl Acad Sci U S A. 2009 Jul 7;106(27):11230-5. doi: 10.1073/pnas.0809917106. Epub 2009 Jun 19. Proc Natl Acad Sci U S A. 2009. PMID: 19549827 Free PMC article.
References
- Nossal G J V, Ada G L. Antigens, Lymphoid Cells, and the Immune Response. New York: Academic; 1971.
- White R G. In: Clinical Aspects of Immunology. Gell P G H, Coombs R R A, Lachmann P J, editors. Oxford: Blackwell; 1975. pp. 411–416.
- Thorbecke G J, Lerman S P. Adv Exp Biol. 1976;73A:83–100. - PubMed
- Theofilopoulos A N, Dixon F J. Adv Immunol. 1979;28:89–220. - PubMed
Publication types
MeSH terms
Substances
LinkOut - more resources
Full Text Sources
Other Literature Sources
Molecular Biology Databases


