Transient mitochondrial depolarizations reflect focal sarcoplasmic reticular calcium release in single rat cardiomyocytes - PubMed (original) (raw)
Transient mitochondrial depolarizations reflect focal sarcoplasmic reticular calcium release in single rat cardiomyocytes
M R Duchen et al. J Cell Biol. 1998.
Abstract
Digital imaging of mitochondrial potential in single rat cardiomyocytes revealed transient depolarizations of mitochondria discretely localized within the cell, a phenomenon that we shall call "flicker." These events were usually highly localized and could be restricted to single mitochondria, but they could also be more widely distributed within the cell. Contractile waves, either spontaneous or in response to depolarization with 50 mM K+, were associated with propagating waves of mitochondrial depolarization, suggesting that propagating calcium waves are associated with mitochondrial calcium uptake and consequent depolarization. Here we demonstrate that the mitochondrial flicker was directly related to the focal release of calcium from sarcoplasmic reticular (SR) calcium stores and consequent uptake of calcium by local mitochondria. Thus, the events were dramatically reduced by (a) depletion of SR calcium stores after long-term incubation in EGTA or thapsigargin (500 nM); (b) buffering intracellular calcium using BAPTA-AM loading; (c) blockade of SR calcium release with ryanodine (30 microM); and (d) blockade of mitochondrial calcium uptake by microinjection of diaminopentane pentammine cobalt (DAPPAC), a novel inhibitor of the mitochondrial calcium uniporter. These observations demonstrate that focal SR calcium release results in calcium microdomains sufficient to promote local mitochondrial calcium uptake, suggesting a tight coupling of calcium signaling between SR release sites and nearby mitochondria.
Figures
Figure 1
An increase of TMRE fluorescence signals depolarization of Δψm in a single cardiomyocyte. (a) High-resolution image taken from a cardiomyocyte loaded with TMRE using a confocal imaging system (excitation at 543 nm). The discrete localization of signal to mitochondria and the distribution of mitochondria in bands running along the longitudinal axis of the cell is clear. The asterisks in this and the following panels indicate the position of the nucleus. (b) CCD image of a similar cell. The longitudinal distribution of mitochondria is still evident, despite the loss of resolution. c and d show images of a TMRE-loaded cell before (c) and after (d) application of the uncoupler, FCCP (1 μM). The plot shown in e (a surface plot) and the corresponding “line image” shown in f were obtained from the pixel values extracted from the image series along the line drawn along the axis of the cell as shown in c and d, and they illustrate the evolution of the response to FCCP with time. In response to FCCP, the TMRE signal increased approximately threefold in this cell.
Figure 4
Characteristics of transient depolarizations of single mitochondria. a, i–iv, shows examples of changes in signal measured over clearly identifiable single mitochondria measured as a function of time. Mitochondria were identified as single objects by thresholding the images, which clearly revealed distinct rod-shaped objects. In each case, the recovery phase of the transient depolarizations was fitted well by a single exponential decay function with time constants indicated. Note particularly the example shown in iv, in which two clearly distinct events were identified, each with a similar time course, suggesting complete repolarization after the first event. Surface plots (b, i and c, i) and their equivalent line images (b, ii and c, ii) are shown; the intensity profile along a line selected to follow the long axis of a single identifiable mitochondrion is shown as a function of time. The band of increased intensity in the middle of the image field is the increased intensity seen over the mitochondrion, and the transient events can clearly be seen to involve a spread of indicator beyond the boundaries of the mitochondrion. Again the example shown in c illustrates two consecutive events occurring within a single mitochondrion with time.
Figure 5
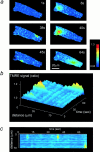
Localized transient depolarization of Δψm in processed image sequences. (a) A series of six images taken from a time series obtained over ∼65 s is shown with the time of acquisition of each within the series as indicated. These images were processed as described and ratioed against a virtual image constructed from the darkest value for each pixel throughout the time series. b and c show the surface and line images, respectively, for this cell, showing changes in intensity along the axis of the cell with time. Note that such processing of course excludes the small events seen close to the edge of these cells at 38 and 45 s.
Figure 6
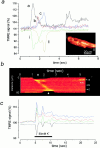
Contractile waves are associated with waves of mitochondrial depolarization. (a) A spontaneous contractile wave propagating across the cell (inset) was associated with a propagating wave of mitochondrial depolarization that coincided with the contraction. The intensity of signal at the areas indicated on the image are shown as a function of time. Note that the decrease in signal at the cell edges (i and ii) due to the contraction coincided well with the increased signal seen at the corresponding part of the cell. In addition, at position a, a doublet of brief transient events were seen later in the image sequence. It is noteworthy that these had a similar amplitude as the transient associated with the contraction. In b, a line image is shown to further illustrate the spatial characteristics of the propagation of the wave of mitochondrial depolarization, seen here as an increase in signal that moves diagonally across the image, starting at one edge of the cell (the upper boundary of this image) and moving towards the other (at the lower edge of this sequence). The transient events seen later (position a) are indicated here as well (asterisks). In c, a plot of intensity with time is shown to illustrate the time course of the mitochondrial response to depolarization of a cell with 50 mM KCl (applied for the period indicated by the white bar). The depolarization caused a series of diminishing twitches, each of which was associated with mitochondrial depolarizations. Note also that the largest twitch was associated with the largest increase in TMRE signal.
Figure 7
Transient mitochondrial depolarizations are dependent on SR calcium stores. a and b show some characteristic surface and line images, illustrating the occurrence of flicker in a cell under control conditions. After exposure to 30 μM ryanodine (c and d), the flicker was almost completely abolished.
Figure 8
Transient mitochondrial depolarizations require mitochondrial calcium uptake. (a) After microinjection of a cell with DAPPAC and fura-2–free acid, a challenge with caffeine (10 mM) raised [Ca2+]i and caused a twitch, showing that the SR calcium release mechanism was operational. Nevertheless, the mitochondrial flicker was almost completely suppressed, as shown in the surface and line images shown in c (upper and lower traces, respectively), and compared with a control obtained in the same preparation (b, upper and lower panels). To illustrate the time course of cell shortening, a binary image of the cell was created. The intensity was measured in a region that included the edge of the cell. Since the signal is simply a function of the number of pixels within the region set to unity, cell shortening reduced the signal, illustrating the time course of the twitch.
Figure 3
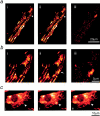
Resolution of transient depolarizations to single mitochondria. In a, a confocal image of an adult myocyte reveals the organization of mitochondria in longitudinal bands. A single mitochondrion showed a transient increase in intensity, and the differential image is shown in iii. b shows an increased magnification of the area of the cell for the three images shown above. In c, a series of images has been extracted from a sequence obtained from the neonatal myocytes in culture to illustrate the occurrence of transient events restricted to single identifiable mitochondria (arrows).
Figure 2
Localized transient depolarization of Δψm. a, i and ii, shows a selection of images extracted from image series obtained from two cells over a period of ∼60 s and illustrates the transient localized depolarizations of mitochondria or groups of mitochondria throughout the cell with time. Each arrowhead points to a region of the image that shows a marked transient increase in intensity, and the times of the individual images are indicated. In b, i and ii, the differential images corresponding to those selected in a, i and ii, are shown, revealing the distribution over which the signal has changed between image frames. The black calibration bars to the right of each group of images represent 20 μm. The traces below (c) illustrate the change in intensity with time for events identified in each of four cells. In each case, an area or areas of just a few pixels were selected to limit the collection of signal to a small volume of the cell. In c, i, three widely separated areas within a cell were chosen, over which single events occurred during the sampling period. The record in ii shows a single brief event highly localized to a small part of a cell superimposed on a very quiet baseline. In iii, an example has been selected in which several events occurred repeatedly at a single point within the acquisition period, and in iv, FCCP was applied at the end of the acquisition time to demonstrate the full range of TMRE signal with complete dissipation of the mitochondrial potential in comparison with the small transient event that preceded it.
Figure 9
Quantitative comparisons between manipulations. The histogram illustrates the mean values obtained for the signal measured over the images averaged from time series under each of the conditions discussed and indicated below the columns. The number of cells from which the values were derived are indicated by each column. Significance at the level of <0.05 is indicated by * and at the level of 0.001 by **.
Similar articles
- Physical coupling supports the local Ca2+ transfer between sarcoplasmic reticulum subdomains and the mitochondria in heart muscle.
García-Pérez C, Hajnóczky G, Csordás G. García-Pérez C, et al. J Biol Chem. 2008 Nov 21;283(47):32771-80. doi: 10.1074/jbc.M803385200. Epub 2008 Sep 12. J Biol Chem. 2008. PMID: 18790739 Free PMC article. - Mitochondrial free calcium regulation during sarcoplasmic reticulum calcium release in rat cardiac myocytes.
Andrienko TN, Picht E, Bers DM. Andrienko TN, et al. J Mol Cell Cardiol. 2009 Jun;46(6):1027-36. doi: 10.1016/j.yjmcc.2009.03.015. Epub 2009 Apr 1. J Mol Cell Cardiol. 2009. PMID: 19345225 Free PMC article. - Calcium signalling in sarcoplasmic reticulum, cytoplasm and mitochondria during activation of rabbit aorta myocytes.
Gurney AM, Drummond RM, Fay FS. Gurney AM, et al. Cell Calcium. 2000 Jun;27(6):339-51. doi: 10.1054/ceca.2000.0124. Cell Calcium. 2000. PMID: 11013464 - Inositol 1,4,5-trisphosphate directs Ca(2+) flow between mitochondria and the Endoplasmic/Sarcoplasmic reticulum: a role in regulating cardiac autonomic Ca(2+) spiking.
Jaconi M, Bony C, Richards SM, Terzic A, Arnaudeau S, Vassort G, Pucéat M. Jaconi M, et al. Mol Biol Cell. 2000 May;11(5):1845-58. doi: 10.1091/mbc.11.5.1845. Mol Biol Cell. 2000. PMID: 10793156 Free PMC article. - SR-mitochondria communication in adult cardiomyocytes: A close relationship where the Ca2+ has a lot to say.
De la Fuente S, Sheu SS. De la Fuente S, et al. Arch Biochem Biophys. 2019 Mar 15;663:259-268. doi: 10.1016/j.abb.2019.01.026. Epub 2019 Jan 24. Arch Biochem Biophys. 2019. PMID: 30685253 Free PMC article. Review.
Cited by
- Nonequivalence of membrane voltage and ion-gradient as driving forces for the bacterial flagellar motor at low load.
Lo CJ, Leake MC, Pilizota T, Berry RM. Lo CJ, et al. Biophys J. 2007 Jul 1;93(1):294-302. doi: 10.1529/biophysj.106.095265. Epub 2007 Apr 6. Biophys J. 2007. PMID: 17416615 Free PMC article. - Mitochondrial calcium in heart cells: beat-to-beat oscillations or slow integration of cytosolic transients?
Hüser J, Blatter LA, Sheu SS. Hüser J, et al. J Bioenerg Biomembr. 2000 Feb;32(1):27-33. doi: 10.1023/a:1005556227425. J Bioenerg Biomembr. 2000. PMID: 11768759 Review. - Mitochondrial membrane potential in axons increases with local nerve growth factor or semaphorin signaling.
Verburg J, Hollenbeck PJ. Verburg J, et al. J Neurosci. 2008 Aug 13;28(33):8306-15. doi: 10.1523/JNEUROSCI.2614-08.2008. J Neurosci. 2008. PMID: 18701693 Free PMC article. - Mitochondrial Safeguard: a stress response that offsets extreme fusion and protects respiratory function via flickering-induced Oma1 activation.
Murata D, Yamada T, Tokuyama T, Arai K, Quirós PM, López-Otín C, Iijima M, Sesaki H. Murata D, et al. EMBO J. 2020 Dec 15;39(24):e105074. doi: 10.15252/embj.2020105074. Epub 2020 Nov 17. EMBO J. 2020. PMID: 33200421 Free PMC article. - Mitochondrial Flash: Integrative Reactive Oxygen Species and pH Signals in Cell and Organelle Biology.
Wang W, Gong G, Wang X, Wei-LaPierre L, Cheng H, Dirksen R, Sheu SS. Wang W, et al. Antioxid Redox Signal. 2016 Sep 20;25(9):534-49. doi: 10.1089/ars.2016.6739. Epub 2016 Jul 14. Antioxid Redox Signal. 2016. PMID: 27245241 Free PMC article. Review.
References
- Bernardi P, Broekemeier KM, Pfeiffer DR. Recent progress on regulation of the mitochondrial permeability transition pore, a cyclosporin-sensitive pore in the inner mitochondrial membrane. J Bioenerg Biomembr. 1994;26:509–517. - PubMed
Publication types
MeSH terms
Substances
LinkOut - more resources
Full Text Sources
Other Literature Sources
Research Materials
Miscellaneous


