Impact of culture-independent studies on the emerging phylogenetic view of bacterial diversity - PubMed (original) (raw)
Review
Impact of culture-independent studies on the emerging phylogenetic view of bacterial diversity
P Hugenholtz et al. J Bacteriol. 1998 Sep.
Erratum in
- J Bacteriol 1998 Dec;180(24):6793
No abstract available
Figures
FIG. 1
Evolutionary distance tree of the bacterial domain showing currently recognized divisions and putative (candidate) divisions. The tree was constructed using the ARB software package (with the Lane mask and Olsen rate-corrected neighbor-joining options) and a sequence database modified from the March 1997 ARB database release (43). Division-level groupings of two or more sequences are depicted as wedges. The depth of the wedge reflects the branching depth of the representatives selected for a particular division. Divisions which have cultivated representatives are shown in black; divisions represented only by environmental sequences are shown in outline. The scale bar indicates 0.1 change per nucleotide. The aligned, unmasked data sets used for this figure and Fig. 3 through 6 are available from
http://crab2.berkeley.edu/pacelab/176.htm
.
FIG. 2
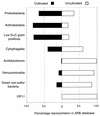
Relative representation in selected cosmopolitan bacterial divisions of 16S rRNA sequences from cultivated and uncultivated organisms. Results were compiled from 5,224 and 2,918 sequences from cultivated and uncultivated organisms, respectively.
FIG. 3
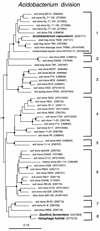
Phylogenetic dendrogram of the Acidobacterium division. Names of cultivated organisms are shown in bold. The habitat source of each environmental sequence is indicated before the clone name. GenBank accession numbers are listed parenthetically. Subdivisions (see the text) are indicated by brackets at the right of the tree. Construction of the tree was as described for Fig. 1. The robustness of the topology presented was estimated by bootstrap resampling of independent distance, parsimony, and rate-corrected maximum-likelihood analyses as previously described (2). Distance and parsimony analyses were conducted using test version 4.0d61 of PAUP*, written by David L. Swofford. Branch points supported (bootstrap values of >75%) by most or all phylogenetic analyses are indicated by filled circles; open circles indicate branch points marginally supported (bootstrap values of 50 to 74%) by most or all analyses. Branch points without circles are not resolved (bootstrap values of <50%) as specific groups in different analyses. The scale bar indicates 0.1 change per nucleotide.
FIG. 4
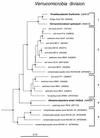
Phylogenetic dendrogram of the Verrucomicrobia division. Names of cultivated organisms are shown in bold. The habitat source of each environmental sequence is indicated before the clone name. GenBank accession numbers are listed parenthetically. Subdivisions (see the text) are indicated by brackets at the right of the tree. Tree construction and support for branch points was as described for Fig. 1 and 3, respectively. The scale bar indicates 0.1 change per nucleotide.
FIG. 5
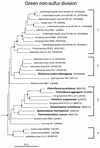
Phylogenetic dendrogram of the GNS division. Names of cultivated organisms are shown in bold. The habitat source of each environmental sequence is indicated before the clone name. GenBank accession numbers are listed parenthetically. Subdivisions (see the text) are indicated by brackets at the right of the tree. Tree construction and support for branch points was as described for Fig. 1 and 3, respectively. The scale bar indicates 0.1 change per nucleotide.
FIG. 6
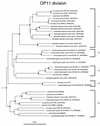
Phylogenetic dendrogram of the OP11 division. The habitat source of each environmental sequence is indicated before the clone name. GenBank accession numbers are listed parenthetically. Subdivisions (see the text) are indicated by brackets at the right of the tree. Tree construction and support for branch points was as described for Fig. 1 and 3, respectively. The four MIM clones and F78 clone are unreleased sequences generously made available to us by Pascale Durand (10) and Floyd Dewhirst (8). The scale bar indicates 0.1 change per nucleotide.
References
- Blankenship R E. Origin and early evolution of photosynthesis. Photosynth Res. 1992;33:91–111. - PubMed
Publication types
MeSH terms
LinkOut - more resources
Full Text Sources
Other Literature Sources

