gas7: A gene expressed preferentially in growth-arrested fibroblasts and terminally differentiated Purkinje neurons affects neurite formation - PubMed (original) (raw)
gas7: A gene expressed preferentially in growth-arrested fibroblasts and terminally differentiated Purkinje neurons affects neurite formation
Y T Ju et al. Proc Natl Acad Sci U S A. 1998.
Abstract
Growth arrest-specific (gas) genes are expressed preferentially in cells that enter a quiescent state. gas7, which we identified in serum-starved murine fibroblasts, is reported here to be expressed in vivo selectively in neuronal cells of the mature cerebral cortex, hippocampus, and cerebellum. gas7 transcripts encode a 48-kDa protein containing a structural domain that resembles sequences of OCT2, a POU transcription factor implicated in neuronal development, and synapsins, which have a role in modulating neurotransmitter release. Using in situ hybridization and immunocytochemical analysis, we show that GAS7 expression occurs prominently in cerebellar Purkinje cells and that inhibition of production in terminally differentiating cultures of embryonic murine cerebellum impedes neurite outgrowth from maturing Purkinje cells. Conversely, GAS7 overexpression in undifferentiated neuroblastoma cell cultures dramatically promotes neurite-like outgrowth. Collectively, our results provide evidence for an association between expression of this gas gene and neuronal development.
Figures
Figure 1
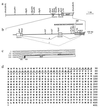
(a) Map and structure of the chromosomal DNA in the region of integration of Mo-MuLV_lac_ in cell line 354–7. The scale at the right indicates DNA length in kb pairs. The solid horizontal lines represent introns. Exon A is indicated by the open box adjoining the box with vertical lines; exon B is indicated by the box with diagonal lines. Restriction endonuclease cleavage sites are indicated, as are the long terminal repeat (LTR) (crosshatched boxes) and lacZ segments of the retrovirus construct. (b) Enlargement of the region containing the provirus integration site. The symbols are as described for a. The nucleotides shown by bold letters indicate the chromosomal sequence, and the italicized lettering indicates the Mo-MuLV_lac_/chromosomal DNA junction. The letters A, B, and C above the lacZ gene mark the locations of three splice acceptor sites. The locations of GT-rich repeats in the chromosomal DNA are indicated, as are the sites of polypurine/polypyrimidine (Pu/Py) segments and B1/B2 repeats. I and II represent alternatively spliced transcripts. Exon A is directly linked to lacZ at splice acceptor site A in transcript I. In transcript II, the 3′ region of exon A (box with vertical lines) is linked to exon B, which joins lacZ at splice acceptor site B. (c) The structure and sequence of the _lacZ_-fusion cDNA obtained by 5′ RACE cloning from cell line 354–7 is shown. The translation start codon (ATG) for the fusion protein is shown in bold letters. The splice donor sequence (SD) on chromosomal DNA and the splice acceptor sequence (SA) (shaded box) on the vector are also shown. The underlined sequences indicate the locations of the primers used for 3′ RACE cloning of gas7 cDNA. Lowercase letters identify the _Stu_I and _Xba_I sites mapped in a and b. (d) Predicted amino acid sequence encoded by gas7 cDNA. The full-length cDNA sequence (GenBank accession no. U19860) contains a hexanucleotide sequence (AGAAGA) commonly present 5′ to a translation start codon. The translation stop codon is indicated by an asterisk. The underlined amino acid residues indicate the region of the GAS7 protein that resembles synapsin I.
Figure 2
Protein encoded by the GAS7 ORF and differential expression of gas7 mRNA in mouse tissues. (a) The filled box indicates the location of the computer-predicted GAS7 ORF. The orientation and location of the antisense RNA probe used for in situ hybridization are shown. The _Apa_LI restriction site was used to linearize plasmid DNA for in vitro synthesis of RNA probes. The nucleotide coordinates correspond to the sequence shown in GenBank accession no. U19860. (b) Autoradiograph of [35S]methionine-labeled GAS7 synthesized in vitro by using rabbit reticulocyte lysate (Promega) and analyzed on a 10% SDS-polyacrylamide gel. Lane 1: protein encoded by cDNA containing a 5′ deletion of approximately one-third of the cDNA sequence. Lane 2: protein synthesized from full-length gas7 cDNA. Molecular size markers in kilodaltons (kDa) are indicated. (c) Radioautograph of multiple-tissue RNA blot probed with full-length gas7 cDNA (Upper) or a fragment of β-actin cDNA (Lower) – both 32P-labeled by random priming (29). The multiple-tissue RNA blot (CLONTECH) contains poly(A) RNA (1 μg per lane) isolated from various tissues. β-Actin DNA (CLONTECH) was used as an internal control for the amount of RNA present in each lane; lane 1, heart; lane 2, brain; lane 3, spleen; lane 4, lung; lane 5, liver; lane 6, muscle; lane 7, kidney; lane 8, testis. (d–f) Differential expression of gas7 mRNA in the adult mouse brain. (d) Autoradiograph of a sagittal section hybridized in situ with the antisense RNA probe. (e) Same as d, except that the in situ hybridization mixture contained an excess amount of unlabeled gas7 antisense RNA. (f) Same as d, but shown in dark-field photomicrograph of emulsion autoradiogram. The antisense RNA probe used is shown in a. The brain regions indicated are cerebral cortex (C), hippocampus (H), caudate putamen (CP), and cerebellum (Cb). The molecular layer (M), Purkinje layer (P) and granule layer (G) are also indicated. (Scale bar: d, 4.5 mm; f, 400 μm.)
Figure 3
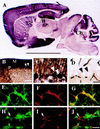
Expression of GAS7 protein in vivo. Brain regions and layer description are the same as in Fig. 2. (A) Low magnification of a sagittal section of whole mouse brain probed with GAS7 antibody shows positive immunoreactivity in the C, H and Cb. (B) Magnified photograph of the layered structure of a cerebellar folia from A showing strong positive staining in the M and P layers and light staining in the G layer. (C) Magnified photograph of B. For a negative control, D, a sagittal section prepared from the same mouse brain was similarly analyzed, except that preimmune serum, instead of the GAS7 antibody, was used. Scale bar: A, 5 mm; B, 120 μm; C and D, 60 μm. (E–J) GAS7 is preferentially detected by confocal microscopy of neurons in primary cell culture of mouse cerebella. E and H were probed with anti-GAS7 antibodies, F and I were probed with anti-MAPII and anti-GFAP, respectively. G and J show overlaid photographs of E and F, H and I, respectively. The arrowheads in H_–_J show a glial cell that is positively stained with antibody against GFAP but not against GAS7. (Scale bar E–J: 40 μm.)
Figure 4
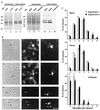
(A) Specific reduction in the expression of GAS7 in a primary cerebellar cell culture treated with _gas7_-antisense oligonucleotides. Extracts of the sense-, antisense-, or no (Blank) oligonucleotide-treated cells prepared as described in Materials and Methods were electrophoresed on SDS/PAGE gels (lanes 5–7), and expression of GAS7 was detected by Western blot analysis using anti-GAS7 antiserum (lanes 8–10). Lanes 1–4 and 5–7 show expression of GAS7 in extracts prepared from the cerebella of postnatal day 1 mice (P1-Cb) or from 3-day in vitro primary cerebellar cell cultures (DIV3). Amido-black staining showing approximately equal loading of protein extracts in each lane before probing with GAS7 antibody is also shown (lanes 1, 2, 5, 6, and 7). Molecular mass size markers in kDa are indicated. (B) Photomicrographs of cells treated with _gas7_-antisense oligonucleotide. Cerebellar cell primary cultures were untreated (a–c), or treated with a _gas7_-sense (d–f) or with _gas7_-antisense (g–l) oligonucleotide. Cells were examined by phase-contrast microscopy (a, d, g, and j), or stained with GAS7 antibodies (b, e, h, and k) or calbindin antibodies (c, f, i, and l). Arrowheads indicate Purkinje cells that reacted with antibodies against calbindin. (Bar = 70 μm.) (C) Quantitative comparison of the numbers of neurites formed in the Purkinje cells (followed by the staining of calbindin antibodies) after treatment with gas7 sense or antisense oligonucleotides. A neurite was defined in this analysis as a cellular projection longer than the length of the cell body. The data shown are the cumulative results (mean ± SD) of two independent experiments. In each experiment, at least 300 calbindin-stained neurons were examined.
Figure 5
Effect of overproduction of gas7 in neuroblastoma cells. (A and B) LacZ-expressing Neuro-2A cells. (C and D) GAS7-expressing Neuro-2A cells. Enlargements of cells designated by arrowheads in A and C are shown in B and D, respectively. [Bars = 100 μm (A and C); 10 μm (B and D).]
Similar articles
- Human Gas7 isoforms homologous to mouse transcripts differentially induce neurite outgrowth.
Chao CC, Chang PY, Lu HH. Chao CC, et al. J Neurosci Res. 2005 Jul 15;81(2):153-62. doi: 10.1002/jnr.20552. J Neurosci Res. 2005. PMID: 15948147 - The Gas7 gene encodes two protein isoforms differentially expressed within the brain.
Lazakovitch EM, She BR, Lien CL, Woo WM, Ju YT, Lin-Chao S. Lazakovitch EM, et al. Genomics. 1999 Nov 1;61(3):298-306. doi: 10.1006/geno.1999.5964. Genomics. 1999. PMID: 10552931 - Identification of rat Gas7 isoforms differentially expressed in brain and regulated following kainate-induced neuronal injury.
Chang PY, Kuo JT, Lin-Chao S, Chao CC. Chang PY, et al. J Neurosci Res. 2005 Mar 15;79(6):788-97. doi: 10.1002/jnr.20409. J Neurosci Res. 2005. PMID: 15657892 - Gas7 functions with N-WASP to regulate the neurite outgrowth of hippocampal neurons.
You JJ, Lin-Chao S. You JJ, et al. J Biol Chem. 2010 Apr 9;285(15):11652-66. doi: 10.1074/jbc.M109.051094. Epub 2010 Feb 11. J Biol Chem. 2010. PMID: 20150425 Free PMC article. - From clusters to stripes: the developmental origins of adult cerebellar compartmentation.
Larouche M, Hawkes R. Larouche M, et al. Cerebellum. 2006;5(2):77-88. doi: 10.1080/14734220600804668. Cerebellum. 2006. PMID: 16818382 Review.
Cited by
- DNA methylation profiles and biomarkers of oral squamous cell carcinoma.
Li YF, Hsiao YH, Lai YH, Chen YC, Chen YJ, Chou JL, Chan MW, Lin YH, Tsou YA, Tsai MH, Tai CK. Li YF, et al. Epigenetics. 2015;10(3):229-36. doi: 10.1080/15592294.2015.1006506. Epigenetics. 2015. PMID: 25612142 Free PMC article. - Cortisol Acting Through the Glucocorticoid Receptor Is Not Involved in Exercise-Enhanced Growth, But Does Affect the White Skeletal Muscle Transcriptome in Zebrafish (Danio rerio).
Palstra AP, Mendez S, Dirks RP, Schaaf MJM. Palstra AP, et al. Front Physiol. 2019 Jan 14;9:1889. doi: 10.3389/fphys.2018.01889. eCollection 2018. Front Physiol. 2019. PMID: 30692930 Free PMC article. - Growth arrest-specific protein 7 regulates the murine M1 alveolar macrophage polarization.
Xu Q, Liu X, Wang X, Hua Y, Wang X, Chen J, Li J, Wang Y, Stoeger T, Chen S, Huang N. Xu Q, et al. Immunol Res. 2017 Oct;65(5):1065-1073. doi: 10.1007/s12026-017-8948-5. Immunol Res. 2017. PMID: 28895026 - Fine-mapping and cell-specific enrichment at corneal resistance factor loci prioritize candidate causal regulatory variants.
Jiang X, Dellepiane N, Pairo-Castineira E, Boutin T, Kumar Y, Bickmore WA, Vitart V. Jiang X, et al. Commun Biol. 2020 Dec 11;3(1):762. doi: 10.1038/s42003-020-01497-w. Commun Biol. 2020. PMID: 33311554 Free PMC article. - Adiposity Alters Genes Important in Inflammation and Cell Cycle Division in Human Cumulus Granulosa Cell.
Merhi Z, Polotsky AJ, Bradford AP, Buyuk E, Chosich J, Phang T, Jindal S, Santoro N. Merhi Z, et al. Reprod Sci. 2015 Oct;22(10):1220-8. doi: 10.1177/1933719115572484. Epub 2015 Feb 11. Reprod Sci. 2015. PMID: 25676576 Free PMC article.
References
- Schneider C, King R M, Philipson L. Cell. 1988;54:787–793. - PubMed
- Adlkofer K, Martini R, Aguzzi A, Zielasek J, Toyka K V, Suter U. Nat Genet. 1995;11:274–280. - PubMed
Publication types
MeSH terms
Substances
LinkOut - more resources
Full Text Sources
Other Literature Sources
Molecular Biology Databases


