The deafness-associated mitochondrial DNA mutation at position 7445, which affects tRNASer(UCN) precursor processing, has long-range effects on NADH dehydrogenase subunit ND6 gene expression - PubMed (original) (raw)
The deafness-associated mitochondrial DNA mutation at position 7445, which affects tRNASer(UCN) precursor processing, has long-range effects on NADH dehydrogenase subunit ND6 gene expression
M X Guan et al. Mol Cell Biol. 1998 Oct.
Abstract
The pathogenetic mechanism of the deafness-associated mitochondrial DNA (mtDNA) T7445C mutation has been investigated in several lymphoblastoid cell lines from members of a New Zealand pedigree exhibiting the mutation in homoplasmic form and from control individuals. We show here that the mutation flanks the 3' end of the tRNASer(UCN) gene sequence and affects the rate but not the sites of processing of the tRNA precursor. This causes an average reduction of approximately 70% in the tRNASer(UCN) level and a decrease of approximately 45% in protein synthesis rate in the cell lines analyzed. The data show a sharp threshold in the capacity of tRNASer(UCN) to support the wild-type protein synthesis rate, which corresponds to approximately 40% of the control level of this tRNA. Strikingly, a 7445 mutation-associated marked reduction has been observed in the level of the mRNA for the NADH dehydrogenase (complex I) ND6 subunit gene, which is located approximately 7 kbp upstream and is cotranscribed with the tRNASer(UCN) gene, with strong evidence pointing to a mechanistic link with the tRNA precursor processing defect. Such reduction significantly affects the rate of synthesis of the ND6 subunit and plays a determinant role in the deafness-associated respiratory phenotype of the mutant cell lines. In particular, it accounts for their specific, very significant decrease in glutamate- or malate-dependent O2 consumption. Furthermore, several homoplasmic mtDNA mutations affecting subunits of NADH dehydrogenase may play a synergistic role in the establishment of the respiratory phenotype of the mutant cells.
Figures
FIG. 1
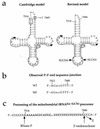
Site of the mutation at position 7445 in the mitochondrial tRNASer(UCN) precursor and effect of the mutation on tRNA processing. (a) Structure of circularized tRNA according to the Cambridge model (2) and the revised model (47). SUCN4 and SUCN3 indicate the two oligonucleotides utilized for the synthesis of the first and second strands of the cDNA, respectively. (b) Sequence of the 5′-3′ end junction determined in eight cDNA clones from wild-type (WT) HeLa cell mitochondrial tRNASer(UCN) and five cDNA clones from the mitochondrial tRNASer(UCN) of the mutant (MT) lymphoblastoid cell line IV-5. (c) Processing sites in the mitochondrial tRNASer(UCN) precursor, experimentally determined for RNase P and predicted from the sequencing data for the 3′ endonuclease.
FIG. 2
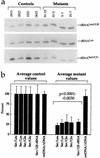
Determination of the amount of mitochondrial tRNASer(UCN) and of the mtDNA content in control and mutant lymphoblastoid cell lines. (a) Equal amounts of total mitochondrial nucleic acid samples from the various cell lines were electrophoresed under nonacid conditions, electroblotted, and hybridized with 5′-end 32P-labeled oligonucleotide probes specific for the mitochondrial tRNASer(UCN), tRNALys, and tRNALeu(UUR). (b) Average relative mitochondrial tRNASer(UCN) content per cell, normalized to the average content per cell of mitochondrial tRNALeu(UUR), tRNALys, tRNAGln, tRNAGlu, or 12S rRNA in the four control cell lines and in the four mutant cell lines. The values for the latter are expressed as percentages of the average values for the control cell lines. The calculations were based on one to three independent determinations of tRNASer(UCN) content in each cell line and on one to three determinations of the content of each of the five reference RNA markers in two control cell lines (0913 and 1032) and two mutant cell lines (IV-7 and IV-5) and of the content of tRNALeu(UUR) and 12S rRNA in the other two control cell lines (0615 and 0923) and two mutant cell lines (IV-15 and V-7). The average mtDNA content per cell in the mutant cell lines, normalized relative to the hybridization to a nuclear 28S rRNA probe and expressed as a percentage of the average value determined in the control cell lines, is also shown. Six mtDNA determinations were made for each cell line. See Materials and Methods for details. The error bars indicate two standard errors of the mean; P indicates the significance, according to the ANOVA test, of the difference between mutant and control values for tRNASer(UCN) normalized to the values for each reference marker.
FIG. 3
Genetic and transcription maps of the human mitochondrial genome. The two inner circles show the positions of the two rRNA genes, 16S and 12S (black bars), of the reading frames (white bars) and of the tRNA genes (solid circles). The outer portion of the diagram shows the transcripts of the whole H-strand transcription unit (black bars), the H-strand rDNA transcription unit (white bars), and the L-strand transcription unit (hatched bars; in the three longest ones, RNAs 1, 2 and 3, and in ND6 mRNA, the black portion represents the ND6 reading frame). COI, COII, and COIII are subunits I, II, and III of cytochrome c oxidase, respectively; ND1, ND2, ND3, ND4, ND4L, ND5, and ND6 are subunits 1, 2, 3, 4, 4L, 5, and 6 of the respiratory chain NADH dehydrogenase, respectively; and A6 and A8 are subunits 6 and 8 of the H+-ATPase. cyt.b, apocytochrome b; OH and OL, origin of H-strand and L-strand synthesis, respectively, with arrows indicating the direction of synthesis; F-met, formylmethionyl.
FIG. 4
Electrophoretic patterns of the mitochondrial translation products of the lymphoblastoid cell lines, VA2B cells, and 143B.TK− (143B) cells labeled for 30 min with [35S]methionine in the presence of 100 μg of emetine per ml. Samples containing equal amounts of protein (30 μg), except the 143B.TK− and VA2B samples, which contained 15 μg of protein, were run through SDS–15 to 20% exponential polyacrylamide gradient gels. The three panels represent electrophoretic patterns obtained in separate gel runs, each one including the 143B.TK− control for normalization purposes. The intensities of the bands were quantified by densitometric analysis of appropriate exposures of the fluorograms. The faster migration of the ND1 and ND3 polypeptides is indicated by the arrows in panels a and c. For an explanation of abbreviations, see the legend to Fig. 3.
FIG. 5
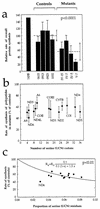
Quantification of the overall rates of synthesis of the mitochondrial translation products after a 30-min [35S]methionine pulse in different lymphoblastoid cell lines and relationship of the rates of synthesis of the individual polypeptides to their serine (UCN) residue content. (a) Three independent labeling experiments and two electrophoretic analyses of the mitochondrial translation products after each labeling were performed for each cell line. The individual values for the rates of overall mitochondrial protein labeling in the various cell lines, determined as detailed in Materials and Methods, were normalized relative to the value for 143B.TK− cells in each gel, and the mean relative value for each cell line was expressed as a percentage of the average normalized value obtained for the control cell lines, with error bars representing 2 standard errors of the mean. The horizontal dashed lines represent the average value for the control and mutant cell lines, and the vertical arrows represent 2 standard errors of the mean for the two groups. P indicates the significance, according to the ANOVA test, of the difference between mutant and control values. (b) Relationship between the average rate of labeling of the individual mitochondrial translation products in the mutant cell lines, expressed relative to the average value in the control cell lines, and the number of serine (UCN) residues that they contain. CYTB, apocytochrome b. (c) Relationship between average relative rate of synthesis of the individual polypeptides in the mutant cell lines and the proportion of serine (UCN) residues that they contain. The curve shown describes the equation _Rx = R_0{0.1/[0.1(1 − x) + 1.5_x_]}, whose parameters have been optimized to make the best fit to the data. In this equation, Rx is the rate of labeling of a polypeptide having x proportion of serine (UCN) residues in mutant cells relative to the rate in wild-type cells, the rates being expressed as reciprocals of the times required for their synthesis (see text for details).
FIG. 6
Identification and quantification of the ND6 mRNA in control and mutant lymphoblastoid cell lines. (a) Equal amounts (20 μg) of total cell RNA from the mutant cell lines IV-15 and IV-5 and the control cell lines 0923 and 1032 were electrophoresed through a 1.4% agarose-formaldehyde gel, transferred to a Zeta-probe membrane, and hybridized first with a 32P-labeled ND6-specific ssDNA probe, and subsequently (after the blot was stripped) with a human mtDNA probe 32P labeled by random priming. After a further restripping of the blot, the RNA was rehybridized with an ND6-specific RNA probe (riboprobe). See Materials and Methods for details. (b) Average relative ND6 mRNA content per cell normalized to the average content per cell of 7S RNA, 12S rRNA, 16S rRNA, and mRNAs in three control cell lines (0913, 0923, and 1032) and three mutant cell lines (IV-15, IV-7, and IV-5). The values for the latter are expressed as percentages of the average values for the control cell lines. Two independent determinations of ND6 mRNA content and one determination of the content of each of the four RNA reference markers for each cell line were used in the calculations. Graph details and symbols are explained in the legend to Fig. 2b.
FIG. 7
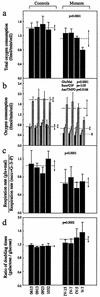
Respiration and growth assays. (a) Average rates of total O2 consumption per cell measured in different lymphoblastoid cell lines. Four to eight determinations were carried out for each cell line. (b) Polarographic analysis of O2 consumption in digitonin-permeabilized cells of different cell lines with different substrates. The activities of the various components of the respiratory chain were determined as respiration dependent on glutamate or malate (Glu/Mal) (solid bars; group averages indicated by dotted lines), succinate or glycerol-3-phosphate (G-3-P) (Succ/G3P) (shaded bars; group averages indicated by short-dash lines), or ascorbate plus TMPD (Asc/TMPD) (cross-hatched bars; group averages indicated by long-dash lines). Three to eight determinations were carried out for each cell line. (c) Ratios of glutamate and malate (glu+mal)-driven respiration to succinate and G-3-P (succ+G–3–P)-driven respiration. (d) Ratios of DTs in galactose-containing medium to DTs in glucose-containing medium in different cell lines. Four determinations were carried out for each cell line. Graph details and symbols are explained in the legend to Fig. 5a.
FIG. 8
Relationship between the relative level of tRNASer(UCN) and relative rate of mitochondrial protein synthesis in mutant (solid circles) and wild-type (open circles) cell lines. The values of each parameter for the different cell lines are expressed as percentages of the average values for the control cell lines.
FIG. 9
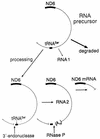
Model illustrating the possible role of the tRNASer(UCN) precursor processing on the stabilization by polyadenylation of the L-strand transcript RNA 2. See text for details.
Similar articles
- Biochemical characterization of the mitochondrial tRNASer(UCN) T7511C mutation associated with nonsyndromic deafness.
Li X, Fischel-Ghodsian N, Schwartz F, Yan Q, Friedman RA, Guan MX. Li X, et al. Nucleic Acids Res. 2004 Feb 11;32(3):867-77. doi: 10.1093/nar/gkh226. Print 2004. Nucleic Acids Res. 2004. PMID: 14960712 Free PMC article. - The 7472insC mitochondrial DNA mutation impairs the synthesis and extent of aminoacylation of tRNASer(UCN) but not its structure or rate of turnover.
Toompuu M, Yasukawa T, Suzuki T, Hakkinen T, Spelbrink JN, Watanabe K, Jacobs HT. Toompuu M, et al. J Biol Chem. 2002 Jun 21;277(25):22240-50. doi: 10.1074/jbc.M200338200. Epub 2002 Mar 27. J Biol Chem. 2002. PMID: 11919191 - Biochemical characterization of the deafness-associated mitochondrial tRNASer(UCN) A7445G mutation in osteosarcoma cell cybrids.
Li X, Zhang LS, Fischel-Ghodsian N, Guan MX. Li X, et al. Biochem Biophys Res Commun. 2005 Mar 11;328(2):491-8. doi: 10.1016/j.bbrc.2005.01.006. Biochem Biophys Res Commun. 2005. PMID: 15694374 - [Mutations of mitochondrial tRNASer(UCN) and their connection with hearing loss].
Fan W, Tang X, Zheng B, Guan M, Xue L. Fan W, et al. Zhonghua Yi Xue Yi Chuan Xue Za Zhi. 2017 Feb 10;34(1):128-132. doi: 10.3760/cma.j.issn.1003-9406.2017.01.030. Zhonghua Yi Xue Yi Chuan Xue Za Zhi. 2017. PMID: 28186612 Review. Chinese. - The role of mitochondrial DNA mutations in hearing loss.
Ding Y, Leng J, Fan F, Xia B, Xu P. Ding Y, et al. Biochem Genet. 2013 Aug;51(7-8):588-602. doi: 10.1007/s10528-013-9589-6. Epub 2013 Apr 21. Biochem Genet. 2013. PMID: 23605717 Review.
Cited by
- Mutation in TRMU related to transfer RNA modification modulates the phenotypic expression of the deafness-associated mitochondrial 12S ribosomal RNA mutations.
Guan MX, Yan Q, Li X, Bykhovskaya Y, Gallo-Teran J, Hajek P, Umeda N, Zhao H, Garrido G, Mengesha E, Suzuki T, del Castillo I, Peters JL, Li R, Qian Y, Wang X, Ballana E, Shohat M, Lu J, Estivill X, Watanabe K, Fischel-Ghodsian N. Guan MX, et al. Am J Hum Genet. 2006 Aug;79(2):291-302. doi: 10.1086/506389. Epub 2006 Jun 22. Am J Hum Genet. 2006. PMID: 16826519 Free PMC article. - The RNase P associated with HeLa cell mitochondria contains an essential RNA component identical in sequence to that of the nuclear RNase P.
Puranam RS, Attardi G. Puranam RS, et al. Mol Cell Biol. 2001 Jan;21(2):548-61. doi: 10.1128/MCB.21.2.548-561.2001. Mol Cell Biol. 2001. PMID: 11134342 Free PMC article. - Polyadenylation and degradation of human mitochondrial RNA: the prokaryotic past leaves its mark.
Slomovic S, Laufer D, Geiger D, Schuster G. Slomovic S, et al. Mol Cell Biol. 2005 Aug;25(15):6427-35. doi: 10.1128/MCB.25.15.6427-6435.2005. Mol Cell Biol. 2005. PMID: 16024781 Free PMC article. - Mitochondrial threshold effects.
Rossignol R, Faustin B, Rocher C, Malgat M, Mazat JP, Letellier T. Rossignol R, et al. Biochem J. 2003 Mar 15;370(Pt 3):751-62. doi: 10.1042/BJ20021594. Biochem J. 2003. PMID: 12467494 Free PMC article. Review.
References
- Anderson S, Bankier A T, Barrell B G, de Bruijn M H L, Coulson A R, Drouin J, Eperon I C, Nierlich D P, Rose B A, Sanger F, Schreier P H, Smith A J H, Staden R, Young I G. Comparison of the human and bovine mitochondrial genomes. In: Slonimski P, Borst P, Attardi G, editors. Mitochondrial genes. Cold Spring Harbor, N.Y: Cold Spring Harbor Laboratory; 1982. pp. 5–43.
- Anderson S, Bankier A T, Barrell B G, de Bruijn M H L, Coulson A R, Drouin J, Eperon I C, Nierlich D P, Rose B A, Sanger F, Schreier P H, Smith A J H, Staden R, Young I G. Sequence and organization of the human mitochondrial genome. Nature. 1981;290:457–465. - PubMed
- Attardi G, Chomyn A, King M P, Kruse B, Polosa P L, Murdter N N. Regulation of mitochondrial gene expression in mammalian cells. Biochem Soc Trans. 1990;18:509–513. - PubMed
Publication types
MeSH terms
Substances
Grants and funding
- F32 DC000142/DC/NIDCD NIH HHS/United States
- R01 GM011726/GM/NIGMS NIH HHS/United States
- 5RO1 DC 0142-04/DC/NIDCD NIH HHS/United States
- GM11726/GM/NIGMS NIH HHS/United States
LinkOut - more resources
Full Text Sources
