Dendritic hyperpolarization-activated currents modify the integrative properties of hippocampal CA1 pyramidal neurons - PubMed (original) (raw)
Dendritic hyperpolarization-activated currents modify the integrative properties of hippocampal CA1 pyramidal neurons
J C Magee. J Neurosci. 1998.
Abstract
Step hyperpolarizations evoked slowly activating, noninactivating, and slowly deactivating inward currents from membrane patches recorded in the cell-attached patch configuration from the soma and apical dendrites of hippocampal CA1 pyramidal neurons. The density of these hyperpolarization-activated currents (Ih) increased over sixfold from soma to distal dendrites. Activation curves demonstrate that a significant fraction of Ih channels is active near rest and that the range is hyperpolarized relatively more in the distal dendrites. Ih activation and deactivation kinetics are voltage-and temperature-dependent, with time constants of activation and deactivation decreasing with hyperpolarization and depolarization, respectively. Ih demonstrated a mixed Na+-K+ conductance and was sensitive to low concentrations of external CsCl. Dual whole-cell recordings revealed regional differences in input resistance (Rin) and membrane polarization rates (taumem) across the somatodendritic axis that are attributable to the spatial gradient of Ih channels. As a result of these membrane effects the propagation of subthreshold voltage transients is directionally specific. The elevated dendritic Ih density decreases EPSP amplitude and duration and reduces the time window over which temporal summation takes place. The backpropagation of action potentials into the dendritic arborization was impacted only slightly by dendritic Ih, with the most consistent effect being a decrease in dendritic action potential duration and an increase in afterhyperpolarization. Overall, Ih acts to dampen dendritic excitability, but its largest impact is on the subthreshold range of membrane potentials where the integration of inhibitory and excitatory synaptic inputs takes place.
Figures
Fig. 1.
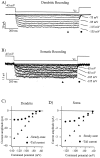
Step hyperpolarizations (1 sec duration) evoke slowly activating and noninactivating inward currents from cell-attached patches located in the apical dendrites (A) and somata (B) of CA1 pyramidal neurons. C, D, Current–voltage relationships for the recordings that are shown above. Steady-state current amplitudes (filled triangles) are the averages of all points at 900–910 msec after the start of hyperpolarizing step. Tail current amplitudes (filled circles) are the averages of all points at 4.5–5.5 msec after repolarization. The holding potentials and series of command potentials (_V_c) are shown in the figure. Bath temperature was 33°C for all of the recordings shown. The number of points in each trace has been reduced by one-half for clarity.
Fig. 2.
Hyperpolarization-evoked current amplitude increases with distance from soma. A, In a cell-attached patch located in the apical dendrites (310 μm), steps from −45 to −125 mV evoked inward currents were approximately sixfold larger than those recorded from the soma of the same CA1 pyramidal neuron.B, Plot of mean current amplitude (at −125 to −130 mV), normalized to patch area, for recordings across the somatodendritic axis. The number of recordings for each point is shown in parentheses. Error bars indicate SEM.C, I_h evoked by a step hyperpolarization from −50 to −130 mV in physiological recording solution. The patch is located ∼315 μm from the soma. On the_right side of the figure is the peak Na+ current evoked in the same patch by a step from −90 to −10 mV, which is used for comparison. Bath temperature was 22°C for recordings shown in A and 33°C for those in_C_. The number of points in each_I_h trace has been reduced by one-half for clarity.
Fig. 3.
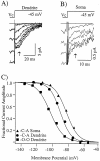
Voltage ranges of activation for dendritic channels are shifted in a hyperpolarized direction, as compared with those located at the soma. The slow deactivation of hyperpolarization-activated currents allows activation curves to be generated directly from the tail currents that are present after repolarization from command potentials (V_c). Representative tail currents are shown for cell-attached patches located in the dendritic (310 μm) (A) and somatic regions (B) of CA1 pyramidal neurons. Arrows indicate locations at which the tail current amplitude was measured. C, Activation curves generated from the currents that are shown_above. The dendritic curve (_V_1/2 = −89 mV; k = 6;filled triangles) is shifted 6 mV hyperpolarized with respect to the somatic curve (_V_1/2 = −83 mV; k = 7; filled circles). Slope factors (k) for the two curves are similar. A representative activation curve for a patch recorded in the outside-out configuration (_V_1/2 = −102 mV;k = 8; filled squares) also is shown for comparison. Command potentials (V_c) were given in 10 mV increments from −65 to −135 mV in A and from −65 to −125 in_B. Bath temperature was 33°C for all of the recordings shown.
Fig. 4.
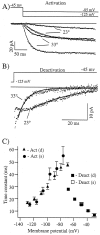
Activation and deactivation kinetics are highly temperature-dependent. A, The activation rate of currents evoked by step hyperpolarizations from −45 to −85 and to −125 mV increases nearly fivefold for a 10°C increase in bath temperature. Curves are well fit by single exponential functions (solid lines). B, The deactivation rate of currents present after repolarization from −125 to −45 show a similar temperature dependence. After a short plateau region the current decays are well fit by single exponential functions (solid lines). C, Plot of activation time constants as a function of command potential for both dendritic (filled triangles) and somatic recordings (filled circles). Deactivation time constants for a range of membrane potentials are shown for dendritic recordings (filled squares) and for somatic recordings (open squares) at a single potential. Holding and command potentials are shown in the figure. The currents that are shown are from a single dendritic recording (260 μm). The number of points in each trace in A has been reduced to 18 for clarity.
Fig. 5.
The presence of external Na+slows the deactivation rate and shifts the voltage range of activation of hyperpolarization-activated currents. A, Current relaxations after a step depolarization from −130 to −50 mV with 0 Na+ in external solution. The current is well fit by a single exponential function (τ is shown). B, Current relaxations after a step depolarization from −125 to −45 mV with 60 m
m
Na+ in external solution, showing slowed deactivation kinetics. The current is well fit by a single exponential function (τ is shown). C, Voltage range of activation for the patch that is shown above in the presence of 60 m
m
external Na+. The_dashed line_ is a representative activation curve for hyperpolarization-activated current with 0 m
m
external Na+. External Na+ shifts the activation range nearly 10 mV depolarized, without any obvious effect on k. The currents that are shown are from two different dendritic recordings at 33°C.
Fig. 6.
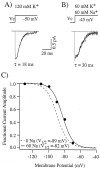
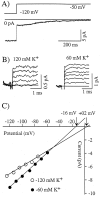
Reversal potential of hyperpolarization-activated currents indicates mixed ion conductance. A, Current relaxation after a step depolarization from approximately −120 to −50 mV. B, Left, Current relaxations shown at a faster time scale for conditions in which 120 m
m
K+/0 m
m
Na+ was present in the external pipette solution for potentials ranging from −125 to −85 mV. B, Right, Current relaxations shown for conditions in which 60 m
m
K+/60 m
m
Na+ was present in the external pipette solution for potentials ranging from −120 to −70 mV (from the same recording as in A).C, Current–voltage relationships for the above currents. Reversal potentials for the two conditions are indicated on the plot. The currents that are shown are from two different dendritic recordings at 23°C.
Fig. 7.
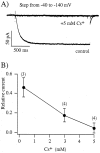
External CsCl blocks hyperpolarization-activated currents. A, Currents activated by step hyperpolarizations from −40 to −140 mV under control conditions and in the presence of 5 m
m
CsCl in the external solution (high K+). In this patch, 5 m
m
Cs blocked >95% of the evoked current. B, Plot of relative current remaining after wash-in of a solution containing three different concentrations of Cs+. The currents that are shown are from a dendritic patch in an outside-out configuration at 23°C. The number of points in each trace has been reduced by one-half for clarity.
Fig. 8.
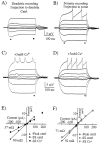
_I_h generates a spatially nonuniform input resistance. A, Dendritic voltage recording with transients generated in response to 300 msec current injections through the dendritic recording electrode under control conditions and in the presence of 3 m
m
CsCl (C). B, Somatic voltage recording with transients generated in response to 300 msec current injections through the somatic recording electrode under control conditions and in the presence of 3 m
m
CsCl (D). All traces are from dual simultaneous whole-cell recordings from the soma and dendrites (∼255 μm) of the same cell. Current injections were −200, −100, −20, −10, +10, +50, +100, and +200 pA.E, F, Current–voltage relationships for the dendritic (E) and somatic (F) recordings that are shown_above_. The lines are linear regressions of data points for −20, −10, +10, and +50 pA current injections. Note that dendritic _R_in is much lower than somatic _R_in under control conditions and that Cs+ increases dendritic_R_in a greater amount so that the initial difference between soma and dendrite is nearly removed.
Fig. 9.
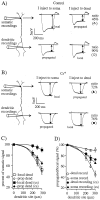
I_h shapes subthreshold voltage propagation. A, Simultaneous whole-cell voltage recordings under control conditions from the soma (top) and dendrites (bottom) of the same neuron in response to somatic (left column) and dendritic (right column) current injections (−200 pA, 300 msec). To the_extreme right are the ratios of propagated-to-local signal amplitude for somatic (top) and dendritic recordings (bottom). Note that in the dendritic recordings (lower traces) the final amplitude of the propagated signal (lower left) is very similar (90%) to that produced by local current injection (lower right). This is not the case for the somatic recordings (upper traces). B, Simultaneous whole-cell voltage recordings with 3 m
m
CsCl in bath. In Cs+, current injections were −100 pA for 300 msec to maintain a 5–10 mV voltage change. C, Plot of local and propagated voltage changes occurring with distance from the soma. Local signals are voltage changes recorded at the site of current injection and are expressed relative to the somatic voltage change for somatic current injection (open squares in control and_filled squares_ in Cs+). Propagated signals are voltage changes recorded at a site distal to the current injection and also are expressed relative to the local somatic voltage change (open diamonds in control and filled diamonds in Cs+). Data points_are fit arbitrarily by Gaussian functions. D, Plot of the ratio of propagated-tolocal voltage changes occurring with distance from the soma. From the dendritic recording site (open circles in control and filled circles in Cs+), the propagated-to-local signal ratios are the amplitude of the dendritic voltage change in response to somatic current injection divided by the amplitude of the dendritic voltage change in response to a dendritic current injection. From the somatic recording site (open triangles in control and_filled triangles in Cs+), the propagated-to-local signal ratios are the amplitude of the somatic voltage change in response to dendritic current injection divided by the amplitude of the somatic voltage change in response to a somatic current injection. All points are expressed as relative to the local somatic voltage signal and are plotted with respect to the location of the dendritic recording site.Data points are fit arbitrarily by polynomial functions, except for control dendritic recordings, which are fit with a_line_.
Fig. 10.
_I_h contributes to a faster dendritic membrane charging rate. Shown are somatic and dendritic voltage transients (200 pA, 50 msec) under control conditions (A) and with external 3 m
m
CsCl (B). The same traces are grouped by location, showing the slowing effect of 3 m
m
CsCl on the dendritic (C) and somatic compartments (D). E, Expanded traces from_A_ and B showing voltage relaxations and their fits by single exponential functions. Note that dendritic repolarization is faster than that observed at the soma even in the presence of 3 m
m
CsCl. F, Plot of repolarization time constants for control conditions (open bars; n = 5) and in the presence of 3 m
m
CsCl (filled bars;n = 5).
Fig. 11.
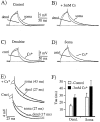
EPSP amplitude, duration, and summation are all regulated by _I_h. A, A single exponential current injection (340 pA, τrise = 2 msec and τdecay = 20 msec) into the dendrite (250 μm) produced an EPSP-shaped voltage transient, the amplitude and duration of which were increased in 3 m
m
CsCl. Attenuation of the single EPSP-shaped transients was similar in both control and Cs+ conditions (63 ± 3% vs 64 ± 4%, respectively; n = 6). B, Repetitive exponential current injections (5–790 pA) produced a train of EPSP-shaped voltage transients, the peak amplitude and duration of which also were increased in 3 m
m
CsCl. Attenuation of the EPSP-shaped voltage trains was reduced slightly in the presence of external Cs+ when compared with control (58 ± 5% vs 64 ± 5%, respectively; n = 6).D, Pooled data for the somatic (S) and dendritic (D) EPSP amplitudes for the first and fifth current injections during a train under control conditions (open bars) and in the presence of 3 m
m
CsCl (filled bars). E, Pooled data for the somatic (S) and dendritic (D) EPSP durations for trains and single current injections under control conditions (open bars) and in the presence of 3 m
m
CsCl (filled bars).
Fig. 12.
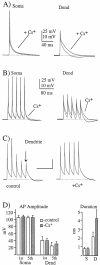
Action potential backpropagation is affected only slightly by dendritic _I_h. A, Dual whole-cell recordings from the soma and dendrite (∼290 μm) with a single action potential evoked by a suprathreshold exponential current injection into the soma (1.2 nA). _I_hblockade does not improve dendritic action potential propagation but does slow the more hyperpolarized components of repolarization in both the soma and dendrite. B, In the same cell the propagation of short trains (30 Hz) of action potentials likewise was unaffected by Cs+. The rates of membrane repolarization between the spikes and a prominent dendritic afterhyperpolarization are, however, all reduced by_I_h blockade. Similar results also were observed for 15 Hz trains. C, In some cells (two of six) the frequency dependence of action potential amplitude was reduced by external 3 m
m
CsCl. D, Pooled data for somatic and dendritic action potential amplitude (_1st_and 5th spikes in the train) and duration (single spikes; S, somatic; D, dendritic) under control conditions (open bars) and in the presence of 3 m
m
CsCl (filled bars).
Similar articles
- Calcium-activated potassium conductances contribute to action potential repolarization at the soma but not the dendrites of hippocampal CA1 pyramidal neurons.
Poolos NP, Johnston D. Poolos NP, et al. J Neurosci. 1999 Jul 1;19(13):5205-12. doi: 10.1523/JNEUROSCI.19-13-05205.1999. J Neurosci. 1999. PMID: 10377332 Free PMC article. - Dichotomy of action-potential backpropagation in CA1 pyramidal neuron dendrites.
Golding NL, Kath WL, Spruston N. Golding NL, et al. J Neurophysiol. 2001 Dec;86(6):2998-3010. doi: 10.1152/jn.2001.86.6.2998. J Neurophysiol. 2001. PMID: 11731556 - Dendritic voltage-gated ion channels regulate the action potential firing mode of hippocampal CA1 pyramidal neurons.
Magee JC, Carruth M. Magee JC, et al. J Neurophysiol. 1999 Oct;82(4):1895-901. doi: 10.1152/jn.1999.82.4.1895. J Neurophysiol. 1999. PMID: 10515978 - High dendritic expression of Ih in the proximity of the axon origin controls the integrative properties of nigral dopamine neurons.
Engel D, Seutin V. Engel D, et al. J Physiol. 2015 Nov 15;593(22):4905-22. doi: 10.1113/JP271052. Epub 2015 Oct 12. J Physiol. 2015. PMID: 26350173 Free PMC article. - Control of Na+ spike backpropagation by intracellular signaling in the pyramidal neuron dendrites.
Tsubokawa H. Tsubokawa H. Mol Neurobiol. 2000 Aug-Dec;22(1-3):129-41. doi: 10.1385/MN:22:1-3:129. Mol Neurobiol. 2000. PMID: 11414276 Review.
Cited by
- Active dendrites mediate stratified gamma-range coincidence detection in hippocampal model neurons.
Das A, Narayanan R. Das A, et al. J Physiol. 2015 Aug 15;593(16):3549-76. doi: 10.1113/JP270688. Epub 2015 Jun 25. J Physiol. 2015. PMID: 26018187 Free PMC article. - Input-Output Relationship of CA1 Pyramidal Neurons Reveals Intact Homeostatic Mechanisms in a Mouse Model of Fragile X Syndrome.
Booker SA, Simões de Oliveira L, Anstey NJ, Kozic Z, Dando OR, Jackson AD, Baxter PS, Isom LL, Sherman DL, Hardingham GE, Brophy PJ, Wyllie DJA, Kind PC. Booker SA, et al. Cell Rep. 2020 Aug 11;32(6):107988. doi: 10.1016/j.celrep.2020.107988. Cell Rep. 2020. PMID: 32783927 Free PMC article. - Analogous synaptic plasticity profiles emerge from disparate channel combinations.
Anirudhan A, Narayanan R. Anirudhan A, et al. J Neurosci. 2015 Mar 18;35(11):4691-705. doi: 10.1523/JNEUROSCI.4223-14.2015. J Neurosci. 2015. PMID: 25788686 Free PMC article. - Neuronal mechanisms underlying opioid-induced respiratory depression: our current understanding.
Ramirez JM, Burgraff NJ, Wei AD, Baertsch NA, Varga AG, Baghdoyan HA, Lydic R, Morris KF, Bolser DC, Levitt ES. Ramirez JM, et al. J Neurophysiol. 2021 May 1;125(5):1899-1919. doi: 10.1152/jn.00017.2021. Epub 2021 Apr 7. J Neurophysiol. 2021. PMID: 33826874 Free PMC article. Review. - Unique membrane properties and enhanced signal processing in human neocortical neurons.
Eyal G, Verhoog MB, Testa-Silva G, Deitcher Y, Lodder JC, Benavides-Piccione R, Morales J, DeFelipe J, de Kock CP, Mansvelder HD, Segev I. Eyal G, et al. Elife. 2016 Oct 6;5:e16553. doi: 10.7554/eLife.16553. Elife. 2016. PMID: 27710767 Free PMC article.
References
- Banks MI, Pearce RA, Smith PH. Ih in neurons of the medial nucleus of the trapezoid body: voltage-clamp analysis and enhancement by norepinephrine and cAMP suggest a modulatory mechanism in the auditory brainstem. J Neurophysiol. 1993;70:1420–1432. - PubMed
- DiFrancesco D. Characterization of single pacemaker channels in cardiac sino-atrial cells. Nature. 1986;324:470–473. - PubMed
Publication types
MeSH terms
Substances
LinkOut - more resources
Full Text Sources
Other Literature Sources
Research Materials
Miscellaneous
