Interstitial branches develop from active regions of the axon demarcated by the primary growth cone during pausing behaviors - PubMed (original) (raw)
Interstitial branches develop from active regions of the axon demarcated by the primary growth cone during pausing behaviors
G Szebenyi et al. J Neurosci. 1998.
Abstract
Interstitial branches arise from the axon shaft, sometimes at great distances behind the primary growth cone. After a waiting period that can last for days after extension of the primary growth cone past the target, branches elongate toward their targets. Delayed interstitial branching is an important but little understood mechanism for target innervation in the developing CNS of vertebrates. One possible mechanism of collateral branch formation is that the axon shaft responds to target-derived signals independent of the primary growth cone. Another possibility is that the primary growth cone recognizes the target and demarcates specific regions of the axon for future branching. To address whether behaviors of the primary growth cone and development of interstitial branches are related, we performed high-resolution time-lapse imaging on dissociated sensorimotor cortical neurons that branch interstitially in vivo. Imaging of entire cortical neurons for periods of days revealed that the primary growth cone pauses in regions in which axon branches later develop. Pausing behaviors involve repeated cycles of collapse, retraction, and extension during which growth cones enlarge and reorganize. Remnants of reorganized growth cones are left behind on the axon shaft as active filopodial or lamellar protrusions, and axon branches subsequently emerge from these active regions of the axon shaft. In this study we propose a new model to account for target innervation in vivo by interstitial branching. Our model suggests that delayed interstitial branching results directly from target recognition by the primary growth cone.
Figures
Fig. 1.
Cortical neurons in culture develop processes similar to those in vivo. In A and_B_ minor processes are easily distinguished from the single long primary axon. Arrows indicate axon branches. All of the branches are tipped by growth cones. The etched grids on the coverslips serve as landmarks for identification of the same cells at different times. Times shown indicate hours after plating. The scale bar applies to all images in A and_B_.
Fig. 2.
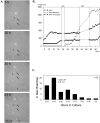
Branches develop from cortical axons over an extended time period. A, Representative images selected from a series of 1320 time-lapse images acquired at 3 min intervals over a period of 3 d. This neuron developed minor processes first (5 hr), followed by elongation of the axon (20–35 hr) and extension of interstitial branches (35–53 hr). The axon is labeled with an_asterisk_. One axon branch (at right) was already present when imaging began, but most of the branches extended as a cluster from the region indicated by the arrows. Times shown indicate hours after plating. B, Time course of elongation of minor processes (squares), the axon (circles), and axon branches (triangles), excluding the initial branch of the neuron shown in A. For minor processes and axon branches, total neurite length, not that of a single neurite, is graphed. Note that before extension of branches elongation of the axon has halted. No data were collected during the gaps, but branches did elongate during these periods. C, Frequency histogram summarizing the time course of branching on 42 axons. Bars show numbers of new branches (n = 58) >30 μm that extended during each of the time periods indicated. Most of the branches extended on the second and third day in culture. Only branches with full recorded histories, from the beginning of branch initiation, were included.
Fig. 3.
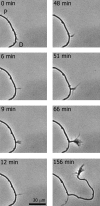
Elongation of an interstitial branch is preceded by the formation of a growth cone. These images illustrate transient filopodial activity (0–48 min) leading to a stable branch over 30 μm led by a growth cone (156 min). This sequence of images was selected from 72 images acquired at 3 min intervals. Time 0 corresponds to 20 hr after plating. As shown in the last frame, once the interstitial branch is advancing forward, the distal segment of the primary axon degenerates. P and D refer to proximal and distal segments of the axon, respectively.
Fig. 4.
Extension of axon branches occurs from regions of the axon in which the primary growth cone undergoes pausing behaviors. During 45–75 hr after plating, the primary growth cone (the_top_ growth cone in the figures) collapsed, retracted, and reextended in the region indicated by the arrows. The arrows in all the figures indicate the same location. After the growth cone reextends (at 75 hr) it changes the angle of its trajectory. In the pausing region of the axon small active protrusions appear (82 hr) from which branches extend (97–120 hr).
Fig. 5.
During prolonged pausing periods, growth cones enlarge and reorganize. A, Graph comparing average velocities of growth cones in 70 μm axon regions that later branched (n = 58 regions from 42 neurons) versus regions that remained unbranched (n = 27 regions from 21 neurons). B, Graph comparing average areas of growth cones during forward extension (growing is defined as growth >25 μm/hr; n = 20) versus pausing (defined as growth <5 μm/hr; n = 20). In A and_B_ error bars are SEs, and _asterisks_indicate p < 0.01 in a two-tailed _t_test. C, Representative example of a growth cone undergoing morphological changes during an 18 hr pausing period. The lamella of the growth cone gradually enlarges over time. At 12 hr the primary growth cone is emerging from the distal tip of the growth cone. By 18 hr the primary growth cone has resumed elongation, and a large lamellar expansion remains behind on the axon shaft.
Fig. 6.
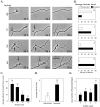
Levels of filopodial and lamellipodial activity remaining on the axon shaft after growth cone reorganization correlate with axon branching. A, Examples from four different neurons, showing different levels of activity along the axon shaft ranging from 0 (no visible activity), 1 (transient filopodial or lamellar activity), 2 (small, lamellar expansions that consolidate into varicosities) to 3 (large, more symmetrical lamellar expansions). Each series of images shows the same region of the axon over time, beginning in each case with the primary growth cone. B, Bar graphs showing percentage of axon regions with activity levels of 0–3 (indicated at bottom right) that either branched or remained unbranched. Note that most of the axon regions with no activity remain unbranched, whereas most axon regions with high levels of activity develop branches. C, Bar graph showing average velocity of the growth cone that gave rise to different levels of axon activity (0–3). Slower rates of growth cone advance correlate with higher levels of axon activity. D, Bar graph showing average levels of activity in unbranched and branched regions of axon shafts. Asterisks indicate p< 0.01 in a two-tailed t test. E, Bar graph showing average number of branches extending from axon regions with different levels of activity. More branches extended from axon regions with higher activity. In C_–_E,numbers above the bars indicate 70 μm axon regions analyzed. Error bars are SEs in each of the graphs.
Fig. 7.
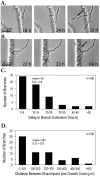
Branches extend from active regions of the axon after varying delays after the primary growth cone has resumed forward advance. A, Series of images showing an example of a branch (arrow) extending at a right angle simultaneously with forward advance of the primary growth cone. This gives the appearance of growth cone bifurcation. B, Series of images showing an example of a branch (arrow) extending after a delay of 47 hr after the primary growth cone has resumed forward advance. By 23 hr the primary growth cone has emerged from the growth cone that is still pausing at 22 hr. By 69 hr the branch (arrow) is extending interstitially from the active region on the axon. C, Frequency histogram showing numbers of branches that extended after varying delays after the primary growth cone had resumed forward advance. D, Frequency histogram showing numbers of branches that extended from the axon at varying distances behind the primary growth cone.
Fig. 8.
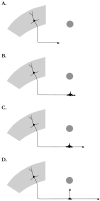
The in vitro results suggest the following model for interstitial branching by cortical neurons_in vivo_. Schematics represent different stages in axon branching. A, Growth cone of an efferent cortical axon is advancing along a pathway toward its target, indicated by the circle. B, In response to target-derived signals, the primary growth cone pauses in the vicinity of the target for extended time periods and enlarges. C, After the primary growth cone has resumed forward advance, remnants of the reorganized growth cone appear as filopodial or lamellar activity along the axon shaft.D, A branch from these active membrane regions extends toward the target after various time delays. Typically, branches extend interstitially some distance behind the primary growth cone. However, when the primary growth cone and the branch extend simultaneously, branching appears to occur by bifurcation (data not shown).
Similar articles
- Common mechanisms underlying growth cone guidance and axon branching.
Kalil K, Szebenyi G, Dent EW. Kalil K, et al. J Neurobiol. 2000 Aug;44(2):145-58. J Neurobiol. 2000. PMID: 10934318 Review. - Fibroblast growth factor-2 promotes axon branching of cortical neurons by influencing morphology and behavior of the primary growth cone.
Szebenyi G, Dent EW, Callaway JL, Seys C, Lueth H, Kalil K. Szebenyi G, et al. J Neurosci. 2001 Jun 1;21(11):3932-41. doi: 10.1523/JNEUROSCI.21-11-03932.2001. J Neurosci. 2001. PMID: 11356881 Free PMC article. - Dynamic behaviors of growth cones extending in the corpus callosum of living cortical brain slices observed with video microscopy.
Halloran MC, Kalil K. Halloran MC, et al. J Neurosci. 1994 Apr;14(4):2161-77. doi: 10.1523/JNEUROSCI.14-04-02161.1994. J Neurosci. 1994. PMID: 8158263 Free PMC article. - Netrin-1 and semaphorin 3A promote or inhibit cortical axon branching, respectively, by reorganization of the cytoskeleton.
Dent EW, Barnes AM, Tang F, Kalil K. Dent EW, et al. J Neurosci. 2004 Mar 24;24(12):3002-12. doi: 10.1523/JNEUROSCI.4963-03.2004. J Neurosci. 2004. PMID: 15044539 Free PMC article. - Axon guidance by growth cones and branches: common cytoskeletal and signaling mechanisms.
Dent EW, Tang F, Kalil K. Dent EW, et al. Neuroscientist. 2003 Oct;9(5):343-53. doi: 10.1177/1073858403252683. Neuroscientist. 2003. PMID: 14580119 Review.
Cited by
- Netrin-1 induces axon branching in developing cortical neurons by frequency-dependent calcium signaling pathways.
Tang F, Kalil K. Tang F, et al. J Neurosci. 2005 Jul 13;25(28):6702-15. doi: 10.1523/JNEUROSCI.0871-05.2005. J Neurosci. 2005. PMID: 16014732 Free PMC article. - Branch management: mechanisms of axon branching in the developing vertebrate CNS.
Kalil K, Dent EW. Kalil K, et al. Nat Rev Neurosci. 2014 Jan;15(1):7-18. doi: 10.1038/nrn3650. Nat Rev Neurosci. 2014. PMID: 24356070 Free PMC article. Review. - Microtubule-associated protein 1B controls directionality of growth cone migration and axonal branching in regeneration of adult dorsal root ganglia neurons.
Bouquet C, Soares S, von Boxberg Y, Ravaille-Veron M, Propst F, Nothias F. Bouquet C, et al. J Neurosci. 2004 Aug 11;24(32):7204-13. doi: 10.1523/JNEUROSCI.2254-04.2004. J Neurosci. 2004. PMID: 15306655 Free PMC article. - Expression of the mitotic motor protein Eg5 in postmitotic neurons: implications for neuronal development.
Ferhat L, Cook C, Chauviere M, Harper M, Kress M, Lyons GE, Baas PW. Ferhat L, et al. J Neurosci. 1998 Oct 1;18(19):7822-35. doi: 10.1523/JNEUROSCI.18-19-07822.1998. J Neurosci. 1998. PMID: 9742151 Free PMC article. - A generative growth model for thalamocortical axonal branching in primary visual cortex.
Kassraian-Fard P, Pfeiffer M, Bauer R. Kassraian-Fard P, et al. PLoS Comput Biol. 2020 Feb 13;16(2):e1007315. doi: 10.1371/journal.pcbi.1007315. eCollection 2020 Feb. PLoS Comput Biol. 2020. PMID: 32053598 Free PMC article.
References
- Aigner L, Arber S, Kapfhammer JP, Laux T, Schneider C, Botteri F, Brenner HR, Caroni P. Overexpression of the neural growth-associated protein GAP-43 induces nerve sprouting in the adult nervous system of transgenic mice. Cell. 1995;83:269–278. - PubMed
- Aoyagi A, Nishikawa K, Saito H, Abe K. Characterization of basic fibroblast growth factor-mediated acceleration of axonal branching in cultured rat hippocampal neurons. Brain Res. 1994;661:117–126. - PubMed
- Baird DH, Baptista CA, Wang LC, Mason CA. Specificity of a target cell-derived stop signal for afferent axonal growth. J Neurobiol. 1992;23:579–591. - PubMed
Publication types
MeSH terms
Grants and funding
- R01 NS014428/NS/NINDS NIH HHS/United States
- R56 NS014428/NS/NINDS NIH HHS/United States
- NS14428/NS/NINDS NIH HHS/United States
- T32 GM007507/GM/NIGMS NIH HHS/United States
- GM07507/GM/NIGMS NIH HHS/United States
LinkOut - more resources
Full Text Sources
Miscellaneous

