Promotion of dendritic growth by CPG15, an activity-induced signaling molecule - PubMed (original) (raw)
Promotion of dendritic growth by CPG15, an activity-induced signaling molecule
E Nedivi et al. Science. 1998.
Abstract
Activity-independent and activity-dependent mechanisms work in concert to regulate neuronal growth, ensuring the formation of accurate synaptic connections. CPG15, a protein regulated by synaptic activity, functions as a cell-surface growth-promoting molecule in vivo. In Xenopus laevis, CPG15 enhanced dendritic arbor growth in projection neurons, with no effect on interneurons. CPG15 controlled growth of neighboring neurons through an intercellular signaling mechanism that requires its glycosylphosphatidylinositol link. CPG15 may represent a new class of activity-regulated, membrane-bound, growth-promoting proteins that permit exquisite spatial and temporal control of neuronal structure.
Figures
Fig. 1
CPG15 induction by kainic acid and its expression in Xenopus optic tectum. (A) Immuno-blot of protein extracts from tadpoles harvested at the specified times after intraventricular injection of KA, or rat hippocampus dentate gyri 24 hours after ip injection of KA (right lane). Incubation with the antiserum to CPG15 labels a 12-kD band (arrow) that is not seen with preimmune serum (PI). Confocal images of sections through the optic tecti of untreated tadpoles (B and C) or tadpoles infected with CPG15VV (D and E) or CPG15t3VV (F and G). Sections probed with preimmune rabbit serum show no specific labeling (B). Outlined on this section are the optic tectal neuropil (N), differentiated tectal neurons (TN), and the proliferative zone (PZ). These same regions can be discerned in the sections stained with the antisera to CPG15 [(C), (E), and (G)]. A honeycomb pattern of endogenous CPG15 immunoreactivity can be seen in the TN region of the tectum, and retinal ganglion cell axons are stained in N (C). Sections from animals infected with virus were double-labeled with anti– β-gal to show extent of infection [(D) and (F)] and with anti-CPG15 at higher magnification [(E) and (G)]. In the infected tecti [(E) and (G)], the honeycomb pattern of CPG15 immunoreactivity also extends into the PZ, where many infected neurons are located [(D) and (F)]. Arrows mark retinotectal axons. Bar, 100 μm for upper panel and 50 μm for lower panels.
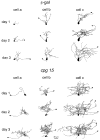
Fig. 2
CPG15 promotes dendritic growth in optic tectal neurons. Drawings of 3D reconstructed projection neurons from β-galVV–infected animals (top panel) and CPG15VV-infected animals (bottom panel) imaged over 3 days. The three neurons shown in each group (from left to right) represent the range of neuronal sizes imaged on the first day. Cell a in each panel has the smallest TDBL from all neurons in its group (CPG15 or control). Cell b has a TDBL closest to the mean branch length of each group, and cell c has the largest TDBL in each group. In all three examples, the neurons in the CPG15 group grew faster and developed a more complex dendritic arbor than did their control counterparts.
Fig. 3
Quantification of CPG15 growth-promoting effect on dendritic arbors. (A) The average TDBL of rostrally projecting CPG15 neurons, β-gal neurons, and uninfected control neurons is plotted over 3 days of imaging. On the first day of imaging, the average TDBL of projection neurons from CPG15VV-infected animals was 447 ± 69 μm (n = 39), significantly larger (P < 0.05) than cells from uninfected (257 ± 31 μm; n = 32) and β-galVV–infected (260 ± 43 μm; n = 22) animals. The disparity in TDBL between cells from CPG15VV-infected and control animals increases on the second day of imaging (14). This difference is maintained on the third day, as both populations continue to grow, at 927 ± 138 μm (n = 24) for CPG15 neurons, compared to 553 ± 53 μm (n = 31) for uninfected and 563 ± 37 μm (n = 19) in β-galVV–infected animals (P < 0.05). (B) Sholl analysis (24) shows that CPG15 increases dendritic arbor density of projection neurons from CPG15VV-infected animals compared to β-galVV controls. Concentric circles with a 10-μm spacing were drawn around the cell body, and the number of intersections of all dendritic branches with the circles was counted. (C) Frequency distribution of projection neuron TDBL values for each day of imaging from animals infected with the CPG15VV, β-galVV, or uninfected controls. For days 1 and 3, respectively, group sizes were n = 39 and n = 24 for CPG15VV, n = 32 and n = 31 for β-galVV, and n = 22 and n = 19 for uninfected. (D) CPG15 increases growth rate of projection neurons while CPG15t3VV slows their growth. The growth rate for projection neurons from β-galVV–, CPG15VV-, or CPG15t3VV-infected animals was determined by subtracting TDBL on day 1 from TDBL on day 2. The growth rate of neurons in CPG15VV-infected animals [308 ± 35 μm/day (n = 39)] was significantly greater (**P < 0.003) than that of β-galVV controls [173 ± 22 μm/day (n = 32)]. In contrast, growth rates of neurons from CPG15t3VV-infected animals [110 ± 24 μm/day (n = 30)] were significantly lower than their β-galVV control counterparts (*P < 0.02).
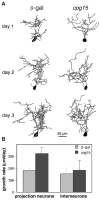
Fig. 4
CPG15 does not affect tectal interneurons. (A) Drawings of interneurons from β-gal– infected animals (left) and CPG15VV-infected animals (right) with a TDBL closest to the mean branch length of each group. (B) The growth rate (TDBL on day 2 – TDBL on day 1) is significantly greater (P < 0.01) for CPG15 projection neurons (_n_ = 17) than control neurons (_n_ = 41). Such a difference in growth rate is not seen between interneurons from control 155 ± 48 μm/day (_n_ = 13) and CPG15VV-infected animals 185 ± 81 μm/day (_n_ = 9) (_P_ > 0.7).
Fig. 5
CPG15 promotes growth through intercellular signaling. (A) A 3D reconstruction of a tectal projection neuron from a CPG15VV-infected animal, with a TDBL of 1684 μm on the first day of imaging (day 1) and 2021 μm on the second day (day 2). This cell is a clear outlier on both days as the largest control cell is 642 μm on the first day of imaging and 1017 μm on the second. (B) Top panel shows a drawing of the tadpole optic tectum (OT) and the tectal ventricle (V) with the marked location of this cell. The green square delineates the region shown in the bottom panel. Bottom panel shows a superimposition of images collected with a 488-nm filter visualizing the DiI-labeled cell imaged in green and images collected with a 647-nm filter visualizing β-gal immunopositive cells in red. The arrow marks the cell imaged in (A).
Similar articles
- Postsynaptic CPG15 promotes synaptic maturation and presynaptic axon arbor elaboration in vivo.
Cantallops I, Haas K, Cline HT. Cantallops I, et al. Nat Neurosci. 2000 Oct;3(10):1004-11. doi: 10.1038/79823. Nat Neurosci. 2000. PMID: 11017173 - Rho GTPases regulate distinct aspects of dendritic arbor growth in Xenopus central neurons in vivo.
Li Z, Van Aelst L, Cline HT. Li Z, et al. Nat Neurosci. 2000 Mar;3(3):217-25. doi: 10.1038/72920. Nat Neurosci. 2000. PMID: 10700252 - Stabilization of dendritic arbor structure in vivo by CaMKII.
Wu GY, Cline HT. Wu GY, et al. Science. 1998 Jan 9;279(5348):222-6. doi: 10.1126/science.279.5348.222. Science. 1998. PMID: 9422694 - Dendritic morphogenesis: building an arbor.
McFarlane S. McFarlane S. Mol Neurobiol. 2000 Aug-Dec;22(1-3):1-9. doi: 10.1385/MN:22:1-3:001. Mol Neurobiol. 2000. PMID: 11414273 Review. - Repulsive guidance molecule/neogenin: a novel ligand-receptor system playing multiple roles in neural development.
Matsunaga E, Chédotal A. Matsunaga E, et al. Dev Growth Differ. 2004 Dec;46(6):481-6. doi: 10.1111/j.1440-169x.2004.00768.x. Dev Growth Differ. 2004. PMID: 15610137 Review.
Cited by
- Neuritin activates insulin receptor pathway to up-regulate Kv4.2-mediated transient outward K+ current in rat cerebellar granule neurons.
Yao JJ, Gao XF, Chow CW, Zhan XQ, Hu CL, Mei YA. Yao JJ, et al. J Biol Chem. 2012 Nov 30;287(49):41534-45. doi: 10.1074/jbc.M112.390260. Epub 2012 Oct 12. J Biol Chem. 2012. PMID: 23066017 Free PMC article. - Therapy development for spinal muscular atrophy in SMN independent targets.
Tsai LK. Tsai LK. Neural Plast. 2012;2012:456478. doi: 10.1155/2012/456478. Epub 2012 May 31. Neural Plast. 2012. PMID: 22701806 Free PMC article. Review. - Insulin receptor signaling in the development of neuronal structure and function.
Chiu SL, Cline HT. Chiu SL, et al. Neural Dev. 2010 Mar 15;5:7. doi: 10.1186/1749-8104-5-7. Neural Dev. 2010. PMID: 20230616 Free PMC article. Review. - NMDA receptor-dependent pattern transfer from afferents to postsynaptic cells and dendritic differentiation in the barrel cortex.
Datwani A, Iwasato T, Itohara S, Erzurumlu RS. Datwani A, et al. Mol Cell Neurosci. 2002 Nov;21(3):477-92. doi: 10.1006/mcne.2002.1195. Mol Cell Neurosci. 2002. PMID: 12498788 Free PMC article. - Molecular mechanisms underlying neural circuit formation.
Lu B, Wang KH, Nose A. Lu B, et al. Curr Opin Neurobiol. 2009 Apr;19(2):162-7. doi: 10.1016/j.conb.2009.04.004. Epub 2009 May 18. Curr Opin Neurobiol. 2009. PMID: 19457653 Free PMC article. Review.
References
- Nedivi E, Hevroni D, Naot D, Israeli D, Citri Y. Nature. 1993;363:718. - PubMed
- Tissue samples from stage 46–48 tadpoles were homogenized as described [Zou D-J, Cline HT. Neuron. 1996;16:529.] and size-separated on 15% SDS/tris-glycine gels before electroblotting onto nitrocellulose. Blots were incubated with a 1:100 dilution of unpurified anti-CPG15 or preimmune antisera and developed by ECL (Amersham). Polyclonal antiserum to CPG15 was generated in rabbits by Pocono Rabbit Farm and Laboratory against a FLAG fusion protein (Kodak) expressed in Escherichia coli BL21 and was purified by established methods [Sambrook J, Fritsch EF, Maniatis T. Molecular Cloning: A Laboratory Manual. Cold Spring Harbor Laboratory Press; Cold Spring Harbor, NY: 1989. ].
- KA was injected into the tadpole optic ventricle (50 μM). Intraperitoneal (ip) injection of KA into rats and subsequent removal of hippocampal dentate gyri were done as described (1).
Publication types
MeSH terms
Substances
LinkOut - more resources
Full Text Sources
Other Literature Sources
Miscellaneous


