Small espin: a third actin-bundling protein and potential forked protein ortholog in brush border microvilli - PubMed (original) (raw)
Small espin: a third actin-bundling protein and potential forked protein ortholog in brush border microvilli
J R Bartles et al. J Cell Biol. 1998.
Abstract
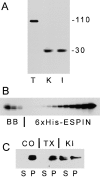
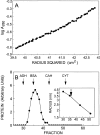
An approximately 30-kD isoform of the actin-binding/ bundling protein espin has been discovered in the brush borders of absorptive epithelial cells in rat intestine and kidney. Small espin is identical in sequence to the COOH terminus of the larger ( approximately 110-kD) espin isoform identified in the actin bundles of Sertoli cell-spermatid junctional plaques (Bartles, J.R., A. Wierda, and L. Zheng. 1996. J. Cell Sci. 109:1229-1239), but it contains two unique peptides at its NH2 terminus. Small espin was localized to the parallel actin bundles of brush border microvilli, resisted extraction with Triton X-100, and accumulated in the brush border during enterocyte differentiation/migration along the crypt-villus axis in adults. In transfected BHK fibroblasts, green fluorescent protein-small espin decorated F-actin-containing fibers and appeared to elicit their accumulation and/or bundling. Recombinant small espin bound to skeletal muscle and nonmuscle F-actin with high affinity (Kd = 150 and 50 nM) and cross-linked the filaments into bundles. Sedimentation, gel filtration, and circular dichroism analyses suggested that recombinant small espin was a monomer with an asymmetrical shape and a high percentage of alpha-helix. Deletion mutagenesis suggested that small espin contained two actin-binding sites in its COOH-terminal 116-amino acid peptide and that the NH2-terminal half of its forked homology peptide was necessary for bundling activity.
Figures
Figure 1
Detection, quantification, and extraction of small espin. (A) Western blot of homogenate of rat testis (T), kidney (K), and small intestinal mucosa (I) using espin antibody (apparent molecular mass depicted on right in units of kD). (B) Western blot quantification of small espin in isolated rat small intestinal brush borders, comparing brush border (BB) samples containing (from left to right) 40, 20, and 10 μg of actin and (from right to left) serial twofold dilutions of recombinant small espin (6xHis-ESPIN) internal standard starting with 3.2 μg in the far right lane. (C) Western blot of high-speed supernate (S) and pellet (P) resulting from the extraction of isolated rat small intestinal brush borders in solution A in the absence (CO) or presence of 1% (vol/vol) Triton X-100 (TX) or 0.6 M KI for 45 min at 4°C.
Figure 2
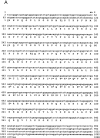
Sequence of small espin and its relationship to the large isoform. (A) The cDNA and amino acid sequence of rat small espin. The peptides unique to the small isoform (M1-P13 and S61-R86) are enclosed in brackets. The amino acids in the forked homology peptide (I140-K205) that are identical to those in the forked protein are marked with an asterisk. (B) Diagram depicting (approximately to scale) the structural relationships between the large and small isoforms of espin and some of their known motifs (Pr, proline-rich peptides; T, peptides with trichohyalin-like repeats). The peptides unique to the small isoform are shaded. These sequence data are available from GenBank/ EMBL/DDBJ under accession number AF076856.
Figure 3
Immunoperoxidase localization of small espin in rat small intestine (A) and kidney (B). Arrowheads denote the positions of intense brush border staining. The arrow in A shows an example of reduced immunolabeling on enterocyte precursors in a crypt of Lieberkühn. Bar, 100 μm.
Figure 4
Localization of small espin on isolated rat small intestinal brush borders. (A–C) Immunofluorescence localization of espin (B) compared with that of F-actin, as revealed using fluorescent phalloidin (C), and to the phase contrast image (A). Postembedment (D) and preembedment (E) immunogold localization. The rootlets lie to the left of the arc traced out by the intermicrovillar plasma membrane (arrowheads). Bars: (A) 5 μm; (D) 0.4 μm.
Figure 5
Localization of GFP–small espin in transiently transfected BHK cells. (A–C) GFP espin in living cells. (B, inset) Control with GFP alone. (D and E) Fixed and permeabilized cells examined for GFP– small espin (D) or F-actin, as revealed by rhodamine-phalloidin (E). (D, inset) Control with GFP alone. Bar, 25 μm.
Figure 6
Actin binding and bundling by recombinant small espin. (A) Coomassie blue–stained SDS gel of the pellet (P) and supernate (S) that result from low-speed centrifugation when rabbit skeletal muscle F-actin is incubated alone or in the presence of recombinant small espin (ESPIN) or the NH2-terminal deletion construct ΔN137 for 1 h at 37°C (apparent molecular mass is depicted at the right in units of kD). (B) Scatchard plot analysis for the binding of recombinant small espin to rabbit skeletal muscle (filled) or human nonmuscle (open) F-actin.
Figure 7
Negative staining electron microscopy of bundle formed by small espin and rabbit skeletal muscle F-actin when mixed at a molar ratio of approximately one espin per seven actin monomers for ∼1 h at 37°C. Bar, 36 μm.
Figure 8
Physical properties of recombinant small espin. (A) Sedimentation equilibrium: plot of log A280 versus radius squared at equilibrium (slope = 0.16, correlation coefficient = 0.993). (B) Gel filtration in Sephadex G-100 relative to standards (ADH, yeast alcohol dehydrogenase; BSA, bovine serum albumin; CAH, bovine carbonic anhydrase; CYT, horse cytochrome c). (Inset) Semilog plot of Stokes' radius versus peak elution fraction. (C) Sedimentation in sucrose density gradient relative to standards (OVA, ovalbumin standard). (Inset) Plot of sedimentation coefficient (S) versus peak fraction. (D) Circular dichroism spectrum.
Figure 9
Actin bundling activity of NH2- or COOH-terminal deletion constructs of small espin. + or − signifies the presence or absence of actin-bundling activity for the designated construct as determined by qualitative analysis of the SDS gels that resulted from the low-speed centrifugation assay (see Fig. 6_A_). The assays were conducted on at least three independent isolates of each recombinant protein at a molar ratio of approximately one espin per seven actin monomers. The numbers shown in parentheses specify the percent of the actin recovered in the low-speed pellet in a single experiment in which all seven constructs were compared and the SDS gel was analyzed by laser densitometry. These numbers have been corrected for the ∼2% of actin that was recovered in the pellet in the absence of espin construct. In the accompanying diagrams, the two NH2-terminal peptides specific to the small isoform have been shaded.
Similar articles
- Espin contains an additional actin-binding site in its N terminus and is a major actin-bundling protein of the Sertoli cell-spermatid ectoplasmic specialization junctional plaque.
Chen B, Li A, Wang D, Wang M, Zheng L, Bartles JR. Chen B, et al. Mol Biol Cell. 1999 Dec;10(12):4327-39. doi: 10.1091/mbc.10.12.4327. Mol Biol Cell. 1999. PMID: 10588661 Free PMC article. - Espin cross-links cause the elongation of microvillus-type parallel actin bundles in vivo.
Loomis PA, Zheng L, Sekerková G, Changyaleket B, Mugnaini E, Bartles JR. Loomis PA, et al. J Cell Biol. 2003 Dec 8;163(5):1045-55. doi: 10.1083/jcb.200309093. Epub 2003 Dec 1. J Cell Biol. 2003. PMID: 14657236 Free PMC article. - From the structure to the function of villin, an actin-binding protein of the brush border.
Friederich E, Pringault E, Arpin M, Louvard D. Friederich E, et al. Bioessays. 1990 Sep;12(9):403-8. doi: 10.1002/bies.950120902. Bioessays. 1990. PMID: 2256904 Review. - Espins and the actin cytoskeleton of hair cell stereocilia and sensory cell microvilli.
Sekerková G, Zheng L, Loomis PA, Mugnaini E, Bartles JR. Sekerková G, et al. Cell Mol Life Sci. 2006 Oct;63(19-20):2329-41. doi: 10.1007/s00018-006-6148-x. Cell Mol Life Sci. 2006. PMID: 16909209 Free PMC article. Review.
Cited by
- A two-photon FRAP analysis of the cytoskeleton dynamics in the microvilli of intestinal cells.
Waharte F, Brown CM, Coscoy S, Coudrier E, Amblard F. Waharte F, et al. Biophys J. 2005 Feb;88(2):1467-78. doi: 10.1529/biophysj.104.049619. Epub 2004 Dec 13. Biophys J. 2005. PMID: 15596489 Free PMC article. - Impact of cordon-bleu expression on actin cytoskeleton architecture and dynamics.
Grega-Larson NE, Crawley SW, Tyska MJ. Grega-Larson NE, et al. Cytoskeleton (Hoboken). 2016 Nov;73(11):670-679. doi: 10.1002/cm.21317. Epub 2016 Aug 22. Cytoskeleton (Hoboken). 2016. PMID: 27464680 Free PMC article. - Building the brush border, one microvillus at a time.
Morales EA, Gaeta I, Tyska MJ. Morales EA, et al. Curr Opin Cell Biol. 2023 Feb;80:102153. doi: 10.1016/j.ceb.2023.102153. Epub 2023 Feb 22. Curr Opin Cell Biol. 2023. PMID: 36827850 Free PMC article. Review. - Age-dependent maintenance of motor control and corticostriatal innervation by death receptor 3.
Twohig JP, Roberts MI, Gavalda N, Rees-Taylor EL, Giralt A, Adams D, Brooks SP, Bull MJ, Calder CJ, Cuff S, Yong AA, Alberch J, Davies A, Dunnett SB, Tolkovsky AM, Wang EC. Twohig JP, et al. J Neurosci. 2010 Mar 10;30(10):3782-92. doi: 10.1523/JNEUROSCI.1928-09.2010. J Neurosci. 2010. PMID: 20220013 Free PMC article. - Building and repairing the stereocilia cytoskeleton in mammalian auditory hair cells.
Vélez-Ortega AC, Frolenkov GI. Vélez-Ortega AC, et al. Hear Res. 2019 May;376:47-57. doi: 10.1016/j.heares.2018.12.012. Epub 2019 Jan 2. Hear Res. 2019. PMID: 30638948 Free PMC article. Review.
References
- Alicea HA, Mooseker MS. Characterization of villin from the intestinal brush border of the rat, and comparative analysis with avian villin. Cell Motil Cytoskel. 1988;9:60–72. - PubMed
- Altschul SF, Gish W, Miller W, Myers EW, Lipman DJ. Basic local alignment search tool. J Mol Biol. 1990;215:403–410. - PubMed
- Bartles JR, Wierda A, Zheng L. Identification and characterization of espin, an actin-binding protein localized to the F-actin-rich junctional plaques of Sertoli cell ectoplasmic specializations. J Cell Sci. 1996;109:1229–1239. - PubMed
Publication types
MeSH terms
Substances
LinkOut - more resources
Full Text Sources
Molecular Biology Databases


