Crystal structure of the BTB domain from PLZF - PubMed (original) (raw)
Crystal structure of the BTB domain from PLZF
K F Ahmad et al. Proc Natl Acad Sci U S A. 1998.
Abstract
The BTB domain (also known as the POZ domain) is an evolutionarily conserved protein-protein interaction motif found at the N terminus of 5-10% of C2H2-type zinc-finger transcription factors, as well as in some actin-associated proteins bearing the kelch motif. Many BTB proteins are transcriptional regulators that mediate gene expression through the control of chromatin conformation. In the human promyelocytic leukemia zinc finger (PLZF) protein, the BTB domain has transcriptional repression activity, directs the protein to a nuclear punctate pattern, and interacts with components of the histone deacetylase complex. The association of the PLZF BTB domain with the histone deacetylase complex provides a mechanism of linking the transcription factor with enzymatic activities that regulate chromatin conformation. The crystal structure of the BTB domain of PLZF was determined at 1.9 A resolution and reveals a tightly intertwined dimer with an extensive hydrophobic interface. Approximately one-quarter of the monomer surface area is involved in the dimer intermolecular contact. These features are typical of obligate homodimers, and we expect the full-length PLZF protein to exist as a branched transcription factor with two C-terminal DNA-binding regions. A surface-exposed groove lined with conserved amino acids is formed at the dimer interface, suggestive of a peptide-binding site. This groove may represent the site of interaction of the PLZF BTB domain with nuclear corepressors or other nuclear proteins.
Figures
Figure 1
Sequence alignment of selected BTB domains and the observed secondary structure of the PLZF BTB domain. TTK (Tramtrack) and GAGA factor are Drosophila proteins, and the others are human proteins. The numbering is according to PLZF, and the crystal structure consists of residues 6–126. Black and gray backgrounds are used to indicate identical and/or conserved residues found in at least 50% of the proteins at a given position. Residues in a 310 helix conformation are indicated by hatching. • indicates amino acids that are classified as buried in the PLZF BTB monomer according to the criteria of Rice and Eisenberg (23). Colored numbers represent the percentage of contribution of the residue to the buried interface surface in the dimer, rounded to the nearest integer (i.e., a value of “0” represents a contribution from 0.1 to 0.49%, values of 1 represent a contribution of 0.5–1.49%, etc.). Residues indicated with red numbers participate in the swapped or closed interface, and amino acids involved with the central open interface are labeled in blue. Residues 16–19 contribute to both and are not classified.
Figure 2
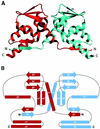
(A) Ribbon diagram of the PLZF BTB domain dimer. One monomer is colored red and the other blue. The secondary structure elements of one monomer are indicated, and the position of the conserved residue Asp-35 is labeled. In this view, the two halves of the dimer are related by a vertical twofold symmetry axis. This figure was generated with the graphical program
setor
(24). (B) Schematic representation of the topology of the dimer. α-Helices are indicated by rectangles, and β-sheets by thick arrows. The symmetry related secondary structure elements are indicated with primes.
Figure 3
View of one monomer displayed as a solvent accessible surface in
grasp
(26). The orientation is roughly the same as for the blue monomer in Fig. 2_A_. The surface buried upon dimer formation is indicated in magenta, and residues that contribute at least 2% of the buried surface of the dimer (Fig. 1) are labeled. Residues from the closed interface are indicated with arrows. Not shown in the diagram are the residues from β5 and α6, which form a groove on the underside of the monomer that accommodates β1′ from the adjoining monomer. The entrance to this groove is lined with Ala-90 and Tyr-113.
Figure 4
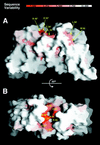
Sequence conservation in the exposed surface of the BTB dimer. (A) View in the same orientation as in Fig. 2_A_. (B) View looking directly down the twofold axis of the dimer. A multiple sequence alignment was constructed as follows: residues 6–126 of PLZF were used in a
fasta
3 (38) search of the
swall
database (Nonredundant Protein sequence database including Swissprot, Trembl, and TremblNew) at the EMBL- European Bioinformatics Institute server (
). Entries with E score <0.1 were used for further processing. Identical and closely matching sequences were removed from the set, so that the no two pairs in the final set of 42 sequences had >88% sequence identity. The set was then aligned, and the sequence variability was calculated as the number of different amino acids present at each residue position. The sequence variability was then displayed on the solvent accessible surface of the dimer by using
grasp
(26). In this variability scoring scheme, a fully conserved residue is assigned a value of 1, and the maximum variability is 20. The only exposed, fully conserved residue in the structure is Asp-35, present in the center of the groove.
Similar articles
- In-depth mutational analysis of the promyelocytic leukemia zinc finger BTB/POZ domain reveals motifs and residues required for biological and transcriptional functions.
Melnick A, Ahmad KF, Arai S, Polinger A, Ball H, Borden KL, Carlile GW, Prive GG, Licht JD. Melnick A, et al. Mol Cell Biol. 2000 Sep;20(17):6550-67. doi: 10.1128/MCB.20.17.6550-6567.2000. Mol Cell Biol. 2000. PMID: 10938130 Free PMC article. - Overexpression, purification, characterization, and crystallization of the BTB/POZ domain from the PLZF oncoprotein.
Li X, Lopez-Guisa JM, Ninan N, Weiner EJ, Rauscher FJ 3rd, Marmorstein R. Li X, et al. J Biol Chem. 1997 Oct 24;272(43):27324-9. doi: 10.1074/jbc.272.43.27324. J Biol Chem. 1997. PMID: 9341182 - Critical residues within the BTB domain of PLZF and Bcl-6 modulate interaction with corepressors.
Melnick A, Carlile G, Ahmad KF, Kiang CL, Corcoran C, Bardwell V, Prive GG, Licht JD. Melnick A, et al. Mol Cell Biol. 2002 Mar;22(6):1804-18. doi: 10.1128/MCB.22.6.1804-1818.2002. Mol Cell Biol. 2002. PMID: 11865059 Free PMC article. - Structure-function studies of the BTB/POZ transcriptional repression domain from the promyelocytic leukemia zinc finger oncoprotein.
Li X, Peng H, Schultz DC, Lopez-Guisa JM, Rauscher FJ 3rd, Marmorstein R. Li X, et al. Cancer Res. 1999 Oct 15;59(20):5275-82. Cancer Res. 1999. PMID: 10537309 - The PLZF gene of t (11;17)-associated APL.
McConnell MJ, Licht JD. McConnell MJ, et al. Curr Top Microbiol Immunol. 2007;313:31-48. doi: 10.1007/978-3-540-34594-7_3. Curr Top Microbiol Immunol. 2007. PMID: 17217037 Review.
Cited by
- Genome-Wide Identification and Expression Analysis of the BTB Gene Superfamily Provides Insight into Sex Determination and Early Gonadal Development of Alligator sinensis.
Li P, Liu P, Zang D, Li C, Wang C, Zhu Y, Liu M, Lu L, Wu X, Nie H. Li P, et al. Int J Mol Sci. 2024 Oct 7;25(19):10771. doi: 10.3390/ijms251910771. Int J Mol Sci. 2024. PMID: 39409099 Free PMC article. - The Arthropoda-specific Tramtrack group BTB protein domains use previously unknown interface to form hexamers.
Bonchuk AN, Balagurov KI, Baradaran R, Boyko KM, Sluchanko NN, Khrustaleva AM, Burtseva AD, Arkova OV, Khalisova KK, Popov VO, Naschberger A, Georgiev PG. Bonchuk AN, et al. Elife. 2024 Sep 2;13:e96832. doi: 10.7554/eLife.96832. Elife. 2024. PMID: 39221775 Free PMC article. - Genome-wide identification, structural and gene expression analysis of BTB gene family in soybean.
Elsanosi HA, Zhang J, Mostafa S, Geng X, Zhou G, Awdelseid AHM, Song L. Elsanosi HA, et al. BMC Plant Biol. 2024 Jul 11;24(1):663. doi: 10.1186/s12870-024-05365-1. BMC Plant Biol. 2024. PMID: 38992596 Free PMC article. - Critical domains for NACC2-NTRK2 fusion protein activation.
Yang W, Meyer AN, Jiang Z, Jiang X, Donoghue DJ. Yang W, et al. PLoS One. 2024 Jun 27;19(6):e0301730. doi: 10.1371/journal.pone.0301730. eCollection 2024. PLoS One. 2024. PMID: 38935636 Free PMC article. - ARMC5 controls the degradation of most Pol II subunits, and ARMC5 mutation increases neural tube defect risks in mice and humans.
Luo H, Lao L, Au KS, Northrup H, He X, Forget D, Gauthier MS, Coulombe B, Bourdeau I, Shi W, Gagliardi L, Fragoso MCBV, Peng J, Wu J. Luo H, et al. Genome Biol. 2024 Jan 15;25(1):19. doi: 10.1186/s13059-023-03147-w. Genome Biol. 2024. PMID: 38225631 Free PMC article.
References
- Godt D, Couderc J L, Cramton SE, Laski F A. Development (Cambridge, UK) 1993;119:799–812. - PubMed
- Bardwell V J, Treisman R. Genes Dev. 1994;8:1664–1677. - PubMed
- Albagli O, Dhordain P, Deweindt C, Lecocq G, Leprince D. Cell Growth Differ. 1995;6:1193–1198. - PubMed
- Koonin E V, Senkevich T G, Cherenos V I. Trends Biochem Sci. 1992;17:213–214. - PubMed
Publication types
MeSH terms
Substances
LinkOut - more resources
Full Text Sources
Other Literature Sources
Molecular Biology Databases


