Properties and functions of calcium-activated K+ channels in small neurones of rat dorsal root ganglion studied in a thin slice preparation - PubMed (original) (raw)
Properties and functions of calcium-activated K+ channels in small neurones of rat dorsal root ganglion studied in a thin slice preparation
A Scholz et al. J Physiol. 1998.
Abstract
1. Properties, kinetics and functions of large conductance calcium-activated K+ channels (BKCa) were investigated by the patch-clamp technique in small neurones (Adelta- and C-type) of a dorsal root ganglion (DRG) thin slice preparation without enzymatic treatment. 2. Unitary conductance of BKCa channels measured in symmetrical high K+ solutions (155 mM) was 200 pS for inward currents, and chord conductance in control solution was 72 pS. Potentials of half-maximum activation (V ) of the channels were linearly shifted by 43 mV per log10 [Ca2+]i unit (pCa) in the range of -28 mV (pCa 4) to +100 mV (pCa 7). Open probabilities increased e-times per 15-32 mV depolarization of potential. 3. In mean open probability, fast changes with time were mainly observed at pCa > 6 and at potentials > +20 mV, without obvious changes in the experimental conditions. 4. BKCa channels were half-maximally blocked by 0.4 mM TEA, measured by apparent amplitude reductions. They were completely blocked by 100 nM charybdotoxin and 50 nM iberiotoxin by reduction of open probability. 5. Two subtypes of small DRG neurones could be distinguished by the presence (type I) or absence (type II) of BKCa channels. In addition, less than 10 % of small neurones showed fast (approximately 135 V s-1) and short ( approximately 0.8 ms) action potentials (AP). 6. The main functions of BKCa channels were found to be shortening of AP duration, increasing of the speed of repolarization and contribution to the fast after-hyperpolarization. As a consequence, BKCa channels may reduce the amount of calcium entering a neurone during an AP. 7. BKCa channel currents suppressed a subsequent AP and prolonged the refractory period, which might lead to a reduced repetitive activity. We suggest that the BKCa current is a possible mechanism of the reported conduction failure during repetitive stimulation in DRG neurones.
Figures
Figure 1. Single-channel recordings and conductance of BKCa channels of small DRG neurones
A, recordings of a single BKCa channel in an outside-out patch in control solution, and from the same channel in symmetrical high-K+ solutions at the potentials given. Dotted lines indicate the closed level; filter frequency, 1 kHz; pipette solution, high-Ki+, pCa 6; 23 °C. B, I–V relationship of single BKCa channels in inside-out and outside-out patches. Most amplitudes were measured from point-amplitude histograms at potentials V. A few amplitudes were measured directly from original recordings displayed on a computer screen using two cursors. ○, control solution; •, symmetrical high-K+ solutions. In control solution the chord conductance was 71.8 ± 3.0 pS, the mean slope conductance measured below −10 mV was 53.8 ± 5.3 pS and above +10 mV it was 106.9 ± 9.1 pS (4–19 measurements). In symmetrical high-K+ solutions, the mean conductance was 198.9 ± 1.5 pS for inward currents (n = 4–16), and for outward currents it was 222.7 ± 4.4 pS (n = 4–13). Error bars smaller than symbol size were not plotted.
Figure 2. Open probability is dependent on [Ca2+]i
A, traces of a single BKCa channel at +40 mV at different calcium concentrations at the cytoplasmic membrane side recorded from an inside-out patch in the small side chamber. Dotted lines indicate closed level, filter frequency 1 kHz, symmetrical high-K+ solutions. B, voltage dependence of mean _P_open values obtained at different calcium concentrations. Relative values were calculated with a half-amplitude threshold criterion from recordings of 10 s duration. Data points were fitted with a Boltzmann distribution (eqn (1)) giving the voltages for half-maximum activation (_V_1/2) of −28.4 ± 3.0 mV at pCa 4 (□, n = 6–56), +17.0 ± 7.1 mV at pCa 5 (○, n = 6–30), +56.0 ± 8.4 mV at pCa 6 (▵, n = 6–31) and +100.3 ± 1.4 mV at pCa 7 (▿, n = 8–18). Filter frequency, 2 kHz. C, _V_1/2 values as obtained in B fitted with a linear correlation of 42.8 ± 2.3 mV per log10[Ca2+]i. D, mean _P_open_versus_[Ca2+]i at four potentials. E, example of fast mean _P_open changes in a single BKCa channel at +80 mV in high-Ki+ pCa 6 in an inside-out patch. _P_open values are plotted for two consecutive seconds of channel activity. Without obvious changes of experimental conditions, _P_open changed spontaneously between high and low values. Symmetrical high-K+ solutions, filter frequency 2 kHz.
Figure 3. Activation kinetics of a single BKCa channel
A, traces from a cell-attached patch with channel openings elicited by 120 mV depolarizing voltage jumps from resting potential _V_rest. Fifty-four episodes are averaged and shown as the lowermost trace; note the different scale bars of amplitude. Pipette filled with high-Ki+, filter frequency 1 kHz. B, same patch in inside-out configuration at two concentrations of internal Ca2+. Recordings of the single BKCa channel activated by test impulses to +40 mV from a holding potential of −80 mV. Average traces fitted with a mono-exponential function (dotted line). Symmetrical high-K+ solutions, current traces corrected for transients and leakage, filter frequency 3 kHz.
Figure 4. Single BKCa channel blockade by TEA
A, recording from an outside-out patch in control solution at 0 mV containing one channel. The corresponding point amplitude histogram is plotted below the recording. N, number of events. B, same patch in the presence of 0.5 mm TEA. The histogram showed an apparent reduction of amplitude by 53 %. The effects of all TEA concentrations tested were reversible. Pipette solution, high-Ki+, pCa 4; bath solution, control-Hepes; filter frequency, 2 kHz. C, data from measurements at 0 mV obtained as shown in B at different TEA concentrations. Fit of the data points by eqn (2) revealed a half-maximum inhibitory concentration (IC50) of 0.40 ± 0.04 mm, with a Hill factor of 0.98 ± 0.09 (n = 5–30).
Figure 5. Charybdotoxin and iberiotoxin blocked single BKCa channels
A, 100 nmol l−1 charybdotoxin (CTX; horizontal arrow) blocked three channels in an outside-out patch by reducing the open probability (second trace from left; 0 mV). Point-amplitude histograms are obtained as in Fig. 4. Amplitudes of the first current level in control, CTX and washout were 4.9, 5.1 and 5.1 pA, revealed by Gaussian fits to the histograms. Complete suppression was reached in ∼1.5 min, shown in the third trace from the left. Complete recovery was achieved after 10 min. Pipette solution, high-Ki+, pCa 6; bath solution, control-Hepes with 0.05 % BSA; filter frequency, 1 kHz. B, in another outside-out patch 50 nmol l−1 iberiotoxin (IbTX) blocked two channels completely and reversibly (0 mV). Amplitudes of the first current level in control, IbTX and washout were 4.8, 4.8 and 4.9 pA. Complete recovery was achieved after 20 min. Pipette solution, high-Ki+, pCa 4; bath solution, control-Hepes with 0.05 % BSA; filter frequency, 1 kHz. Dotted lines and numbers indicate the channel levels.
Figure 6. Two types of small DRG neurone
A, single traces of whole-cell recordings in control solution (2.2 mm Ca2+; •) and in calcium-free control solution (○), where calcium ions were replaced by Mg2+ ions to give a final concentration of 5 mm, are shown superimposed. The difference between currents in 2.2 mm Ca2+ and calcium-free solution is plotted in the middle (Δ). Neurones showing an outward difference current are classified as type I. The I–V relationship of steady-state currents measured at the end of a test impulse (180 ms) is displayed on the right (washout: ▪; difference current: ▵). Pipette solution, high-Ki+, pCa 6; filter frequency, 2 kHz. B, another small DRG neurone showed an inward current (Δ) after analogous subtraction. Such neurones displaying an inward difference current are classified as type II. Pipette solution, high-Ki+, pCa 6; filter frequency, 2 kHz.
Figure 7. Action potentials of two types of small DRG neurone
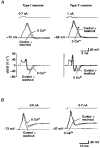
A, action potentials of a type I neurone evoked by short current injections (left, 3 ms) were prolonged reversibly by 0.6 ms (measured at half-amplitude) in calcium-free control solution (0 Ca2+) compared with action potentials in control solution (2.2 mm Ca2+). Action potentials of a type II neurone (right; stimulus duration, 2 ms) were shortened reversibly by 0.45 ms and their typical hump during repolarization (asterisk) disappeared. In the first derivative of the recordings (d_V_/d_t_) the maximum velocity of repolarization in the type I neurone was reduced from 45 to 35 V s−1 in calcium-free solution, whereas in the type II neurone it remained unchanged. B, same neurones as in A stimulated by long current injections (80 ms). Amplitude of fast after-hyperpolarization (AHP) of the type I neurone was reversibly reduced by 10 mV in calcium-free solution, whereas in the type II neurone it remained unchanged. All traces (control, 0 Ca2+, washout) are superimposed. Pipette solution, high-Ki+, 0 Ca2+; filter frequency, 3 kHz; sample frequency, 20 kHz.
Figure 9. Slow and fast APs of small DRG neurones
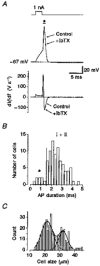
A, small DRG neurone displaying a fast AP with a duration shorter than 1 ms (measured at 0 mV) and high maximum velocity of depolarization (210 V s−1) and repolarization (125 V s−1). IbTX (50 nmol l−1) did not affect the shape of the AP in this neurone, as shown superimposed. Pipette solution, high-Ki+, 0 Ca2+; bath solution, control-Hepes, 0.05 % BSA. B, in the histogram of AP durations, fast type neurones (marked by an asterisk) displayed a mean AP duration of 0.81 ± 0.11 ms (n = 7). Mean AP duration of type I and II neurones (all data right of the dashed line) was longer, at 2.56 ± 0.08 ms (n = 79). C, frequency distribution of soma diameter for fixed neurones (n = 298) in 5 μ
m
sections from DRG of three different rats (6 days old). The peaks of a double Gaussian fit were at 21.5 and 32.2 μm.
Figure 8. CTX and IbTX affect action potentials and whole-cell currents
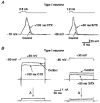
A, in a type I neurone 100 nmol l−1 CTX prolonged the AP duration by 0.3 ms (measured at half-amplitude; left). In another type I neurone 50 nmol l−1 IbTX prolonged the AP duration by 0.5 ms (right). Pipette solution, high-Ki+, 0 Ca2+; bath solution, control-Hepes, 0.05 % BSA. Stimulus duration, 3.5 ms (left) and 2.5 ms (right). B, in another type I neurone 100 nmol l−1 CTX (left) reduced the total outward current by 1.44 nA (17 %; measured at 180 ms). Whole-cell current recordings were made at +30 mV; holding potential, −80 mV. In another type I neurone 50 nmol l−1 IbTX reduced the total outward current by 1.1 nA (34 %; measured at 180 ms; right). The difference currents are shown as the lowermost traces (Δ). Currents are corrected for leakage and transients. Filter frequency, 3 kHz; pipette solution, high-Ki+, 0 Ca2+; bath solution, control-Hepes, 0.05 % BSA.
Figure 10. BKCa channels, source of calcium, refractory period and repetitive activity
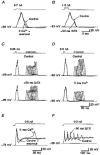
A, in the presence of internal 10 mm BAPTA, a fast Ca2+ chelator, AP duration (measured at half-amplitude) was shortened reversibly by 0.35 ms in calcium-free control solution (stimulus duration, 2.75 ms). Pipette solution, high-Ki+, BAPTA. B, in another neurone AP duration was not prolonged by 50 nmol l−1 IbTX. Pipette solution, high-Ki+, BAPTA; bath solution, control-Hepes, 0.05 % BSA; filter frequency, 3 kHz. C, in a type I neurone a second AP could not be evoked until 42.5 ms after the first impulse (upper trace) in control conditions (control-Hepes, 0.05 % BSA with 2.2 mm Ca2+). In the presence of 50 nmol l−1 IbTX, a second AP could be activated 30 ms after the first impulse (lower trace). Stimulus duration, 2.25 ms; 0.95 nA; pipette solution, high-Ki+, 0 Ca2+; filter frequency, 5 kHz; 24 °C. D, in a type II neurone in control conditions (control with 2.2 mm Ca2+), the second AP could be elicited 32 ms after the first impulse (upper trace), whereas in calcium-free control solution over 42 ms no further AP could be elicited (lower trace). Pipette solution, high-Ki+, 0 Ca2+; filter frequency, 10 kHz; 24 °C. E, during a long current injection into a type I neurone, a second AP was seen only in calcium-free control solution, which was reversible. Pipette solution, high-Ki+, 0 Ca2+; bath solution, control; filter frequency, 3 kHz. F, in another type I neurone, higher repetitive firing (6 APs) could be elicited in the presence of 50 nmol l−1 IbTX in contrast to control conditions (two APs in control-Hepes with 2.2 mm Ca2+). Pipette solution, high-Ki+, 0 Ca2+; 24 °C; filter frequency, 3 kHz.
Similar articles
- Single voltage-gated K+ channels and their functions in small dorsal root ganglion neurones of rat.
Safronov BV, Bischoff U, Vogel W. Safronov BV, et al. J Physiol. 1996 Jun 1;493 ( Pt 2)(Pt 2):393-408. doi: 10.1113/jphysiol.1996.sp021391. J Physiol. 1996. PMID: 8782104 Free PMC article. - Voltage-gated potassium channels activated during action potentials in layer V neocortical pyramidal neurons.
Kang J, Huguenard JR, Prince DA. Kang J, et al. J Neurophysiol. 2000 Jan;83(1):70-80. doi: 10.1152/jn.2000.83.1.70. J Neurophysiol. 2000. PMID: 10634854 - Electrophysiological properties of neurons in intact rat dorsal root ganglia classified by conduction velocity and action potential duration.
Villière V, McLachlan EM. Villière V, et al. J Neurophysiol. 1996 Sep;76(3):1924-41. doi: 10.1152/jn.1996.76.3.1924. J Neurophysiol. 1996. PMID: 8890304 - Ca(2+)-activated K+ currents in neurones: types, physiological roles and modulation.
Sah P. Sah P. Trends Neurosci. 1996 Apr;19(4):150-4. doi: 10.1016/s0166-2236(96)80026-9. Trends Neurosci. 1996. PMID: 8658599 Review. - Ca-activated potassium current in vertebrate sympathetic neurons.
Brown DA, Constanti A, Adams PR. Brown DA, et al. Cell Calcium. 1983 Dec;4(5-6):407-20. doi: 10.1016/0143-4160(83)90017-9. Cell Calcium. 1983. PMID: 6323003 Review.
Cited by
- GDNF induces mechanical hyperalgesia in muscle by reducing I(BK) in isolectin B4-positive nociceptors.
Hendrich J, Alvarez P, Chen X, Levine JD. Hendrich J, et al. Neuroscience. 2012 Sep 6;219:204-13. doi: 10.1016/j.neuroscience.2012.06.011. Epub 2012 Jun 13. Neuroscience. 2012. PMID: 22704965 Free PMC article. - Pathological pain processing in mouse models of multiple sclerosis and spinal cord injury: contribution of plasma membrane calcium ATPase 2 (PMCA2).
Mirabelli E, Ni L, Li L, Acioglu C, Heary RF, Elkabes S. Mirabelli E, et al. J Neuroinflammation. 2019 Nov 8;16(1):207. doi: 10.1186/s12974-019-1585-2. J Neuroinflammation. 2019. PMID: 31703709 Free PMC article. - Oxidative stress and the muscle reflex in heart failure.
Koba S, Gao Z, Sinoway LI. Koba S, et al. J Physiol. 2009 Nov 1;587(Pt 21):5227-37. doi: 10.1113/jphysiol.2009.177071. Epub 2009 Sep 1. J Physiol. 2009. PMID: 19723775 Free PMC article. - Modulation of Kv3.4 channel N-type inactivation by protein kinase C shapes the action potential in dorsal root ganglion neurons.
Ritter DM, Ho C, O'Leary ME, Covarrubias M. Ritter DM, et al. J Physiol. 2012 Jan 1;590(1):145-61. doi: 10.1113/jphysiol.2011.218560. Epub 2011 Nov 7. J Physiol. 2012. PMID: 22063632 Free PMC article. - Hypotonicity modulates tetrodotoxin-sensitive sodium current in trigeminal ganglion neurons.
Li L, Liu C, Chen L, Chen L. Li L, et al. Mol Pain. 2011 Apr 16;7:27. doi: 10.1186/1744-8069-7-27. Mol Pain. 2011. PMID: 21496300 Free PMC article.
References
- Black JA, Dibhajj S, McNabola K, Jeste S, Rizzo MA, Kocsis JD, Waxman SG. Spinal sensory neurons express multiple sodium channel alpha-subunit mRNAs. Molecular Brain Research. 1996;43:117–131. - PubMed
- Butler A, Tsunoda S, McCobb DP, Wei A, Salkoff L. mSlo, a complex mouse gene encoding ‘maxi’ calcium-activated potassium channels. Science. 1993;261:221–224. - PubMed
MeSH terms
Substances
LinkOut - more resources
Full Text Sources
Research Materials
Miscellaneous


