Insulin resistance and diabetes mellitus in transgenic mice expressing nuclear SREBP-1c in adipose tissue: model for congenital generalized lipodystrophy - PubMed (original) (raw)
Comparative Study
Insulin resistance and diabetes mellitus in transgenic mice expressing nuclear SREBP-1c in adipose tissue: model for congenital generalized lipodystrophy
I Shimomura et al. Genes Dev. 1998.
Abstract
Overexpression of the nuclear form of sterol regulatory element-binding protein-1c (nSREBP-1c/ADD1) in cultured 3T3-L1 preadipocytes was shown previously to promote adipocyte differentiation. Here, we produced transgenic mice that overexpress nSREBP-1c in adipose tissue under the control of the adipocyte-specific aP2 enhancer/promoter. A syndrome with the following features was observed: (1) Disordered differentiation of adipose tissue. White fat failed to differentiate fully, and the size of white fat depots was markedly decreased. Brown fat was hypertrophic and contained fat-laden cells resembling immature white fat. Levels of mRNA encoding adipocyte differentiation markers (C/EBPalpha, PPARgamma, adipsin, leptin, UCP1) were reduced, but levels of Pref-1 and TNFalpha were increased. (2) Marked insulin resistance with 60-fold elevation in plasma insulin. (3) Diabetes mellitus with elevated blood glucose (>300 mg/dl) that failed to decline when insulin was injected. (4) Fatty liver from birth and elevated plasma triglyceride levels later in life. These mice exhibit many of the features of congenital generalized lipodystrophy (CGL), an autosomal recessive disorder in humans.
Figures
Figure 1
Photograph of 7-day-old wild-type male mouse (left) and a transgenic aP2–SREBP-1c436 (line A) male littermate mouse (right). (A) Dorsal view of the mice, illustrating the enlargement of the interscapular brown fat pads in the transgenic mouse. (B) Exposed dorsal view of the interscapular brown fat pads. (C) Exposed ventral view of the mice, illustrating the enlarged fatty liver in the transgenic mouse.
Figure 2
Liver, interscapular brown fat, epididymal white fat/testis from a 3-month-old wild-type male mouse (left) and a transgenic aP2–SREBP-1c436 (line A) male littermate mouse (right). The wild-type and transgenic livers weighed 1.5 and 3.9 grams, respectively. The wild-type and transgenic interscapular fat weighed 58 and 110 mg, respectively. The wild-type and transgenic epididymal fat weighed 510 and 160 mg, respectively.
Figure 3
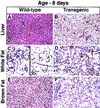
Histologic sections of liver (A,B), white fat (C,D), and brown fat (E,F) from an 8-day-old wild-type male mouse and a transgenic aP2–SREBP-1c436 male littermate mouse (hematoxylin and eosin stain; magnification, 112 ×). (A,B) Hepatocytes throughout the liver of the transgenic mouse are dramatically swollen. The cytoplasm stains palely eosinophilic and contains numerous microvesicular vacuoles. The alteration is uniform throughout the lobules. Scattered hematopoietic foci are present in both the wild-type and transgenic liver. (C) White fat pad of a wild-type mouse contains a heterogeneous population of cells consisting of both small immature adipocytes (left) and mature adipocytes, each of which contains a large unilocular vacuole (right). (D) White fat of the transgenic mouse contains numerous, small immature adipocytes with brightly eosinophilic cytoplasm and a distinct unilocular vacuole. (E,F) Adipocytes of the brown fat of the transgenic mouse are dramatically enlarged and stain palely. The cytoplasm is replaced by numerous small vacuoles that frequently coalesce to form large unilocular vacuoles, resembling those of immature white adipocytes.
Figure 4
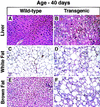
Histologic sections of liver (A,B), white fat (C,D), and brown fat (E,F) from a 6-week-old wild-type mouse and a transgenic aP2–SREBP-1c436 littermate (hematoxylin and eosin stain; magnification, 112 ×). (A,B) Hepatocytes of the transgenic mouse are swollen and contain microvesicular vacuoles. (C,D) Adipocytes in white fat of the transgenic mouse show marked heterogeneity of size. Admixed with the mature adipocytes are smaller, immature adipocytes with bright eosinophilic cytoplasm, a round nucleus, and a distinct unilocular vacuole. This is in contrast to the WAT from a wild-type mouse, which consists of adipocytes of uniform size filled with a large, unilocular vacuole. (E,F) Interscapular brown fat of the transgenic mouse consists of markedly enlarged adipocytes containing large unilocular fat droplets. The interstitium shows signs of mild chronic inflammation.
Figure 5
Amounts of various mRNAs in liver, white fat (WF), and brown fat (BF) of wild-type mice (WT) and transgenic aP2-SREBP-1c436 (line A) mice (Tg) as measured by blot hybridization. The radioactivity in each band was quantified as described in Materials and Methods. The fold change in each mRNA of transgenic mice relative to that of wild-type mice was calculated after correction for loading differences by measuring the amount of 18S rRNA. (A) Total RNA was isolated from two of the seven wild-type and two of the seven transgenic mice (line A) described in Table 1. The RNA was pooled, and 10-μg aliquots were subjected to electrophoresis and blot hybridization with the indicated 32P-labeled probe. The probe for stearoyl CoA desaturase (SCD) was a mouse SCD1 cDNA fragment that can detect both SCD1 and SCD2 mRNAs (Shimomura et al. 1998). (B) Total RNA was isolated from the remaining five wild-type and five littermate transgenic mice (line A) described in Table 1. The RNA was pooled, and 10-μg aliquots were subjected to electrophoresis and blot hybridization with the indicated 32P-labeled probe.
Figure 6
Changes in amounts of mRNA for Pref-1 (A) and TNFα (B) in wild-type mice and transgenic aP2–SREBP-1c436 (line A) mice as measured by Rnase protection assay. Aliquots of total RNA (20 μg) from pooled samples (see below) isolated from the indicated genotype were hybridized in solution for 10 min at 68°C to the 32P-labeled cRNA probes for Pref-1 and TNFα, all in the presence of a cRNA probe for β-actin as described in Materials and Methods. After RNase digestion, the protected fragments were separated by gel electrophoresis and exposed to film for 16 hr at −80°C. The radioactivity in the gels was quantified, normalized to the β-actin signal, and expressed as the fold change relative to the mRNA level of wild-type mice. (A) Total RNA was isolated from the white fat (WF) and brown fat (BF) of five wild-type (WT) mice and five littermate transgenic (Tg) mice (line A) described in Fig. 5B. (B) Total RNA was isolated from the gastrocnemius muscle and spleen of three of the seven wild-type and four of the seven littermate transgenic mice (line A) described in Table 1. The total RNA from white fat and brown fat was obtained from an aliquot of the same sample in A. Total RNA of liver was isolated from two wild-type and two littermate transgenic mice (line A) described in Fig. 5A.
Figure 7
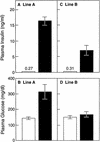
Plasma concentrations of insulin (A,C) and glucose (B,D) in wild-type (open bars) and two lines of transgenic aP2–SREBP-1c436 (solid bars) mice. Blood was drawn in the early-to-middle phase of the light cycle in the nonfasted state. Each value represents the mean ±
s.e.m.
of seven mice (A,B) or four mice (C,D).
Figure 8
Insulin tolerance tests in wild-type (○) and transgenic aP2-SREBP-1c436 (•) mice. Ad-libitum fed animals were injected intraperitoneally with human crystalline insulin in the middle of the light cycle as described in Materials and Methods, and blood was taken at the indicated time for measurement of glucose content. Results are expressed as percent of the plasma glucose concentration at zero time and are plotted as mean ±
s.e.m.
of the indicated number of animals. The zero-time plasma glucose levels were as follows: Exp. 1, 164 ± 23 and 310 ± 38 mg/dl in wild-type and transgenic mice, respectively; Exp. 2, 163 ± 11 and 412 ± 72; Exp. 3, 183 ± 7 and 279 ± 91.
Figure 9
Uptake of [3H]2-deoxyglucose by isolated soleus muscle in wild-type and transgenic aP2–SREBP-1c436 mice. Soleus muscles from 12-week-old female mice (line A) were first incubated for 30 min with (solid bars) or without (open bars) the indicated concentration of insulin, followed by a 15-min incubation with [3H]2-deoxyglucose as described in Materials and Methods. Each value denotes the mean ±
s.e.m.
of the indicated number of animals. Plasma glucose and insulin were measured in the mice used in B. Plasma glucose levels (mean ±
s.e.m.
) were 170 ± 12 and 334 ± 32 mg/dl for wild-type and transgenic mice, respectively. Plasma insulin levels were 0.07 ± 0.02 and 3.2 ± 0.7 n
m
for wild-type and transgenic mice, respectively.
Similar articles
- Overexpression of sterol regulatory element-binding protein-1a in mouse adipose tissue produces adipocyte hypertrophy, increased fatty acid secretion, and fatty liver.
Horton JD, Shimomura I, Ikemoto S, Bashmakov Y, Hammer RE. Horton JD, et al. J Biol Chem. 2003 Sep 19;278(38):36652-60. doi: 10.1074/jbc.M306540200. Epub 2003 Jul 10. J Biol Chem. 2003. PMID: 12855691 - Leptin reverses insulin resistance and diabetes mellitus in mice with congenital lipodystrophy.
Shimomura I, Hammer RE, Ikemoto S, Brown MS, Goldstein JL. Shimomura I, et al. Nature. 1999 Sep 2;401(6748):73-6. doi: 10.1038/43448. Nature. 1999. PMID: 10485707 - Association between altered expression of adipogenic factor SREBP1 in lipoatrophic adipose tissue from HIV-1-infected patients and abnormal adipocyte differentiation and insulin resistance.
Bastard JP, Caron M, Vidal H, Jan V, Auclair M, Vigouroux C, Luboinski J, Laville M, Maachi M, Girard PM, Rozenbaum W, Levan P, Capeau J. Bastard JP, et al. Lancet. 2002 Mar 23;359(9311):1026-31. doi: 10.1016/S0140-6736(02)08094-7. Lancet. 2002. PMID: 11937183 - Across-species benefits of adrenalectomy on congenital generalized lipoatrophic diabetes: a review.
Contreras PH, Vigil P. Contreras PH, et al. Front Endocrinol (Lausanne). 2024 Jan 8;14:1151873. doi: 10.3389/fendo.2023.1151873. eCollection 2023. Front Endocrinol (Lausanne). 2024. PMID: 38260129 Free PMC article. Review. - A-ZIP/F-1 mice lacking white fat: a model for understanding lipoatrophic diabetes.
Reitman ML, Gavrilova O. Reitman ML, et al. Int J Obes Relat Metab Disord. 2000 Nov;24 Suppl 4:S11-4. doi: 10.1038/sj.ijo.0801493. Int J Obes Relat Metab Disord. 2000. PMID: 11126232 Review.
Cited by
- Schoenheimer effect explained--feedback regulation of cholesterol synthesis in mice mediated by Insig proteins.
Engelking LJ, Liang G, Hammer RE, Takaishi K, Kuriyama H, Evers BM, Li WP, Horton JD, Goldstein JL, Brown MS. Engelking LJ, et al. J Clin Invest. 2005 Sep;115(9):2489-98. doi: 10.1172/JCI25614. Epub 2005 Aug 11. J Clin Invest. 2005. PMID: 16100574 Free PMC article. - A systems approach to mapping transcriptional networks controlling surfactant homeostasis.
Xu Y, Zhang M, Wang Y, Kadambi P, Dave V, Lu LJ, Whitsett JA. Xu Y, et al. BMC Genomics. 2010 Jul 26;11:451. doi: 10.1186/1471-2164-11-451. BMC Genomics. 2010. PMID: 20659319 Free PMC article. - HIV-associated lipodystrophy: description, pathogenesis, and molecular pathways.
Mallon PW, Carr A, Cooper DA. Mallon PW, et al. Curr Diab Rep. 2002 Apr;2(2):116-24. doi: 10.1007/s11892-002-0070-x. Curr Diab Rep. 2002. PMID: 12643131 Review. - Insulin Resistance and Vulnerability to Cardiac Ischemia.
Jelenik T, Flögel U, Álvarez-Hernández E, Scheiber D, Zweck E, Ding Z, Rothe M, Mastrototaro L, Kohlhaas V, Kotzka J, Knebel B, Müller-Wieland D, Moellendorf S, Gödecke A, Kelm M, Westenfeld R, Roden M, Szendroedi J. Jelenik T, et al. Diabetes. 2018 Dec;67(12):2695-2702. doi: 10.2337/db18-0449. Epub 2018 Sep 26. Diabetes. 2018. PMID: 30257974 Free PMC article. - Mice lacking dipeptidyl peptidase IV are protected against obesity and insulin resistance.
Conarello SL, Li Z, Ronan J, Roy RS, Zhu L, Jiang G, Liu F, Woods J, Zycband E, Moller DE, Thornberry NA, Zhang BB. Conarello SL, et al. Proc Natl Acad Sci U S A. 2003 May 27;100(11):6825-30. doi: 10.1073/pnas.0631828100. Epub 2003 May 14. Proc Natl Acad Sci U S A. 2003. PMID: 12748388 Free PMC article.
References
- Araki E, Haag BL, III, Kahn CR. Cloning of the mouse insulin receptor substrate-1 (IRS-1) gene and complete sequence of mouse IRS-1. Biochim Biophys Acta. 1994;1221:353–356. - PubMed
- Brown MS, Goldstein JL. The SREBP pathway: Regulation of cholesterol metabolism by proteolysis of a membrane-bound transcription factor. Cell. 1997;89:331–340. - PubMed
- Cao Z, Umek RM, McKnight SL. Regulated expression of three C/EBP isoforms during adipose conversion of 3T3-L1 cells. Genes & Dev. 1991;5:1538–1552. - PubMed
Publication types
MeSH terms
Substances
LinkOut - more resources
Full Text Sources
Other Literature Sources
Molecular Biology Databases
Research Materials


