Depolarization and cAMP elevation rapidly recruit TrkB to the plasma membrane of CNS neurons - PubMed (original) (raw)
Depolarization and cAMP elevation rapidly recruit TrkB to the plasma membrane of CNS neurons
A Meyer-Franke et al. Neuron. 1998 Oct.
Abstract
Here, we describe a novel mechanism for the rapid regulation of surface levels of the neurotrophin receptor TrkB. Unlike nodose ganglion neurons, both retinal ganglion cells (RGCs) and spinal motor neurons (SMNs) in culture display only low levels of surface TrkB, though high levels are present intracellularly. Within minutes of depolarization or cAMP elevation, surface TrkB levels increase by nearly 4-fold, and this increase is not blocked by cycloheximide. These findings suggest that activity and cAMP elevation rapidly recruit TrkB to the plasma membrane by translocation from intracellular stores. We propose that a fundamental difference between peripheral nervous system (PNS) and central nervous system (CNS) neurons is the activity dependence of CNS neurons for responsiveness to their peptide trophic factors and that differences in membrane compartmentalization of the receptors underlie this difference.
Figures
Figure 1
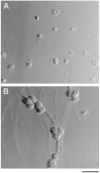
Hoffman Interference Contrast Micrographs of Purified SCG Neurons in Culture The cells were cultured for 3 days in serum-free medium lacking NGF (A) or containing NGF (20 ng/ml) (B). Scale bar, 50 μm.
Figure 2
Effects of Neurotrophins and cAMP Elevation on the Survival of Purified PNS Neurons Purified P2 sympathetic neurons (A) or nodose ganglion neurons (B) were plated at 5,000 cells per well in poly-
l
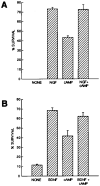
-lysine-coated 96-well tissue culture plates in serum-free medium containing the indicated substances. Plateau concentrations of neurotrophins were used (NGF was used at 20 ng/ml; BDNF was used at 50 ng/ml). cAMP was elevated by a combination of forskolin (5 μM) and IBMX (0.1 mM). Survival was measured after 3 days by the MTT assay. All values are means ± SEM (n = 3).
Figure 3
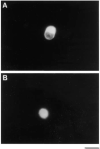
Immunofluoresence Micrographs of RGCs Stained by an Anti-MAP Kinase Antibody Most cells incubated for 3 hr in serum-free medium lacking enhancers of cAMP levels, regardless of the presence of neurotrophins, have predominantly cytoplasmic staining (A). In contrast, most cells incubated for 3 hr in medium containing neurotrophins together with elevators of cAMP have both cytoplasmic and nuclear staining (B). Scale bar, 20 μm.
Figure 4
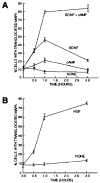
Effects of Neurotrophins and cAMP Elevation on MAP Kinase Translocation into the Nucleus Acutely isolated, purified P8 RGCs or P2 SCG neurons were plated onto PDL-coated coverslips for 1 hr and then treated with the indicated substances. Plateau concentrations of neurotrophins were used (NGF was used at 20 ng/ml; BDNF was used at 50 ng/ml). cAMP was elevated by a combination of forskolin (5 μM); in addition, IBMX (0.1 mM) was added to the SCG neurons. RGCs (A) or SCGs (B) were cultured for various times in the indicated substances and then labeled to determine the percentage of cells with MAP kinase staining in their nucleus. All values are means ± SEM. (n = 3).
Figure 5
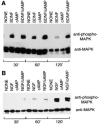
Effects of Neurotrophins and cAMP Elevation on MAP Kinase Activation in Purified RGCs and SCG Neurons Acutely isolated RGCs (A) or SCGs (B) were treated with neurotrophins and/or cAMP elevation as described in the legend of Figure 2. After various time perods, the cells were lysed and a Western blot analysis was performed to detect the amount of phosphorylated MAP kinase (upper half of each panel) as well as the total amount of MAP kinase protein (bottom half of each panel).
Figure 6
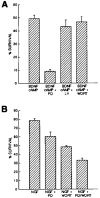
Effects of Pharmacological Inhibition of MAP Kinase and Pl3 Kinase on RGC and SCG Neuron Survival Approximately 5,000 purified P8 RGCs (A) or P2 SCGs (B) were plated into each well of a 96-well tissue culture plate into serum-free medium containing the indicated substances. Drugs were used at concentrations previously determined to specifically inhibit MEK (PD98059, 20 μM) and Pl3 kinase (Ly294002, 10 μM; wortmannin, 1 μM). After 3 days of culture, the percentage of cells surviving in each condition was determined by the MTT assay. All values are means ± SEM (n = 3).
Figure 7
Western Blot Analysis of Cell Surface TrkB on Purified RGCs Acutely isolated, purified P8 RGCs were plated at about 700,000 cells per 10 cm tissue culture dish, allowed to recover for 1 hr, and then treated for 1 hr with either forskolin (5 μM), in order to elevate cAMP, or BDNF (50 ng/ml) as indicated. Surface proteins were biotinylated, and the biotinylated proteins were analyzed by Western blotting with an affinity-purified anti-TrkB antibody. Only bands corresponding to full length TrkB (∼145 kDa) were detected.
Figure 8
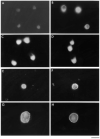
Immunofluorescence Micrographs of Purified RGCs and Nodose Ganglion Neurons Stained for Various Surface Proteins Approximately 5,000 RGCs (A-F) or nodose ganglion neurons (G and H) were plated onto PDL-coated glass coverslips for 1 hr prior to treatment for 1 hr with (B, D, F, and H) or without (A, C, E, and G) forskolin (5 μM) to elevate cAMP levels. For nodose ganglion neurons, IBMX (0.1 mM) was also added to elevate cAMP. After incubation, the coverslips were fixed lightly with paraformaldehyde and in some cases permeabilized with 0.4% Triton X-100 (C and D); in most cases, the cells were not permeabilized (A, B, and E-H). Cells were then immunostained with the indicated primary antibody, which was detected by using a FITC-conjugated secondary antibody. Cells were stained with either an antibody that detects an extracellular epitope of TrkB (A-D, G, and H) or the integrin-β1 subunit (E and F). Scale bar, 25 μm.
Figure 9
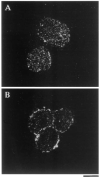
Confocal Micrographs of Retinal Ganglion Cells Stained with Anti-TrkB Antibodies Approximately 10,000 acutely isolated, purified P8 RGCs were plated onto PDL-coated glass coverslips for 1 hr to allow recovery and then treated with medium lacking (A) or containing (B) forskolin for 1 hr. The cells were then permeabilized and stained with the anti-TrkB antibodies prior to examination in a Multiprobe 2010 laser scanning confocal microscope (Molecular Dynamics). In (A), little surface immunoreactivity is detected; after cAMP treatment in (B), strong surface immunoreactivity is apparent. Scale bar, 10 μm.
Figure 10
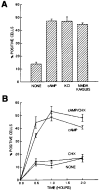
Effects of cAMP Elevation, Depolarization, and Cycloheximide on Surface TrkB Immunoreactivity Approximately 10,000 acutely isolated, purified P8 RGCs were plated onto PDL-coated glass coverslips for 1 hr to allow recovery. In (A), the cells were then treated with the indicated substances for 1 hr prior to immunostaining the unpermeabilized cells with the anti-TrkB antibodies. cAMP elevation was induced by forskolin (5 μM), and depolarization was elicited either by KCl (50 mM) or by glutamate receptor activation (a combination of NMDA, 200 μM; kainate, 200 μM; and quisqualate, 200 μM). In (B), the cells were incubated in the indicated substances for various time periods prior to immunostaining the unpermeabilized cells with the anti-TrkB antibodies. Cycloheximide was used at 100 μM.
Figure 11
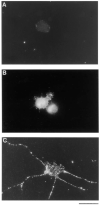
Immunofluorescence Micrographs of TrkB Immunoreactivity on Purified SMNs in Culture Approximately 5,000 SMNs were plated onto PDL-coated glass coverslips for 1 hr without (A and B) or with (C) forskolin and IBMX to elevate their cAMP levels. After incubation, the coverslips were fixed lightly with paraformaldehyde and in some cases permeabilized with 0.4% Triton X-100 (B); in most cases, the cells were not permeabilized (A and C). Cells were then immunostained with anti-TrkB anti-bodies that bind to an extracellular epitope of rat TrkB. The primary antibodies were detected by using a FITC-conjugated secondary antibody. Scale bar, 50 μm.
Figure 12
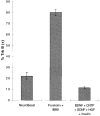
Effects of cAMP Elevation on Surface TrkB Immunoreactivity Approximately 5,000 purified SMNs were plated onto PDL-coated glass coverslips for 1 hr in serum-free medium containing the indicated substances prior to immunostaining the unpermeabilized cells with the anti-TrkB antibodies. The percentage of cells that were brightly surface immunoreactive for TrkB was counted in each condition. Results are means ± SEM (n = 3) of a representative experiment; this experiment was repeated twice.
Similar articles
- Development of survival responsiveness to brain-derived neurotrophic factor, neurotrophin 3 and neurotrophin 4/5, but not to nerve growth factor, in cultured motoneurons from chick embryo spinal cord.
Becker E, Soler RM, Yuste VJ, Giné E, Sanz-Rodríguez C, Egea J, Martín-Zanca D, Comella JX. Becker E, et al. J Neurosci. 1998 Oct 1;18(19):7903-11. doi: 10.1523/JNEUROSCI.18-19-07903.1998. J Neurosci. 1998. PMID: 9742158 Free PMC article. - Cyclic AMP elevation is sufficient to promote the survival of spinal motor neurons in vitro.
Hanson MG Jr, Shen S, Wiemelt AP, McMorris FA, Barres BA. Hanson MG Jr, et al. J Neurosci. 1998 Sep 15;18(18):7361-71. doi: 10.1523/JNEUROSCI.18-18-07361.1998. J Neurosci. 1998. PMID: 9736656 Free PMC article. - cAMP-mediated regulation of neurotrophin-induced collapse of nerve growth cones.
Wang Q, Zheng JQ. Wang Q, et al. J Neurosci. 1998 Jul 1;18(13):4973-84. doi: 10.1523/JNEUROSCI.18-13-04973.1998. J Neurosci. 1998. PMID: 9634563 Free PMC article. - Inhibition of phosphorylation of TrkB and TrkC and their signal transduction by alpha2-macroglobulin.
Hu YQ, Koo PH. Hu YQ, et al. J Neurochem. 1998 Jul;71(1):213-20. doi: 10.1046/j.1471-4159.1998.71010213.x. J Neurochem. 1998. PMID: 9648868 - Potential regulation by trophic factors of low-affinity NGF receptors in spinal motor neurons.
Hagg T, Rende M, Magal E, Burnham P, Oudega M, Varon S. Hagg T, et al. Brain Res Bull. 1993;30(3-4):347-52. doi: 10.1016/0361-9230(93)90263-b. Brain Res Bull. 1993. PMID: 8457883 Review.
Cited by
- Impact of Cell Density on Differentiation Efficiency of Rat Adipose-derived Stem Cells into Schwann-like Cells.
Najafabadi MM, Bayati V, Orazizadeh M, Hashemitabar M, Absalan F. Najafabadi MM, et al. Int J Stem Cells. 2016 Nov 30;9(2):213-220. doi: 10.15283/ijsc16031. Int J Stem Cells. 2016. PMID: 27788569 Free PMC article. - Wnt signaling in the vertebrate central nervous system: from axon guidance to synaptic function.
Salinas PC. Salinas PC. Cold Spring Harb Perspect Biol. 2012 Feb 1;4(2):a008003. doi: 10.1101/cshperspect.a008003. Cold Spring Harb Perspect Biol. 2012. PMID: 22300976 Free PMC article. Review. - Insulin-like growth factor 1 inhibits extracellular signal-regulated kinase to promote neuronal survival via the phosphatidylinositol 3-kinase/protein kinase A/c-Raf pathway.
Subramaniam S, Shahani N, Strelau J, Laliberté C, Brandt R, Kaplan D, Unsicker K. Subramaniam S, et al. J Neurosci. 2005 Mar 16;25(11):2838-52. doi: 10.1523/JNEUROSCI.5060-04.2005. J Neurosci. 2005. PMID: 15772344 Free PMC article. - A role for voltage-gated potassium channels in the outgrowth of retinal axons in the developing visual system.
McFarlane S, Pollock NS. McFarlane S, et al. J Neurosci. 2000 Feb 1;20(3):1020-9. doi: 10.1523/JNEUROSCI.20-03-01020.2000. J Neurosci. 2000. PMID: 10648707 Free PMC article. - Cellular mechanisms associated with spontaneous and ciliary neurotrophic factor-cAMP-induced survival and axonal regeneration of adult retinal ganglion cells.
Park K, Luo JM, Hisheh S, Harvey AR, Cui Q. Park K, et al. J Neurosci. 2004 Dec 1;24(48):10806-15. doi: 10.1523/JNEUROSCI.3532-04.2004. J Neurosci. 2004. PMID: 15574731 Free PMC article.
References
- Alessi DR, Cuenda A, Cohen P, Dudley DT, Saltiel A. PD098059 is a specific inhibitor of the activation of mitogen activated protein kinase kinase in vitro and in vivo. J. Biol. Chem. 1995;270:27489–27494. - PubMed
- Barde YA. Trophic factors and neuronal survival. Neuron. 1989;2:1525–1534. - PubMed
- Barde YA. The nerve growth family. Prog. Growth Factor Res. 1990;2:237–248. - PubMed
- Barker PA, Shooter EM. Disruption of NGF binding to the low affinity neurotrophin receptor p75NGFR reduces NGF binding to TrkA on PC12 cells. Neuron. 1994;13:203–215. - PubMed
- Barres BA, Silverstein BE, Corey DP, Chun LLY. Immunological, morphological and electrophysiological variation among retinal ganglion cells purified by panning. Neuron. 1988;1:791–803. - PubMed
Publication types
MeSH terms
Substances
Grants and funding
- GM 07449/GM/NIGMS NIH HHS/United States
- R01 EY11030/EY/NEI NIH HHS/United States
- T32 GM007449/GM/NIGMS NIH HHS/United States
- P50 MH048200/MH/NIMH NIH HHS/United States
- MH48200/MH/NIMH NIH HHS/United States
LinkOut - more resources
Full Text Sources
Other Literature Sources
