Direct pathway from early/recycling endosomes to the Golgi apparatus revealed through the study of shiga toxin B-fragment transport - PubMed (original) (raw)
Direct pathway from early/recycling endosomes to the Golgi apparatus revealed through the study of shiga toxin B-fragment transport
F Mallard et al. J Cell Biol. 1998.
Abstract
Shiga toxin and other toxins of this family can escape the endocytic pathway and reach the Golgi apparatus. To synchronize endosome to Golgi transport, Shiga toxin B-fragment was internalized into HeLa cells at low temperatures. Under these conditions, the protein partitioned away from markers destined for the late endocytic pathway and colocalized extensively with cointernalized transferrin. Upon subsequent incubation at 37 degreesC, ultrastructural studies on cryosections failed to detect B-fragment-specific label in multivesicular or multilamellar late endosomes, suggesting that the protein bypassed the late endocytic pathway on its way to the Golgi apparatus. This hypothesis was further supported by the rapid kinetics of B-fragment transport, as determined by quantitative confocal microscopy on living cells and by B-fragment sulfation analysis, and by the observation that actin- depolymerizing and pH-neutralizing drugs that modulate vesicular transport in the late endocytic pathway had no effect on B-fragment accumulation in the Golgi apparatus. B-fragment sorting at the level of early/recycling endosomes seemed to involve vesicular coats, since brefeldin A treatment led to B-fragment accumulation in transferrin receptor-containing membrane tubules, and since B-fragment colocalized with adaptor protein type 1 clathrin coat components on early/recycling endosomes. Thus, we hypothesize that Shiga toxin B-fragment is transported directly from early/recycling endosomes to the Golgi apparatus. This pathway may also be used by cellular proteins, as deduced from our finding that TGN38 colocalized with the B-fragment on its transport from the plasma membrane to the TGN.
Figures
Figure 3
Kinetics of B-fragment transport from EE/RE to the Golgi apparatus. (A) Confocal microscopy on living HeLa cells. Fluorophore-labeled B-fragment was internalized for 1 h into HeLa cells at 19.5°C, upon which the cells were transferred to the stage of a confocal microscope and incubated at 37°C. Digital images (four integration frames) were acquired at the indicated time points. Note that after 4 min, B-fragment was detected in peripheral structures, and then later concentrated in the perinuclear region. (B) Images as shown in A were quantified, and the fraction of average Golgi associated fluorescence over average total cell-associated fluorescence is represented in function of incubation time at 37°C. The means (± SE) of eight experiments are shown. The curve was fitted to f(x) = 1 + 2.97[1 − exp(−0.036×)], r = 0.9979. (C) Sulfation analysis. B-(Sulf)2 was internalized into HeLa cells at 19.5°C, and the cells were then shifted to 37°C. After 0, 15, 30, 60, and 90 min, radioactive sulfate was added for 15 min. Note that B-(Sulf)2 is at its peak concentration in the TGN during the 15–30 min interval. A representative of 2 experiments is shown. In each experiment, the data points were obtained in duplicate. (D) Cotransport of B-fragment and Tf in living cells. For the points 3 and 10 min at 37°C, fluorophore-coupled B-fragment and fluorophore-coupled Tf were internalized as described in A. For the point 30 min at 37°C, B-fragment alone was internalized continuously at 37°C, cells were then fixed and stained for the TfR. Note that the B-fragment concentrated in the Golgi area (large arrow at 10 min), while remaining cytoplasmic B-fragment–containing structures always were Tf (4 and 10 min) or TfR (30 min) positive (small arrows at 30 min). Single optical slices were obtained by confocal microscopy.
Figure 5
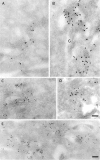
B-fragment is detected in compartments of the late endocytic pathway during transport to the Golgi apparatus. (A and B) HeLa cells were incubated with B-fragment and BSA-gold (5-nm gold particles) at 19.5°C. Cryosections were stained with anti–B-fragment antibody (10-nm gold particles). The arrow in B indicates a region of high BSA-gold concentration (bulk fluid phase) that is devoid of B-fragment. (C) Cells treated as in A and B were then shifted for 15 min to 37°C, fixed, and then cryosections were stained with anti–B-fragment antibody (15-nm gold particles) and anti–CI-MPR antibody (10-nm gold particles). Various endocytic structures are indicated by numbers: areas 1, BSA-gold–labeled EE; areas 2, CI-MPR- and BSA-gold–positive multivesicular LE; areas 3, CI-MPR–positive multilamellar LE. GA, Golgi apparatus. (D) Quantification of BSA-gold–positive structures containing or not B-fragment, after the 19.5°C incubation (lanes 1 and 2) or after an additional shift to 37°C for 15 min (lanes 3 and 4). (Lanes 1 and 3) Percentage of BSA-gold–containing structures that also contain B-fragment; (lanes 2 and 4), BSA-gold–containing structures without B-fragment. Bars, 100 nm.
Figure 10
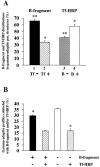
Quantification of γ-adaptin–positive membrane profiles. (A) Distribution of B-fragment and Tf-HRP–specific gold particles in γ-adaptin–positive membrane profiles. The columns represent the fraction of B-fragment (lanes 1 and 2) in γ-adaptin– positive structures that were labeled (lane 2) or not labeled (lane 1) for Tf-HRP, or the fraction of Tf-HRP (lanes 3 and 4) in γ-adaptin–positive structures that were labeled (lane 4) or not labeled (lane 3) for B-fragment. (B) Characterization of γ-adaptin–positive structures. Note that significantly more γ-adaptin– positive profiles were labeled for only B-fragment (left column), compared with such structures labeled for only Tf-HRP (right column). * and **, direct comparison shows that these conditions are significantly different (P < 0.01; see Materials and Methods).
Figure 9
γ-Adaptin and clathrin colocalize with B-fragment and Tf-HRP at the ultrastructural level on coated membrane profiles of EE/RE. (A–E) HeLa cells were incubated for 1 h with B-fragment and BSA-gold (5-nm gold particles) at 19.5°C. Cryosections of these cells were labeled with anti–B-fragment antibody (15-nm gold particles) and anti–γ-adaptin antibody (10-nm gold particles in A–C) or anti-clathrin antibody (10-nm gold particles in D and E). In A–C, arrowheads indicate regions of colocalization between γ-adaptin and B-fragment. In D and E, arrowheads point out regions of colocalization between clathrin and B-fragment. (F-I) Serum-starved HeLa cells were incubated for 1 h with B-fragment and Tf-HRP at 19.5°C. Cryosections of these cells were labeled with anti–B-fragment antibody (15-nm gold particles), anti-HRP antibody (10-nm gold particles), and anti–γ-adaptin antibody (5-nm gold particles). Arrowheads in F and G point to double- or triple-labeled profiles. (H and I) Magnification of selected structures. Bars, 100 nm.
Figure 1
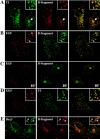
Study of B-fragment colocalization with established markers of the endocytic pathway during incubation at 19.5°C. The following proteins were incubated with HeLa cells at 19.5°C for 1 h: (A) Tf (green) and B-fragment (red), a large arrow indicates a region of perinuclear staining; (B) EGF (red) and B-fragment (green), arrows point out regions where B-fragment and EGF staining are juxtaposed; (D) TF (green) and EGF (red); (E) Dex3 (green) and B-fragment (red), note vesicular (large arrows) and tail-like (small arrows) Dex3 staining. For marker concentrations see Materials and Methods. Digital images (four integration frames) were acquired by confocal microscopy. The right panel represents the superposition of the red and green images. Insets show selected areas at higher magnification. In C, EGF (red) and B-fragment (green) were internalized at 19.5°C, as in B. The cells were then shifted to 37°C for 10 min before fixation. Note that B-fragment and EGF-specific labeling did basically not overlap.
Figure 2
Kinetics of B-fragment transport from EE/RE to the Golgi apparatus revealed by immunoelectron microscopy in HeLa cells. (A) B-fragment was internalized for 1 h at 19.5°C, cells were fixed and prepared for cryosectionning as described under Materials and Methods. B-fragment (10-nm gold particles) was detected in tubular and vesicular elements that were also labeled for the TfR (15-nm gold particles). Cells that had internalized B-fragment at 19.5°C were then shifted for 2 min (B), 10 min (C–D), and 30 min (E) to 37°C. Cryosections were stained for B-fragment (10-nm gold particles in B, C, and E; 15-nm gold particles in D) and MPR46 (15-nm gold particles in B; 10-nm gold particles in D). Cryosections that were doubled stained for MPR46 (in B and D) showed that the B-fragment entered the Golgi apparatus via the TGN. Bars, 100 nm.
Figure 4
A fraction of internalized B-fragment is recycled to the plasma membrane. FITC-labeled B-fragment was internalized into HeLa cells at 19.5°C, the cells were then incubated with anti-FITC antibody on ice for 30 min and shifted to 37°C in the continued presence of the anti-FITC antibody for the indicated periods. Fluorescence at each time point was determined as described in Materials and Methods and compared with the 0 time point to determine quenching due to newly recycled B-fragment. The means (± SE) for three independent experiments are shown.
Figure 6
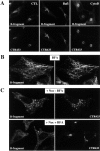
Drug effects on B-fragment transport to the Golgi apparatus. HeLa cells were incubated with fluorophore-labeled B-fragment for 1 h at 19.5°C, before being shifted to 37°C (A) in the absence (CTL) or presence of 1 μM Bafi or 1 μM CytoD, or (B) in the presence of 5 μg/ ml BFA. The cells were then fixed and labeled with CTR433 antibody (A) or anti-TfR antibody (B). (C) BFA inhibits B-fragment transport to dispersed Golgi cisternae in Noc-treated HeLa cells. HeLa cells were pretreated for 1 h with 10 μM Noc. The cells were then transferred on ice and incubated with fluorophore-labeled B-fragment for 30 min, washed, and then shifted for 30 min to 37°C in the absence (top row) or presence (bottom row) of 5 μg/ml BFA and in the continued presence of Noc. The cells were then fixed and stained for the Golgi marker CTR433. Note that in the absence of BFA, B-fragment associated with the dispersed cisternae of the Golgi apparatus (top), while in the presence of the drug, the CTR433-positive cisternae were devoid of B-fragment (bottom). Four optical slices were obtained by confocal microscopy.
Figure 7
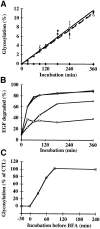
Quantification of drug effects on B-fragment transport to the biosynthetic/ secretory pathway. (A) HeLa cells were preincubated 2 h with 1 μM Bafi (open squares) and 1 μM CytoD (open diamonds). The cells were then transferred on ice and incubated with 50 nM iodinated B-Glyc-KDEL for 30 min. After washing, the cells were shifted to 37°C in the continued presence of the drugs. BFA (closed diamonds) was added only upon temperature shift to 37°C. Control cells (closed circles) were not treated with drugs. After the indicated times at 37°C, cells were lysed in sample buffer, and then lysates were analyzed on 10–20% polyacrylamide–SDS gradient gels, followed by autoradiography. The percentage of glycosylated B-Glyc-KDEL was expressed in function of incubation time. The means of three independent experiments (± SE) are shown. (B) Radiolabeled EGF was internalized into HeLa cells at 19.5°C. The cells were then shifted to 37°C in the absence (closed circles) or presence of 1 μM Bafi (open squares), 1 μM CytoD (open circles), or 5 μg/ml BFA (open diamonds). After the indicated times at 37°C, the number of TCA-soluble counts in the culture medium was determined as described in Materials and Methods. A representative of two experiments is shown. (C) Iodinated B-Glyc-KDEL was bound to HeLa cells, as described in A. The cells were then shifted to 37°C, and 5 μg/ml BFA was added after the indicated times (−30 min to 4 h, with respect to the beginning of B-Glyc-KDEL internalization). After 4 h at 37°C, cells were lysed and glycosylated B-Glyc-KDEL was determined as described in A. A representative of two experiments is shown.
Figure 8
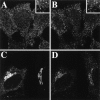
At 19.5°C, the γ-adaptin subunit of AP-1–type clathrin coats is relocalized from the TGN to EE/RE. Fluorophore-labeled B-fragment (A and C) was internalized for 1 h into HeLa cells at 19.5°C. The cells were then either fixed directly (A and B), or shifted for 30 min to 37°C (C and D) before fixation and staining for γ-adaptin (B and D). Note that at 19.5°C, γ-adaptin and B-fragment colocalized on EE/RE (A and B), and after shift to 37°C, γ-adaptin was relocalized to the TGN, in parallel with B-fragment accumulation in Golgi cisternae (C and D).
Figure 11
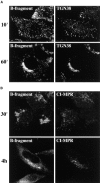
B-fragment and anti-TGN38, but not anti–CI-MPR, are found in the same structures. (A) Fluorophore-labeled B-fragment (left) and anti-TGN38 antibody (right) were bound to HeLa C7 cells on ice, upon which the cells were incubated at 37°C for 10 min (top) and 60 min (bottom) in the continued presence of both proteins. The cells were then fixed and stained for internalized anti-TGN38 antibody (right). (B) Fluorophore-labeled B-fragment (left) and anti– CI-MPR antibody (right) were bound to HeLa cells on ice, upon which the cells were incubated at 37°C for 30 min (top) and 4 h (bottom) in the continued presence of both proteins. The cells were then fixed and stained for internalized anti– CI-MPR antibody (right).
Similar articles
- Alternate routes for drug delivery to the cell interior: pathways to the Golgi apparatus and endoplasmic reticulum.
Tarragó-Trani MT, Storrie B. Tarragó-Trani MT, et al. Adv Drug Deliv Rev. 2007 Aug 10;59(8):782-97. doi: 10.1016/j.addr.2007.06.006. Epub 2007 Jun 28. Adv Drug Deliv Rev. 2007. PMID: 17669543 Free PMC article. Review. - Identification of different itineraries and retromer components for endosome-to-Golgi transport of TGN38 and Shiga toxin.
Lieu ZZ, Gleeson PA. Lieu ZZ, et al. Eur J Cell Biol. 2010 May;89(5):379-93. doi: 10.1016/j.ejcb.2009.10.021. Epub 2010 Feb 6. Eur J Cell Biol. 2010. PMID: 20138391 - The retromer complex and clathrin define an early endosomal retrograde exit site.
Popoff V, Mardones GA, Tenza D, Rojas R, Lamaze C, Bonifacino JS, Raposo G, Johannes L. Popoff V, et al. J Cell Sci. 2007 Jun 15;120(Pt 12):2022-31. doi: 10.1242/jcs.003020. J Cell Sci. 2007. PMID: 17550971 - Efficient endosome-to-Golgi transport of Shiga toxin is dependent on dynamin and clathrin.
Lauvrak SU, Torgersen ML, Sandvig K. Lauvrak SU, et al. J Cell Sci. 2004 May 1;117(Pt 11):2321-31. doi: 10.1242/jcs.01081. J Cell Sci. 2004. PMID: 15126632 - Targeting the Early Endosome-to-Golgi Transport of Shiga Toxins as a Therapeutic Strategy.
Li D, Selyunin A, Mukhopadhyay S. Li D, et al. Toxins (Basel). 2020 May 22;12(5):342. doi: 10.3390/toxins12050342. Toxins (Basel). 2020. PMID: 32456007 Free PMC article. Review.
Cited by
- AP-1 and ARF1 control endosomal dynamics at sites of FcR mediated phagocytosis.
Braun V, Deschamps C, Raposo G, Benaroch P, Benmerah A, Chavrier P, Niedergang F. Braun V, et al. Mol Biol Cell. 2007 Dec;18(12):4921-31. doi: 10.1091/mbc.e07-04-0392. Epub 2007 Oct 3. Mol Biol Cell. 2007. PMID: 17914058 Free PMC article. - Dimeric Lectin Chimeras as Novel Candidates for Gb3-Mediated Transcytotic Drug Delivery through Cellular Barriers.
Xu M, Antonova M, Salavei P, Illek K, Meléndez AV, Omidvar R, Thuenauer R, Makshakova O, Römer W. Xu M, et al. Pharmaceutics. 2023 Jan 9;15(1):225. doi: 10.3390/pharmaceutics15010225. Pharmaceutics. 2023. PMID: 36678854 Free PMC article. - The Mitogen-activated protein kinase p38 links Shiga Toxin-dependent signaling and trafficking.
Wälchli S, Skånland SS, Gregers TF, Lauvrak SU, Torgersen ML, Ying M, Kuroda S, Maturana A, Sandvig K. Wälchli S, et al. Mol Biol Cell. 2008 Jan;19(1):95-104. doi: 10.1091/mbc.e07-06-0565. Epub 2007 Oct 24. Mol Biol Cell. 2008. PMID: 17959827 Free PMC article. - Alternate routes for drug delivery to the cell interior: pathways to the Golgi apparatus and endoplasmic reticulum.
Tarragó-Trani MT, Storrie B. Tarragó-Trani MT, et al. Adv Drug Deliv Rev. 2007 Aug 10;59(8):782-97. doi: 10.1016/j.addr.2007.06.006. Epub 2007 Jun 28. Adv Drug Deliv Rev. 2007. PMID: 17669543 Free PMC article. Review. - Retrograde transport pathways utilised by viruses and protein toxins.
Spooner RA, Smith DC, Easton AJ, Roberts LM, Lord JM. Spooner RA, et al. Virol J. 2006 Apr 7;3:26. doi: 10.1186/1743-422X-3-26. Virol J. 2006. PMID: 16603059 Free PMC article. Review.
References
Publication types
MeSH terms
Substances
LinkOut - more resources
Full Text Sources
Other Literature Sources
Miscellaneous


