Slow closed-state inactivation: a novel mechanism underlying ramp currents in cells expressing the hNE/PN1 sodium channel - PubMed (original) (raw)
Slow closed-state inactivation: a novel mechanism underlying ramp currents in cells expressing the hNE/PN1 sodium channel
T R Cummins et al. J Neurosci. 1998.
Abstract
To better understand why sensory neurons express voltage-gated Na+ channel isoforms that are different from those expressed in other types of excitable cells, we compared the properties of the hNE sodium channel [a human homolog of PN1, which is selectively expressed in dorsal root ganglion (DRG) neurons] with that of the skeletal muscle Na+ channel (hSkM1) [both expressed in human embryonic kidney (HEK293) cells]. Although the voltage dependence of activation was similar, the inactivation properties were different. The V1/2 for steady-state inactivation was slightly more negative, and the rate of open-state inactivation was approximately 50% slower for hNE. However, the greatest difference was that closed-state inactivation and recovery from inactivation were up to fivefold slower for hNE than for hSkM1 channels. TTX-sensitive (TTX-S) currents in small DRG neurons also have slow closed-state inactivation, suggesting that hNE/PN1 contributes to this TTX-S current. Slow ramp depolarizations (0.25 mV/msec) elicited TTX-S persistent currents in cells expressing hNE channels, and in DRG neurons, but not in cells expressing hSkM1 channels. We propose that slow closed-state inactivation underlies these ramp currents. This conclusion is supported by data showing that divalent cations such as Cd2+ and Zn2+ (50-200 microM) slowed closed-state inactivation and also dramatically increased the ramp currents for DRG TTX-S currents and hNE channels but not for hSkM1 channels. The hNE and DRG TTX-S ramp currents activated near -65 mV and therefore could play an important role in boosting stimulus depolarizations in sensory neurons. These results suggest that differences in the kinetics of closed-state inactivation may confer distinct integrative properties on different Na+ channel isoforms.
Figures
Fig. 1.
hNE and hSkM1 channels have similar activation properties. A, Family of traces from representative HEK293 cells expressing either hNE channels (left) or hSkM1 channels (right). The currents were elicited by 40 msec test pulses to various potentials from −60 to 30 mV. Cells were held at −100 mV. B, Normalized peak current–voltage relationship for hNE (filled squares; n = 14) and hSkM1 (open circles; n = 12).C, The deactivation time course of hNE and hSkM1 channels examined at potentials ranging from −120 to −50 mV after a 0.5 msec activation prepulse to 0 mV. Deactivation time constants were obtained from single-exponential fits to the tail currents for hNE (filled squares; n = 16) or hSkM1 (open circles; n = 12) channels. Inset. Traces showing representative hNE (solid line) and hSkM1 (dotted line) deactivation tail currents at −70 mV.
Fig. 2.
hNE and hSkM1 channels have distinct inactivation properties. A, Representative currents from whole-cell recordings of a cell expressing hNE channels (_trace_labeled hNE) and a cell expressing hSkM1 channels (unlabeled trace). Currents were elicited by a step depolarization to −30 mV from a holding potential of −100 mV and were scaled for comparison. The hNE current decays more slowly than does the hSkM1 current. B, Inactivation kinetics as a function of voltage. The macroscopic decay time constant is greater for hNE currents (filled squares;n = 10) than for hSkM1 currents (open circles; n = 10) at each voltage. Time constants were estimated from single-exponential fits to the decay phase of currents elicited by 100 msec step depolarizations to the indicated potential. C, Comparison of hNE (filled squares; n = 13) and hSkM1 (open circles; _n_= 12) steady-state inactivation. Steady-state inactivation was estimated by measuring the peak current amplitude elicited by 20 msec test pulses to −10 mV after 500 msec prepulses to potentials over the range of −130 to −10 mV. Current is plotted as a fraction of the maximum peak current.
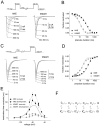
Fig. 3.
Recovery from inactivation and development of inactivation are slower for hNE channels than for hSkM1 channels.A, Family of current traces from cells expressing hNE or hSkM1 currents showing the rate of recovery from inactivation at −80 mV. The standard recovery from inactivation voltage protocol is shown above the current_traces_. The cells were prepulsed to −20 mV for 20 msec to inactivate all of the current and then brought back to −80 mV for increasing recovery durations before the test pulse to −20 mV. The maximum pulse rate was 0.5 Hz. B, Time course for recovery from inactivation of peak currents at −80 mV. Recovery is much slower for hNE (filled squares;n = 12) than for hSkM1 (open circles; n = 11) currents. The solid curves show single-exponential functions fitted to the data, with time constants of 104 msec (hNE) and 16 msec (hSkM1). The data are plotted on a logarithmic time axis to allow comparison of the disparate time courses. C, Family of current traces from cells expressing hNE and hSkM1 currents showing the rate of development of inactivation at −80 mV. The standard development of inactivation voltage protocol is shown_above_ the current traces. From a holding potential of −100 mV, the cells were prepulsed to −80 mV for increasing durations and then stepped to −20 mV to determine the fraction of current inactivated during the prepulse. D, Time course for development of inactivation for the peak current. Inactivation develops more slowly at −80 mV for hNE channels (filled squares; n = 12) than for hSkM1 channels (open circles; n_= 11). The solid curves are single-exponential functions fitted to the data, with time constants of 144 msec (hNE) and 26 msec (hSkM1). E, The time constants for recovery from inactivation (squares) and development of inactivation (circles) plotted as a function of voltage. Time constants were estimated from single-exponential fits to time courses measured with the protocols shown in A and_C for cells expressing hNE channels (filled symbols; n = 15) and hSkM1 channels (open symbols; n = 11). For comparison the inactivation time constants for the TTX-S current in small DRG neurons are shown (dotted curve).F, Basic multistate gating scheme for sodium channel activation and fast inactivation. Closed states are indicated by_C_s, inactivated closed states are indicated by_IC_s, the open state is indicated by O, and the inactivated open state is indicated by IO. At very negative potentials, channels reside in the leftmost closed state, and with depolarization the channels progress toward the open state. Channels can inactivate from any state.
Fig. 4.
Functional consequences of slow closed-state inactivation. A, The sodium currents elicited in a cell expressing hSkM1 channels by a 50 Hz pulse train. The cell, held at −80 mV, was depolarized to 0 mV for 2 msec every 20 msec during the 1 sec pulse train. Inset, Currents elicited by the first and second depolarizations on an expanded time scale (calibration bar, 2 msec). The current elicited by the second pulse is approximately one-half the amplitude of the current elicited by the first pulse.B, The sodium currents elicited in a cell expressing hNE channels by a 50 Hz pulse train. Details are as described in_A_. The current elicited by the second pulse is much smaller than that elicited by the first pulse. C, Comparison of hSkM1 current elicited by a step depolarization to 0 mV from −100 mV (left trace) with the hSkM1 current elicited by a step depolarization from −50 mV that was preceded by a slow ramp depolarization from −100 to −50 mV (right traces). The voltage protocol is shown below the current traces. Two different ramp speeds were used: 1 mV/msec (50 msec total duration) and 0.2 mV/msec (250 msec total duration). After the 50 msec ramp, less than one-half of the current remains available for activation, and after the 250 msec ramp, only ∼10% of the current is available. D, Currents elicited by the voltage protocols detailed in C in a cell expressing hNE channels. After the 50 msec ramp, much of the hNE current remains available for activation, and after the 250 msec ramp, more than one-third of the current is still available.Inset, The end of the 50 msec ramp depolarization at higher gain. The arrow indicates a region where the ramp depolarization elicits an inward current before the step depolarization.
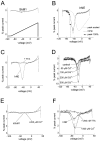
Fig. 5.
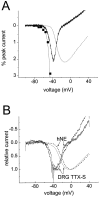
Characterization of ramp currents. Ramp currents were examined using 600 msec voltage ramps from −100 to +40 mV (∼0.23 mV/msec). A, The average ramp current recorded in cells expressing hSkM1 channels (n = 12). The_thick solid line_ at the _bottom_illustrates the ramp voltage protocol. The ramp current is plotted as a percentage of the peak sodium current elicited with step depolarizations from −100 mV. The error bar indicates the SE at −45 mV. B, The average ramp current recorded in cells expressing hNE channels (n = 11). The ramp current is plotted as a percentage of the peak sodium current elicited with step depolarizations from −100 mV. The error bar indicates the SE at −45 mV. The dotted curve shows the averaged current–voltage (I–V) relationship for the peak current elicited with step depolarizations in these cells scaled to the amplitude of the ramp current. The filled squares show the peak I–V data at full scale. Only the foot of the curve can be seen at this scale. The step depolarizations to −60 mV elicited ∼1.2% of the current elicited by the step depolarizations to −15 mV. C, Current traces elicited in an hNE cell by 600 msec ramps. The current (plotted as a percentage of peak current) is shown before and after the addition of 250 n
m
TTX to the extracellular solution. TTX blocks the ramp current. D, Current traces elicited in an hNE cell by 600 msec ramps shown before and after the addition of increasing concentrations of cadmium (50–500 μ
m
Cd2+) to the extracellular solution. Cadmium increases the amplitude of the ramp current in hNE cells.E, The average currents elicited by 600 msec ramps in cells expressing hSkM1 channels shown before and after addition of 200 μ
m
cadmium to the extracellular solution (n = 4). Cadmium does not induce hSkM1 ramp currents. F, The average currents elicited by 600 msec ramps in cells expressing hNE channels shown before and after addition of 200 μ
m
cadmium to the extracellular solution (n = 5). Cadmium increased the amplitude of the ramp current by ∼150%, and all of the ramp current in cadmium was blocked by 250 n
m
TTX. Error bars indicate SE at −40 mV.
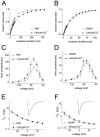
Fig. 6.
Cadmium modulates closed-state inactivation in hNE but not in hSkM1 channels. A, Cadmium slows the development of sodium current inactivation in a cell expressing hNE channels. The time course for development of inactivation at −80 mV is shown before (open squares) and after (filled squares) addition of 200 μ
m
Cd2+ to the extracellular solution. The solid curves are single-exponential functions fit to the hNE data before (τ = 96 msec) and after (τ = 155 msec) cadmium.B, Cadmium does not slow the development of sodium current inactivation in a cell expressing hSkM1 channels. The time course for development of inactivation at −80 mV is shown before (open circles; τ = 29 msec) and after (filled circles; τ = 26 msec) addition of 200 μ
m
Cd2+ to the extracellular solution. Please note the difference in the x_-axis scales between_A and B. C, The inactivation time constants between −140 and −40 mV for Na+ currents in cells expressing hNE cells (n = 5) are shown before (open squares) and after (filled squares) addition of 100 μ
m
Cd2+ to the extracellular solution. At voltages at which both development of inactivation and recovery from inactivation were measured (i.e., between −60 and −90 mV), the inactivation time constant was estimated by averaging the development of inactivation and recovery from inactivation time constants. D, The inactivation time constants between −140 and −40 mV for Na+ currents in cells expressing hSkM1 cells (n = 4) are shown before (open circles) and after (filled circles) addition of 500 μ
m
Cd2+ to the extracellular solution. Note the difference in the _y_-axis scales between C_and D. E, The inactivation time constants for open-state inactivation (τ_h) measured from single-exponential fits to the decay of currents elicited by step depolarizations to voltages between −30 and +30 mV for Na+ currents in cells expressing hNE channels (n = 6) are shown before (open squares) and after (filled squares) addition of 200 μ
m
Cd2+ to the extracellular solution. Inset, Current_traces_ are from a representative hNE cell before (solid trace) and after (dashed trace) cadmium. F, Plots of τ_h_measured at voltages between −30 and +30 mV for Na+currents in cells expressing hSkM1 channels (n = 4) are shown before (open circles) and after (filled circles) addition of 500 μ
m
Cd2+ to the extracellular solution.Inset, Current traces are from a representative hSkM1 cell before (solid trace) and after (dashed trace) cadmium.
Fig. 7.
Zinc, but not barium, also modulates hNE closed-state inactivation and increases hNE ramp currents.A, Current traces elicited in an hNE cell by 600 msec ramps are shown before and after the addition of increasing concentrations of zinc (50–500 μ
m
) to the extracellular solution. Zinc increases the amplitude of the ramp current in hNE cells. B, The inactivation time constants between −140 and −40 mV for Na+ currents in cells expressing hNE cells (n = 4) are shown before (filled squares) and after (open diamonds) addition of 100 μ
m
Zn2+ to the extracellular solution.C, Currents elicited by 600 msec ramps in an hNE cell are shown before and after addition of 200 μ
m
barium to the extracellular solution. Barium does not increase hNE ramp currents (n = 4). D, The inactivation time constants between −140 and −40 mV for Na+ currents in cells expressing hNE (n = 6) are shown before (filled squares) and after (open triangles) addition of 200 μ
m
Ba2+ to the extracellular solution.
Fig. 8.
Cadmium modulates closed-state inactivation and ramp currents in DRG neurons. A, Families of current_traces_ from a small DRG neuron (21 μm in diameter) before (left) and after (right) application of 100 μ
m
Cd2+ to the extracellular solution show that the rate of development of inactivation at −80 mV is slowed by Cd2+. The TTX-S peak current amplitude was 98% of the total peak current amplitude in this cell. B, Time course for development of inactivation of the peak current before (filled squares) and after (open circles) application of 100 μ
m
Cd2+. Data are from the currents shown in A. C, The inactivation time constants between −140 and −40 mV for TTX-S Na+ currents in small (18–25 μm) DRG neurons from adult rats (n = 6) are shown before (filled squares) and after (open squares) addition of 100 μ
m
Cd2+ to the extracellular solution. Data were obtained with the same two-pulse protocol described in Figure3_C_. The TTX-S peak current amplitude was 75 ± 4% (n = 6) of the total peak current amplitude for these cells. D, Ramp current recorded in a small DRG neuron before (left) and after (right) addition of 100 μ
m
Cd2+ to the extracellular solution. Cd2+ increases the ramp current component that peaks near −40 mV. This component is blocked by 250 n
m
TTX (right). A second component (left; marked by the asterisk) is apparently blocked by Cd2+ and may therefore be a calcium current. The ramp, which extended from −100 to +40 mV, was 600 msec long. The scale bar indicates the percentage of the peak current amplitude measured with a step depolarization to −10 mV.
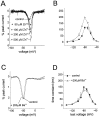
Fig. 9.
The thresholds for activation of ramp currents and peak transient currents are similar. A, The ramp current recorded in a small DRG neuron expressing predominantly TTX-S sodium current. The ramp current is plotted as a percentage of the peak sodium current elicited with step depolarizations from −100 mV. The_dotted curve_ shows the current–voltage (I–V) relationship for the peak current elicited with step depolarizations in this cell scaled to the amplitude of the ramp current. The filled squares show the peak_I–V_ data at full scale; only the foot of the curve can be seen at this scale. The ramp, which extended from −100 to +40 mV, was 600 msec long. The access resistance for this cell was 2 MΩ, and 80% series resistance compensation was used. B, Comparison of ramp currents in small DRG neurons that expressed predominantly TTX-S currents (n = 5) and in HEK293 cells expressing hNE channels (n = 9). The currents, elicited with 600 msec ramps that extended from −100 to +40 mV, were normalized for comparison of voltage dependence. The peak current–voltage curves (dotted and dashed lines) for the cells from which the ramp currents were recorded are also shown. Note that both the DRG TTX-S and the hNE ramp currents reach maximum amplitude ∼20 mV more negative than did the peak currents.
Similar articles
- Nav1.3 sodium channels: rapid repriming and slow closed-state inactivation display quantitative differences after expression in a mammalian cell line and in spinal sensory neurons.
Cummins TR, Aglieco F, Renganathan M, Herzog RI, Dib-Hajj SD, Waxman SG. Cummins TR, et al. J Neurosci. 2001 Aug 15;21(16):5952-61. doi: 10.1523/JNEUROSCI.21-16-05952.2001. J Neurosci. 2001. PMID: 11487618 Free PMC article. - Distinct repriming and closed-state inactivation kinetics of Nav1.6 and Nav1.7 sodium channels in mouse spinal sensory neurons.
Herzog RI, Cummins TR, Ghassemi F, Dib-Hajj SD, Waxman SG. Herzog RI, et al. J Physiol. 2003 Sep 15;551(Pt 3):741-50. doi: 10.1113/jphysiol.2003.047357. Epub 2003 Jul 3. J Physiol. 2003. PMID: 12843211 Free PMC article. - Analysis of the variation in use-dependent inactivation of high-threshold tetrodotoxin-resistant sodium currents recorded from rat sensory neurons.
Tripathi PK, Trujillo L, Cardenas CA, Cardenas CG, de Armendi AJ, Scroggs RS. Tripathi PK, et al. Neuroscience. 2006 Dec 28;143(4):923-38. doi: 10.1016/j.neuroscience.2006.08.052. Epub 2006 Oct 4. Neuroscience. 2006. PMID: 17027172 - Tetrodotoxin-resistant Na+ currents and inflammatory hyperalgesia.
Gold MS. Gold MS. Proc Natl Acad Sci U S A. 1999 Jul 6;96(14):7645-9. doi: 10.1073/pnas.96.14.7645. Proc Natl Acad Sci U S A. 1999. PMID: 10393874 Free PMC article. Review. - Sodium channels, the electrogenisome and the electrogenistat: lessons and questions from the clinic.
Waxman SG. Waxman SG. J Physiol. 2012 Jun 1;590(11):2601-12. doi: 10.1113/jphysiol.2012.228460. Epub 2012 Mar 12. J Physiol. 2012. PMID: 22411010 Free PMC article. Review.
Cited by
- Kilohertz waveforms optimized to produce closed-state Na+ channel inactivation eliminate onset response in nerve conduction block.
Yi G, Grill WM. Yi G, et al. PLoS Comput Biol. 2020 Jun 15;16(6):e1007766. doi: 10.1371/journal.pcbi.1007766. eCollection 2020 Jun. PLoS Comput Biol. 2020. PMID: 32542050 Free PMC article. - Molecular architecture of a sodium channel S6 helix: radial tuning of the voltage-gated sodium channel 1.7 activation gate.
Yang Y, Estacion M, Dib-Hajj SD, Waxman SG. Yang Y, et al. J Biol Chem. 2013 May 10;288(19):13741-7. doi: 10.1074/jbc.M113.462366. Epub 2013 Mar 27. J Biol Chem. 2013. PMID: 23536180 Free PMC article. - Ca2+ toxicity due to reverse Na+/Ca2+ exchange contributes to degeneration of neurites of DRG neurons induced by a neuropathy-associated Nav1.7 mutation.
Estacion M, Vohra BP, Liu S, Hoeijmakers J, Faber CG, Merkies IS, Lauria G, Black JA, Waxman SG. Estacion M, et al. J Neurophysiol. 2015 Sep;114(3):1554-64. doi: 10.1152/jn.00195.2015. Epub 2015 Jul 8. J Neurophysiol. 2015. PMID: 26156380 Free PMC article. - Mutations in sodium-channel gene SCN9A cause a spectrum of human genetic pain disorders.
Drenth JP, Waxman SG. Drenth JP, et al. J Clin Invest. 2007 Dec;117(12):3603-9. doi: 10.1172/JCI33297. J Clin Invest. 2007. PMID: 18060017 Free PMC article. Review. - Temperature dependence of erythromelalgia mutation L858F in sodium channel Nav1.7.
Han C, Lampert A, Rush AM, Dib-Hajj SD, Wang X, Yang Y, Waxman SG. Han C, et al. Mol Pain. 2007 Jan 19;3:3. doi: 10.1186/1744-8069-3-3. Mol Pain. 2007. PMID: 17239250 Free PMC article.
References
- Akopian AN, Sivilotti L, Wood JN. A tetrodotoxin-resistant voltage-gated sodium channel expressed by sensory neurons. Nature. 1996;379:257–262. - PubMed
- Aldrich RW, Corey DP, Stevens CF. A reinterpretation of mammalian sodium channel gating based on single channel recording. Nature. 1983;306:436–441. - PubMed
- Baker MD, Bostock H. Low-threshold persistent sodium current in rat large dorsal root ganglion neurons in culture. J Neurophysiol. 1997;77:1503–1513. - PubMed
Publication types
MeSH terms
Substances
LinkOut - more resources
Full Text Sources
Other Literature Sources
Miscellaneous


