Localization of cell division protein FtsQ by immunofluorescence microscopy in dividing and nondividing cells of Escherichia coli - PubMed (original) (raw)
Localization of cell division protein FtsQ by immunofluorescence microscopy in dividing and nondividing cells of Escherichia coli
N Buddelmeijer et al. J Bacteriol. 1998 Dec.
Abstract
The localization of cell division protein FtsQ in Escherichia coli wild-type cells was studied by immunofluorescence microscopy with specific monoclonal antibodies. FtsQ could be localized to the division site in constricting cells. FtsQ could also localize to the division site in ftsQ1(Ts) cells grown at the permissive temperature. A hybrid protein in which the cytoplasmic domain and the transmembrane domain were derived from the gamma form of penicillin-binding protein 1B and the periplasmic domain was derived from FtsQ was also able to localize to the division site. This result indicates that the periplasmic domain of FtsQ determines the localization of FtsQ, as has also been concluded by others for the periplasmic domain of FtsN. Noncentral FtsQ foci were found in the area of the cell where the nucleoid resides and were therefore assumed to represent sites where the FtsQ protein is synthesized and simultaneously inserted into the cytoplasmic membrane.
Figures
FIG. 1
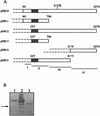
(A) β-Galactosidase–FtsQ fusion proteins with internal deletions produced by overexpression of the corresponding constructs described in Materials and Methods. The four different antigenic domains are designated I to IV. The dark-gray region at the amino terminus represents the membrane-spanning sequence of FtsQ. The β-galactosidase part of the fusion protein is indicated by dashed lines. The amino acid substitution at position 125 (E125K) in the ftsQ1(Ts) mutant is indicated. (B) Reactivity of MAb 1-F7 with β-galactosidase–FtsQ fusion proteins with internal deletions. Lane 1, β-galactosidase–FtsQM1-Q276 (pNB10); lane 2, β-galactosidase–FtsQG27-Q276 (pNB12); lane 3, β-galactosidase–FtsQE176-Q276 (pNB14). Similar results were obtained with MAb 2-H1 and MAb 6-H5. The arrow indicates the position of β-galactosidase. Total cell extracts were applied to the gel.
FIG. 2
Detection of wild-type FtsQ in membranes of wild-type cells (LMC500), ftsQ1(Ts) cells (LMC531), and _ftsQ_-depleted cells (VIP210) disrupted with a French press. (A) Lane 1, LMC500 grown at 28°C; lanes 2 to 4, LMC500 grown at 42°C for 5, 30, and 60 min, respectively; lane 5, LMC531 grown at 28°C; lane 6, LMC531 grown at 42°C for 15 min. Each lane contains 40 μg of protein of the membrane fraction. (B) Lane 1, VIP210 grown at 28°C; lanes 2 to 5, VIP210 grown at 42°C for one mass doubling, two mass doublings, three mass doublings, and four mass doublings, respectively. Each lane contains 10 μg of protein of the membrane fraction. The proteins were detected with a mixture of MAbs against FtsQ.
FIG. 3
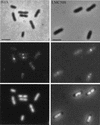
Localization of wild-type FtsQ by in situ immunofluorescence microscopy in B/rA (left) and LMC500 (right). The upper panels are phase-contrast images, the middle panels are immunofluorescence images, and the lower panels are DAPI images. Labeling was performed with a mixture of MAbs against FtsQ. Secondary antibodies were conjugated with Alexa. Scale bars, 2 μm.
FIG. 4
Localization of FtsQ in constricting cells of B/rA and LMC500. The upper panels are phase-contrast images, and the lower panels are immunofluorescence images. Labeling was performed with a mixture of MAbs against FtsQ. Secondary antibodies were conjugated with Alexa. The scale is identical to that used for Fig. 3.
FIG. 5
Position of FtsQ in B/rA cells (n = 1859) and LMC500 cells (n = 1308) with one or two foci depending on cell length. Dashed lines represent one-quarter and three-quarter positions in the cell, and the solid line represents cell length. Asymmetrically localized FtsQ foci in nonconstricting and constricting cells and foci at midcell in nonconstricting cells are indicated as open circles; FtsQ foci at midcell in constricting cells are indicated as filled squares.
FIG. 6
(A) Positions of FtsQ foci with relative positions between 0 and 0.45 (filled symbols) and between 0.55 and 1 (open symbols) in B/rA cells. Representative 1- and 3-μm cells are schematically drawn to scale. Regression lines with a significant coefficient were calculated. Relative positions of foci are plotted relative to cell length values and against cell length relative to midcell. For FtsQ foci with relative positions between 0 and 0.45, the equation of the regression line is y = 0.323 · x − 0.186 (r = 0.513). For FtsQ foci with relative positions between 0.55 and 1, the equation of the regression line is y = 0.301 · x − 0.137 (r = 0.440). (B) Positions of the nucleoid borders as a function of cell length in B/rA. The method described above was also used to determine the correlation between the positions of the nucleoid borders and cell length. The equations of the regression lines are y = 0.485 · x − 0.206 (r = 0.937) and y = 0.488 · x − 0.196 (r = 0.915). (C) Combination of the data from panels A and B.
FIG. 7
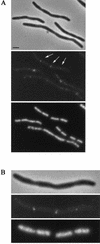
Labeling of FtsQ in the ftsQ1(Ts) mutant. (A) Filaments obtained after growth at the nonpermissive temperature for two mass doublings. The upper panels are phase-contrast images, the middle panels are immunofluorescence images, and the lower panels are DAPI images. Labeling was performed with a mixture of MAbs against FtsQ. Secondary antibodies were conjugated with Alexa. The arrows indicate fluorescent label at (potential) constriction sites. Scale bar, 2 μm. (B) Filament shown in more detail.
FIG. 8
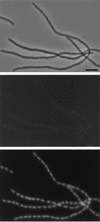
Labeling of FtsQ in the ftsQ depletion strain. Cells grown at the nonpermissive temperature for four mass doublings were labeled with a mixture of MAbs against FtsQ. Secondary antibodies were conjugated with Alexa. The upper panels are phase-contrast images, the middle panels are immunofluorescence images, and the lower panels are DAPI images. Scale bar, 4 μm.
FIG. 9
Localization of FtsQ in FtsQ-overproducing cells (left) and in PBP 1Bγ-FtsQ-overproducing cells (right). The upper panels are phase-contrast images, and the lower panels are immunofluorescence images. Labeling was performed with a mixture of MAbs against FtsQ. Secondary antibodies were conjugated with Alexa. Scale bar, 2 μm.
Similar articles
- Septal localization of FtsQ, an essential cell division protein in Escherichia coli.
Chen JC, Weiss DS, Ghigo JM, Beckwith J. Chen JC, et al. J Bacteriol. 1999 Jan;181(2):521-30. doi: 10.1128/JB.181.2.521-530.1999. J Bacteriol. 1999. PMID: 9882666 Free PMC article. - FtsN, a late recruit to the septum in Escherichia coli.
Addinall SG, Cao C, Lutkenhaus J. Addinall SG, et al. Mol Microbiol. 1997 Jul;25(2):303-9. doi: 10.1046/j.1365-2958.1997.4641833.x. Mol Microbiol. 1997. PMID: 9282742 - Domain-swapping analysis of FtsI, FtsL, and FtsQ, bitopic membrane proteins essential for cell division in Escherichia coli.
Guzman LM, Weiss DS, Beckwith J. Guzman LM, et al. J Bacteriol. 1997 Aug;179(16):5094-103. doi: 10.1128/jb.179.16.5094-5103.1997. J Bacteriol. 1997. PMID: 9260951 Free PMC article. - Super-resolution images of peptidoglycan remodelling enzymes at the division site of Escherichia coli.
Söderström B, Chan H, Daley DO. Söderström B, et al. Curr Genet. 2019 Feb;65(1):99-101. doi: 10.1007/s00294-018-0869-x. Epub 2018 Jul 28. Curr Genet. 2019. PMID: 30056491 Free PMC article. Review. - Morphogenesis of Escherichia coli.
Nanninga N. Nanninga N. Microbiol Mol Biol Rev. 1998 Mar;62(1):110-29. doi: 10.1128/MMBR.62.1.110-129.1998. Microbiol Mol Biol Rev. 1998. PMID: 9529889 Free PMC article. Review.
Cited by
- ZipA is required for recruitment of FtsK, FtsQ, FtsL, and FtsN to the septal ring in Escherichia coli.
Hale CA, de Boer PA. Hale CA, et al. J Bacteriol. 2002 May;184(9):2552-6. doi: 10.1128/JB.184.9.2552-2556.2002. J Bacteriol. 2002. PMID: 11948172 Free PMC article. - Molecular Cytology of 'Little Animals': Personal Recollections of Escherichia coli (and Bacillus subtilis).
Nanninga N. Nanninga N. Life (Basel). 2023 Aug 21;13(8):1782. doi: 10.3390/life13081782. Life (Basel). 2023. PMID: 37629639 Free PMC article. Review. - Fine-mapping the contact sites of the Escherichia coli cell division proteins FtsB and FtsL on the FtsQ protein.
van den Berg van Saparoea HB, Glas M, Vernooij IG, Bitter W, den Blaauwen T, Luirink J. van den Berg van Saparoea HB, et al. J Biol Chem. 2013 Aug 23;288(34):24340-50. doi: 10.1074/jbc.M113.485888. Epub 2013 Jul 11. J Biol Chem. 2013. PMID: 23846696 Free PMC article. - Legionella pneumophila cell surface RtxA release by LapD/LapG and its role in virulence.
Kanaan H, Chapalain A, Chokr A, Doublet P, Gilbert C. Kanaan H, et al. BMC Microbiol. 2024 Jul 19;24(1):266. doi: 10.1186/s12866-024-03395-1. BMC Microbiol. 2024. PMID: 39026145 Free PMC article. - Effects of calcium and calcium chelators on growth and morphology of Escherichia coli L-form NC-7.
Onoda T, Enokizono J, Kaya H, Oshima A, Freestone P, Norris V. Onoda T, et al. J Bacteriol. 2000 Mar;182(5):1419-22. doi: 10.1128/JB.182.5.1419-1422.2000. J Bacteriol. 2000. PMID: 10671467 Free PMC article.
References
- Addinal S G, Cao C, Lutkenhaus J. FtsN, a late recruit to the septum in Escherichia coli. Mol Microbiol. 1997;25:303–309. - PubMed
- Bi E, Lutkenhaus J. FtsZ ring structure associated with division in Escherichia coli. Nature. 1991;354:161–164. - PubMed
- Bowler L D, Spratt B G. Membrane topology of penicillin-binding protein 3 of Escherichia coli. Mol Microbiol. 1989;3:1277–1286. - PubMed
- Boyle D S, Khattar M M, Addinall S G, Lutkenhaus J, Donachie W D. ftsW is an essential cell-division gene in Escherichia coli. Mol Microbiol. 1997;24:1263–1273. - PubMed
Publication types
MeSH terms
Substances
LinkOut - more resources
Full Text Sources
Molecular Biology Databases


