Vav regulates peptide-specific apoptosis in thymocytes - PubMed (original) (raw)
Vav regulates peptide-specific apoptosis in thymocytes
Y Y Kong et al. J Exp Med. 1998.
Abstract
The protooncogene Vav functions as a GDP/GTP exchange factor (GEF) for Rho-like small GTPases involved in cytoskeletal reorganization and cytokine production in T cells. Gene-targeted mice lacking Vav have a severe defect in positive and negative selection of T cell antigen receptor transgenic thymocytes in vivo, and vav-/- thymocytes are completely resistant to peptide-specific and anti-CD3/anti-CD28-mediated apoptosis. Vav acts upstream of mitochondrial pore opening and caspase activation. Biochemically, Vav regulates peptide-specific Ca2+ mobilization and actin polymerization. Peptide-specific cell death was blocked both by cytochalasin D inhibition of actin polymerization and by inhibition of protein kinase C (PKC). Activation of PKC with phorbol ester restored peptide-specific apoptosis in vav-/- thymocytes. Vav was found to bind constitutively to PKC-theta in thymocytes. Our results indicate that peptide-triggered thymocyte apoptosis is mediated via Vav activation, changes in the actin cytoskeleton, and subsequent activation of a PKC isoform.
Figures
Figure 1
Impairment of positive and negative thymocyte selection in vav− /− mice. (A) Impaired positive selection in P14 Tg vav− /− mice. Non-Tg (top panels) and P14 TCR-α/β Tg (bottom panels) thymocytes were isolated from 6-wk-old H-2b/b vav +/− and vav− /− mice and stained with anti-CD4–PE and anti-CD8–FITC. Percentages of positive cells within quadrants are indicated. Total thymocyte numbers were as follows (mean values ± SD; n = 3; 6 wk of age): vav +/− non-Tg: 11.2 ± 2.5 × 10⁷; vav− /− non-Tg: 3.0 ± 0.6 × 10⁷; vav +/− P14 Tg: 12.0 ± 3.4 × 10⁷; vav− /− P14 Tg: 7.2 ± 0.6 × 10⁷. 1 result representative of 10 experiments is shown. (B) Impaired selection of the Tg H-Y TCR in vav− /− mice. Thymocytes were isolated from 5-wk-old positively selecting female (top panels) and negatively selecting male (bottom panels) H-2b/b H-Y TCR Tg mice and stained with anti-CD4–PE and anti-CD8–FITC. Percentages of positive cells within quadrants are indicated. One result representative of five experiments is shown. Total thymocyte numbers were as follows (mean values ± SD; n = 3; 6 wk of age): vav +/− female: 19.6 ± 3.3 × 10⁷; vav− /− female: 7.5 ± 0.9 × 10⁷; vav +/− male: 3.6 ± 0.8 × 10⁷; vav− /− male: 13.2 ± 2.6 × 10⁷. (C) Phenotype of CD4+CD8+ thymocytes. Thymocytes were isolated from P14 Tg vav− /−, P14 Tg vav +/−, and P14 Tg vav +/+ β2m− /− mice and triple stained using anti-CD4 (PE), anti-CD8 (FITC), and a third biotinylated Ab reactive to TCRVβ8, TCRVα2, CD28, CD69, CD5, or HSA. Histograms are shown for the indicated surface markers (solid lines) on gated CD4+CD8+ thymocytes. Broken lines, background staining using unspecific Abs. One result representative of three experiments is shown.
Figure 2
Vav regulates peptide-specific apoptosis of P14 TCR Tg thymocytes. P14 Tg thymocytes were purified from vav +/− (A), vav− /− (B), and vav +/+ β2m− /− mice and cultured on EL4 (H-2Db) APCs pulsed with the indicated concentrations of p33 or 8.1 peptides. Cells were harvested after 22 h of culture, and cell death was determined by FACS® staining using anti-CD4–PE, anti-CD8–FITC, and a vital dye, either 7-AAD or annexin V. Percent survival was determined from the number of viable CD4+CD8+ thymocytes remaining after culture in a given concentration of p33 or 8.1 peptide compared with the number of control thymocytes remaining after culture in an equal concentration of the control peptide AV. The AV peptide has high affinity for H-2Db but very low affinity for the P14 TCR. Peptide concentrations on the x-axis indicate a range of 10−6 to 10−11 M. One result representative of five experiments is shown.
Figure 3
vav− /− thymocytes are resistant to anti-CD3/anti-CD28–mediated apoptosis. Cell death was induced in vav +/− and vav− /− thymocytes by treatment with anti-CD3ε, anti-CD3ε plus anti-CD28, anti-CD95 (FAS), or PMA plus Ca2+ ionophore. Percentage of viable CD4+CD8+ thymocytes remaining after treatment is indicated on the y-axis. The mean result of a triplicate culture (±SD) representative of three independent experiments is shown for each activation.
Figure 4
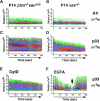
Vav acts upstream of the mitochondrial permeability transition (Δψm disruption). (A–D) Disruption of Δψm was determined by a reduction in the fluorescence intensity of the mitochondrial matrix chromogen DiOC6(3). Representative histograms of the changes in mitochondrial DiOC6(3) fluorescence intensity are shown for thymocytes of vav +/− (A and C) and vav− /− (B and D) mice treated with the control AV peptide (A and B) and the deleting p33 peptide (C and D). EL4 APCs were loaded with 10−6 M AV or p33 peptide, washed, and subsequently cultured with vav +/− and vav− /− thymocytes for 16 h. One result representative of three independent experiments is shown. (E) Dose–response curve of Δψm disruption. Percent change in Δψm intensity in vav +/− and vav− /− thymocytes treated with different concentrations of deleting p33 peptide or control AV peptide is shown. EL4 APCs were loaded with the indicated concentration of AV or p33 peptide, washed, and subsequently cultured with vav +/− and vav− /− thymocytes for 10 h. One result representative of three independent experiments is shown.
Figure 5
Vav is required for peptide-specific Ca2+ mobilization. (A–D) Ca2+ flux in freshly isolated P14 thymocytes from β2m− /− vav +/+ (A and C) and vav− /− (B and D) mice. X-axis: real time Ca2+ release in seconds; y-axis: intensity of increase of intracellular Ca2+ in P14 thymocytes after incubation with EL4 APCs loaded with 10−9 M AV (A and B) or p33 (C and D) peptide. The Ca2+ flux in β2m− /− vav +/+ P14 thymocytes was similar in intensity and kinetics to that in vav +/+ or vav +/− P14 thymocytes (not shown). Similar results were obtained in vav +/− and vav− /− P14 thymocytes using higher concentrations (10−8, 10−7, 10−6, and 10−5 M) of p33 and AV peptides (not shown), meaning that higher peptide concentrations did not significantly increase the Ca2+ responses detected in β2m− /− vav +/+, vav +/−, or vav− /− P14 thymocytes. One experiment representative of four independent experiments is shown. (E and F) Effect of CytD and EGTA on Ca2+ flux in freshly isolated β2m− /− vav +/+ P14 thymocytes. Ca2+ flux was decreased when p33-loaded (10−9 M) EL4 APCs were pretreated 15 min before activation with CytD (E). A similar decrease occurred when EGTA (2.5 μM) was added to the cells to block flux by transmembrane Ca2+ channels (F). As a control for loading, addition of CaCl2 into the medium (F, arrow) restored Ca2+ flux in EGTA-treated cells.
Figure 6
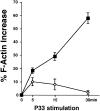
Impaired peptide-specific actin polymerization (F-actin formation) in P14 vav− /− thymocytes. Thymocytes from P14 vav− /− (diamonds) and vav +/− (squares) littermates were isolated and activated with EL4 APCs loaded with the deleting p33 peptide (10−6 M) or the control AV peptide (10−6 M) for the indicated time periods. Percentage of actin polymerization (mean percent increase in F-actin ± SD) is shown on the y-axis. Values were calculated as described in Materials and Methods. The x-axis shows the kinetics of induction in minutes after p33 stimulation. One result representative of three independent experiments is shown.
Figure 7
Inhibition of actin polymerization blocks peptide-specific thymocyte apoptosis. (A) The actin polymerization inhibitor CytD blocks peptide-specific apoptosis of P14 TCR Tg vav +/+ thymocytes induced by different concentrations of the high-affinity p33 peptide. The percentage of viable CD4+CD8+ cells remaining after treatment is shown on the y-axis. Peptide concentrations are indicated on the x-axis and range from 10−6 to 10−9 M. The concentrations of CytD used to inhibit thymocyte apoptosis are indicated. (B) Dose– response curve of CytD inhibition of peptide-specific apoptosis of P14 Tg vav +/+ thymocytes. Percent inhibition of apoptosis is shown on the y-axis. The concentration of the deleting p33 or control AV peptide was 10−9 M. Apoptosis of CD4+CD8+ thymocytes was detected as described in Materials and Methods. One result representative of six experiments is shown.
Figure 8
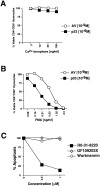
PKC activation can restore peptide-specific apoptosis of P14 vav− /− thymocytes. (A and B) The specific PKC activator PMA, but not Ca2+ ionophore, can rescue peptide-specific apoptosis of vav− /_−_thymocytes. P14 vav− /− thymocytes (2 × 10⁶/well) were incubated with EL4 APCs loaded with 10−9 M AV or p33 peptide plus varying concentrations of the Ca2+ ionophore A23617 (A) or PMA (B). Higher concentrations of the Ca2+ ionophore A23617 plus p33 peptide also failed to trigger apoptosis (not shown). Viability of CD4+CD8+ thymocytes was assessed 16 h after activation as described in Materials and Methods. It should be noted that PMA alone induced apoptosis of CD4+CD8+ vav− /− thymocytes (not shown). One result representative of three independent experiments is shown. (C) Inhibition of p33 peptide–mediated apoptosis of P14 TCR Tg vav +/+ thymocytes by the global PKC inhibitor RO-31-8220. Apoptosis was induced by treatment with 10−9 M p33 peptide in the presence of the global PKC blocker RO-31-8220, GF109203X (which only inhibits the activity of the Ca2+-dependent PKC-α, -β, and -γ isoforms), or Wortmannin (a specific PI3′K blocker). The percentage of apoptotic cells is shown on the y-axis. Concentrations of pharmacological inhibitors are shown on the x-axis (μM). Similar results were obtained using different concentrations of p33 peptide or higher concentrations of the inhibitors (not shown). One result representative of five different experiments is shown. (D and E) Inhibition of p33 peptide– mediated or PMA-mediated apoptosis of P14 TCR Tg vav +/+ thymocytes by kinase or actin polymerization blockers. (D) Thymocytes were treated with p33 peptide (10−9M) in the absence or presence of RO-31-8220 (RO, 1 μM), the actin polymerization blocker CytD (2.5 μM), or Wortmannin (WT, 1 μM). (E) Thymocytes were treated with PMA (12.5 nM) in the absence or presence of RO-31-8220, CytD, or Wortmannin at the concentrations described for D. Unstimulated thymocytes served as controls for both D and E. Results for D and E are shown as mean percent viable CD4+CD8+ cells ± SD. Percentage of apoptosis was determined as described in Materials and Methods. One result representative of three different experiments is shown.
Figure 9
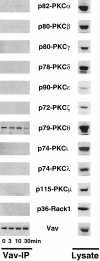
Vav binds constitutively to PKC-θ. Thymocytes (107 cells/ lane) were activated with anti-CD3ε (1 μg/ml) for the indicated time points. After activation, Vav was immunoprecipitated from lysates and the complexes were Western blotted to detect the presence of different PKC isoforms and Vav (Vav-IP; left). Right panels (Lysate) show the relative protein levels of Vav and different PKC isoforms in total thymocyte lysates (2 × 10⁶ cells/lane). PKC-η and -κ were not tested. The molecular weights of the PKC isoforms are indicated.
Similar articles
- The calcium-independent protein kinase C participates in an early process of CD3/CD28-mediated induction of thymocyte apoptosis.
Asada A, Zhao Y, Komano H, Kuwata T, Mukai M, Fujita K, Tozawa Y, Iseki R, Tian H, Sato K, Motegi Y, Suzuki R, Yokoyama M, Iwata M. Asada A, et al. Immunology. 2000 Nov;101(3):309-15. doi: 10.1046/j.1365-2567.2000.00110.x. Immunology. 2000. PMID: 11106933 Free PMC article. - Vav is a regulator of cytoskeletal reorganization mediated by the T-cell receptor.
Fischer KD, Kong YY, Nishina H, Tedford K, Marengère LE, Kozieradzki I, Sasaki T, Starr M, Chan G, Gardener S, Nghiem MP, Bouchard D, Barbacid M, Bernstein A, Penninger JM. Fischer KD, et al. Curr Biol. 1998 May 7;8(10):554-62. doi: 10.1016/s0960-9822(98)70224-6. Curr Biol. 1998. PMID: 9601639 - Vav synergizes with protein kinase C theta to mediate IL-4 gene expression in response to CD28 costimulation in T cells.
Hehner SP, Li-Weber M, Giaisi M, Dröge W, Krammer PH, Schmitz ML. Hehner SP, et al. J Immunol. 2000 Apr 1;164(7):3829-36. doi: 10.4049/jimmunol.164.7.3829. J Immunol. 2000. PMID: 10725744 - [The role of vav protein in TCR-mediated signaling with MHC/peptide complexes leading to positive or negative selection of thymocytes].
Matuszyk J, Kałas W, Kozicki R, Strzadała L. Matuszyk J, et al. Postepy Hig Med Dosw. 1999;53(4):531-43. Postepy Hig Med Dosw. 1999. PMID: 10544657 Review. Polish. - Vav links antigen-receptor signaling to the actin cytoskeleton.
Fischer KD, Tedford K, Penninger JM. Fischer KD, et al. Semin Immunol. 1998 Aug;10(4):317-27. doi: 10.1006/smim.1998.0124. Semin Immunol. 1998. PMID: 9695188 Review.
Cited by
- Vav1 fine tunes p53 control of apoptosis versus proliferation in breast cancer.
Sebban S, Farago M, Gashai D, Ilan L, Pikarsky E, Ben-Porath I, Katzav S. Sebban S, et al. PLoS One. 2013;8(1):e54321. doi: 10.1371/journal.pone.0054321. Epub 2013 Jan 14. PLoS One. 2013. PMID: 23342133 Free PMC article. - The Novel PKCθ from Benchtop to Clinic.
Hage-Sleiman R, Hamze AB, Reslan L, Kobeissy H, Dbaibo G. Hage-Sleiman R, et al. J Immunol Res. 2015;2015:348798. doi: 10.1155/2015/348798. Epub 2015 May 19. J Immunol Res. 2015. PMID: 26090489 Free PMC article. Review. - The regulation of DNAse activities in subcellular compartments of activated thymocytes.
Nagata T, Kishi H, Liu QL, Matsuda T, Imanaka T, Tsukada K, Kang D, Muraguchi A. Nagata T, et al. Immunology. 2002 Apr;105(4):399-406. doi: 10.1046/j.1365-2567.2002.01347.x. Immunology. 2002. PMID: 11985660 Free PMC article. - Essential role of PI3Kdelta and PI3Kgamma in thymocyte survival.
Swat W, Montgrain V, Doggett TA, Douangpanya J, Puri K, Vermi W, Diacovo TG. Swat W, et al. Blood. 2006 Mar 15;107(6):2415-22. doi: 10.1182/blood-2005-08-3300. Epub 2005 Nov 22. Blood. 2006. PMID: 16304053 Free PMC article. - Acute endotoxin-induced thymic atrophy is characterized by intrathymic inflammatory and wound healing responses.
Billard MJ, Gruver AL, Sempowski GD. Billard MJ, et al. PLoS One. 2011 Mar 18;6(3):e17940. doi: 10.1371/journal.pone.0017940. PLoS One. 2011. PMID: 21437240 Free PMC article.
References
- Collins TL, Deckert M, Altman A. Views on Vav. Immunol Today. 1997;18:221–225. - PubMed
- Bustelo XR, Ledbetter JA, Barbacid M. Product of vav proto-oncogene defines a new class of tyrosine protein kinase substrates. Nature. 1992;356:68–71. - PubMed
- Margolis B, Hu P, Katzav S, Li W, Oliver JM, Ullrich A, Weiss A, Schlessinger J. Tyrosine phosphorylation of vav proto-oncogene product containing SH2 domain and transcription factor motifs. Nature. 1992;356:71–74. - PubMed
- Teramoto H, Crespo P, Coso OA, Igishi T, Xu NZ, Gutkind JS. The small GTP-binding protein rho activates c-Jun N-terminal kinases/stress-activated protein kinases in human kidney 293T cells. Evidence for a Pak-independent signaling pathway. J BiolChem. 1996;271:25731–25734. - PubMed
Publication types
MeSH terms
Substances
LinkOut - more resources
Full Text Sources
Other Literature Sources
Molecular Biology Databases
Miscellaneous


