Kinetic analysis of secretory protein traffic and characterization of golgi to plasma membrane transport intermediates in living cells - PubMed (original) (raw)
Kinetic analysis of secretory protein traffic and characterization of golgi to plasma membrane transport intermediates in living cells
K Hirschberg et al. J Cell Biol. 1998.
Abstract
Quantitative time-lapse imaging data of single cells expressing the transmembrane protein, vesicular stomatitis virus ts045 G protein fused to green fluorescent protein (VSVG-GFP), were used for kinetic modeling of protein traffic through the various compartments of the secretory pathway. A series of first order rate laws was sufficient to accurately describe VSVG-GFP transport, and provided compartment residence times and rate constants for transport into and out of the Golgi complex and delivery to the plasma membrane. For ER to Golgi transport the mean rate constant (i.e., the fraction of VSVG-GFP moved per unit of time) was 2.8% per min, for Golgi to plasma membrane transport it was 3.0% per min, and for transport from the plasma membrane to a degradative site it was 0.25% per min. Because these rate constants did not change as the concentration of VSVG-GFP in different compartments went from high (early in the experiment) to low (late in the experiment), secretory transport machinery was never saturated during the experiments. The processes of budding, translocation, and fusion of post-Golgi transport intermediates carrying VSVG- GFP to the plasma membrane were also analyzed using quantitative imaging techniques. Large pleiomorphic tubular structures, rather than small vesicles, were found to be the primary vehicles for Golgi to plasma membrane transport of VSVG-GFP. These structures budded as entire domains from the Golgi complex and underwent dynamic shape changes as they moved along microtubule tracks to the cell periphery. They carried up to 10,000 VSVG-GFP molecules and had a mean life time in COS cells of 3.8 min. In addition, they fused with the plasma membrane without intersecting other membrane transport pathways in the cell. These properties suggest that the post-Golgi intermediates represent a unique transport organelle for conveying large quantities of protein cargo from the Golgi complex directly to the plasma membrane.
Figures
Figure 1
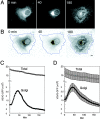
Kinetics of VSVG– GFP transport. (A) VSVG– GFP expressing cells were incubated for 20 h at 40°C, shifted to 32°C, and then imaged every 30 s for 3 h using a confocal microscope. Shown are images at 0, 40, and 180 min after temperature shift. See Quicktime movie sequence at
. nih.gov/
cbmb/pb7labob.html
. The waves of VSVG–GFP seen propagating out from the Golgi region 60 min after temperature shift in the movie represent plasma membrane ruffling, possibly in response to the arrival at the cell surface of VSVG–GFP. (B) ROIs used for quantitative analysis of transport. Blue line, total cell fluorescence; yellow line, Golgi fluorescence. The images are inverted to better reveal the ROI. (C) Fluorescent intensities associated with the Golgi ROI (Golgi, solid circles) and entire cell ROI (Total, open circles) for one representative cell after shift to 32°C are plotted at 30 s intervals for 3 h. Fluorescence intensity is expressed as number of molecules based on a comparison of cellular VSVG–GFP fluorescence with known concentrations of GFP as described in Materials and Methods. (D) Distribution of VSVG– GFP molecules associated with the Golgi area and total cell for nine cells after shift to 32°C. Bar, 5 μm.
Figure 2
Kinetic modeling of VSVG–GFP transport through the secretory pathway. (A) The three compartment model for trafficking of VSVG–GFP. (B) VSVG-GFP–expressing cells incubated for 20 h at 40°C were shifted to 32°C and imaged every 120 s for 10 h. The fluorescent intensities with time within the Golgi ROI (solid circles) and total cell ROI (open circles) are plotted. The smooth curves show fit by the model solution. (C) VSVG–GFP levels in each of the three model compartments over time as calculated by the fit shown in B. (D) Sensitivity of fits to changes in rate constants. Red curves, the data when K ER is increased by a factor of 1.8 and other parameters are allowed to readjust. Blue curves, K G increased by a factor of 1.8 and other parameters are allowed to readjust. Black lines, optimized fit to data. (E) VSVG–GFP fluxes out of each compartment as a function of time after a shift to 32°C.
Figure 3
Effect of pharmacologic reagents on VSVG– GFP trafficking kinetics. (A) VSVG-GFP–expressing cells were incubated for 20 h at 40°C and shifted to 32°C in the presence of cytochalasin-B (10 μM). Relative fluorescent intensities in the Golgi ROI (solid circles) and total cell ROI (open circles) with time are plotted. The smooth curves represent the optimized fit to the three-compartment model B. Levels of VSVG–GFP in each of the three compartments with time calculated by the model solution to the data shown in A for a cyto B–treated cell (dashed lines) and an untreated cell (solid lines). (C) Cells expressing VSVG–GFP were shifted to 32°C. AlF (AlCl3, 60 μM and NaF, 20 mM) or nocodazole (33.3 μM) was added after 40 min at 32°C. The images were collected at this time (40 min) or 140 min later (180 min). (D) Fluorescent intensities associated with the Golgi region in the experiment described in C are plotted against time. Bar, 10 μm.
Figure 7
Quantitation of fluorescence intensity in post Golgi intermediates. (A) Upper and lower non-Golgi regions (white rectangles) of a cell expressing VSVG–GFP were repetitively photobleached using high energy illumination 40 min after a shift to 32°C. The entire cell was then imaged with low illumination levels for 36 min at 3.4 images/min. See Quicktime movie sequence at
http://dir.nichd.nih.gov/cbmb/pb7labob.html
. The ROI that was analyzed is shown in the far right panel. (B) The representative ROI at different times after photobleaching. Bottom panel is an overlay of all the images taken during the 36 min after photobleaching. Note the many paths followed by individual PGCs to the plasma membrane. (C) The compartmental model used to determine the fraction of VSVG–GFP conveyed to the PM in PGCs (Materials and Methods). (D) The fluorescent intensity in PGCs (defined as structures larger than 0.2 μm2 or five pixels) (solid circles) and the total fluorescence (i.e., the sum of fluorescence intensity in PGCs, PM, and all other fluorescence; open circles) within the ROIs are plotted against time. The optimal model solution generated by the model in C is shown by solid lines (Materials and Methods). The rate constants obtained by least squares fitting were 1.94 ± 0.47 (SD)% per min for the Golgi-to-PGC pathway and 1.22 ± 0.32 (SD)% per min for the Golgi-to-other pathway. Given this model structure, the data also permitted resolution of the VSVG–GFP residence time in measured PGCs (3.38 ± 0.26 [SD] min), but could not resolve the VSVG–GFP residence time in carriers associated with the “other” pathway. Optimization required that the residence time in the “other” pathway was no more than 0.2 min.
Figure 4
Budding of post-Golgi carriers from the Golgi complex. (A) Cells expressing VSVG–GFP at 40°C were shifted to 32°C. The sequence shows the Golgi region after 50 min at 32°C. The images were taken at 2.6-s intervals with a narrow pinhole. Inverted images are displayed at the indicated time intervals. Arrows, tubule budding off from the Golgi body and its tip region detaching. See Quicktime movie sequence at
http://dir.nichd.nih.gov/cbmb/pb7labob.html
. (B) Comparison of the distribution of VSVG–GFP with Golgi resident proteins. After 50 min at 32°C, VSVG-GFP–expressing cells were fixed (2% formaldehyde), permeabilized, and then stained with antibodies to βCOP, GM-130, or AP-1. The distribution of furin was examined in VSVG-GFP–expressing cells cotransfected with HA-tagged furin (Bosshart et al., 1994) and stained with HA antibodies. Short arrows, tubular structures containing VSVG–GFP that are connected or adjacent to the Golgi complex and are not labeled with antibodies. Long arrows, tubules containing furin but not VSVG– GFP. (C) A schematic model depicting sorting of VSVG–GFP into discrete membrane domains (green) of the TGN (red) that bud and elongate into tubules before detaching from the Golgi complex. Bars: (A) 5 μm; (B) 2.5 μm.
Figure 5
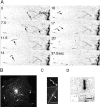
Structure and dynamics of post-Golgi carriers. (A) Inverted images of a VSVG-GFP–expressing cell 50 min after shift from 40° to 32°C. Images were captured every 2 s at high magnification using a confocal microscope. Short arrow, tubule bifurcating. Long arrows, PGC extending and retracting during translocation. Arrowheads, PGC breaking in half. See Quicktime movie sequence at
. nih.gov/cbmb/pb7labob. html. (B) A digital confocal image of a cell expressing VSVG– GFP ∼70 min after a shift to 32°C. Arrows, PGCs. (C) Images of PGCs taken with a confocal (top) or SIT video (bottom) microscope. Arrows, varicosities within tubules. (D) An enlarged image of a PGC taken with a confocal microscope. Pixels are 0.2 × 0.2 μm. The insert shows 0.1-μm-diam fluorescent beads collected under identical imaging conditions to demonstrate the resolution of the confocal microscope and the size difference of PGCs versus 100-nm structures. Bars: (A and D) 2 μm; (B and C) 5 μm.
Figure 6
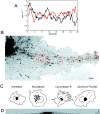
Translocation of PGCs. (A) Velocity of two PGCs (red and black). Images were collected with a SIT camera at a rate of 8 images/s and the velocity measured as the distance between the pixel coordinates in consecutive images. The graph shows a trend line of a rolling average along 2-s steps (every data point is an average of 16 samplings). (B) The route of a single PGC to the cell periphery. Confocal images of a VSVG–GFP expressing cell 60 min after temperature shift from 40° to 32°C. Eight images at 10-s intervals were overlaid. Boxed areas, movement of one PGC. See Quicktime movie sequence at
. nih.gov/
cbmb/pb7labob.html
. (C) Camera lucid pictures showing pathway (red arrows) of VSVG-GFP–containing PGCs within an 8-min period imaged with a confocal microscope 60 min after shift to 32°C in untreated cells and cells treated with nocodazole, cyto B, or aluminum fluoride. Cells were treated with nocodazole (33.3 μM) on ice for 10 min to ensure microtubule depolymerization at 60 min after shift to 32°C and then returned to 32°C for imaging. Cyto B (10 μM) was added at the time of temperature shift from 40° to 32°C. AlF (AlCl3 60 μM and NaF 20 mM) was added 60 min after a shift to 32°C. (D) A 90° cross-section of a cell 40 min after shift to 32°C. Image was reconstructed from 30 sections 0.2-μm apart using a confocal microscope. Bars, 5 μm.
Figure 8
Fusion and dispersion of VSVG–GFP at the plasma membrane. (A) Inverted images of VSVG-GFP–expressing cell collected with a SIT video camera at a rate of 8 images/s ∼50 min after shift from 40° to 32°C. The sequence shows fusion of a PGC (black arrows) with the plasma membrane. A different PGC (white arrows) did not fuse or go out of the plane of focus during this time period. See Quicktime movie sequence at
http://dir.nichd.nih.gov/cbmb/pb7labob.html
. (B) Change in intensity of PGC during fusion with the plasma membrane reveals rapid dispersion of VSVG–GFP in the plasma membrane. Black and white circles are the intensities of the fusing and reference PGCs that are indicated by the black and white arrows in A. (C) Fusion of PGC with the plasma membrane and dispersion of its VSVG–GFP cargo observed with a confocal microscope. Bars: (A) 1 μm; (B) 5 μm.
Similar articles
- ER-to-Golgi transport visualized in living cells.
Presley JF, Cole NB, Schroer TA, Hirschberg K, Zaal KJ, Lippincott-Schwartz J. Presley JF, et al. Nature. 1997 Sep 4;389(6646):81-5. doi: 10.1038/38001. Nature. 1997. PMID: 9288971 - Recycling of golgi-resident glycosyltransferases through the ER reveals a novel pathway and provides an explanation for nocodazole-induced Golgi scattering.
Storrie B, White J, Röttger S, Stelzer EH, Suganuma T, Nilsson T. Storrie B, et al. J Cell Biol. 1998 Dec 14;143(6):1505-21. doi: 10.1083/jcb.143.6.1505. J Cell Biol. 1998. PMID: 9852147 Free PMC article. - Cholesterol loading induces a block in the exit of VSVG from the TGN.
Ying M, Grimmer S, Iversen TG, Van Deurs B, Sandvig K. Ying M, et al. Traffic. 2003 Nov;4(11):772-84. doi: 10.1034/j.1600-0854.2003.00134.x. Traffic. 2003. PMID: 14617359 - Unravelling Golgi membrane traffic with green fluorescent protein chimeras.
Lippincott-Schwartz J, Cole N, Presley J. Lippincott-Schwartz J, et al. Trends Cell Biol. 1998 Jan;8(1):16-20. doi: 10.1016/s0962-8924(97)01199-9. Trends Cell Biol. 1998. PMID: 9695802 Review. - Illuminating the secretory pathway: when do we need vesicles?
Stephens DJ, Pepperkok R. Stephens DJ, et al. J Cell Sci. 2001 Mar;114(Pt 6):1053-9. doi: 10.1242/jcs.114.6.1053. J Cell Sci. 2001. PMID: 11228150 Review.
Cited by
- COPII collar defines the boundary between ER and ER exit site and does not coat cargo containers.
Shomron O, Nevo-Yassaf I, Aviad T, Yaffe Y, Zahavi EE, Dukhovny A, Perlson E, Brodsky I, Yeheskel A, Pasmanik-Chor M, Mironov A, Beznoussenko GV, Mironov AA, Sklan EH, Patterson GH, Yonemura Y, Sannai M, Kaether C, Hirschberg K. Shomron O, et al. J Cell Biol. 2021 Jun 7;220(6):e201907224. doi: 10.1083/jcb.201907224. J Cell Biol. 2021. PMID: 33852719 Free PMC article. - Mechanisms of eosinophil secretion: large vesiculotubular carriers mediate transport and release of granule-derived cytokines and other proteins.
Melo RC, Spencer LA, Dvorak AM, Weller PF. Melo RC, et al. J Leukoc Biol. 2008 Feb;83(2):229-36. doi: 10.1189/jlb.0707503. Epub 2007 Sep 17. J Leukoc Biol. 2008. PMID: 17875811 Free PMC article. Review. - A conserved motif in the membrane proximal C-terminal tail of human muscarinic m1 acetylcholine receptors affects plasma membrane expression.
Sawyer GW, Ehlert FJ, Shults CA. Sawyer GW, et al. J Pharmacol Exp Ther. 2010 Jan;332(1):76-86. doi: 10.1124/jpet.109.160986. Epub 2009 Oct 19. J Pharmacol Exp Ther. 2010. PMID: 19841475 Free PMC article. - Morphology and dynamics of clathrin/GGA1-coated carriers budding from the trans-Golgi network.
Puertollano R, van der Wel NN, Greene LE, Eisenberg E, Peters PJ, Bonifacino JS. Puertollano R, et al. Mol Biol Cell. 2003 Apr;14(4):1545-57. doi: 10.1091/mbc.02-07-0109. Mol Biol Cell. 2003. PMID: 12686608 Free PMC article. - The golgi-associated COPI-coated buds and vesicles contain beta/gamma -actin.
Valderrama F, Luna A, Babía T, Martinez-Menárguez JA, Ballesta J, Barth H, Chaponnier C, Renau-Piqueras J, Egea G. Valderrama F, et al. Proc Natl Acad Sci U S A. 2000 Feb 15;97(4):1560-5. doi: 10.1073/pnas.97.4.1560. Proc Natl Acad Sci U S A. 2000. PMID: 10677499 Free PMC article.
References
- Alberts, B., D. Bray, J. Lewis, M. Raff, K. Roberts, and J. Watson. 1994. Molecular Biology of the Cell. Garland Publishing Inc., New York. 478–505.
- Arnheiter H, Dubois-Dalcq M, Lazzarini RA. Direct visualization of protein transport and processing in the living cell by microinjection of specific antibodies. Cell. 1984;39:99–109. - PubMed
- Balch WE, McCaffery JM, Plutner H, Farquhar MG. Vesicular stomatitis virus glycoprotein is sorted and concentrated during export from the endoplasmic reticulum. Cell. 1994;76:841–852. - PubMed
- Barr FA, Leyte A, Mollner S, Pfeuffer T, Tooze SA, Huttner WB. Trimeric G-proteins of the trans-Golgi network are involved in the formation of constitutive secretory vesicles and immature secretory granules. FEBS (Fed Eur Biochem Soc) Lett. 1991;294:239–243. - PubMed
- Bell BM, Burke JV, Schumitzky A. A relative weighting method for estimating parameters and variances in multiple data sets. Computational Statistics and Data Analysis. 1996;22:119–135.
Publication types
MeSH terms
Substances
LinkOut - more resources
Full Text Sources
Other Literature Sources


