Two distinct gamma interferon-inducible promoters of the major histocompatibility complex class II transactivator gene are differentially regulated by STAT1, interferon regulatory factor 1, and transforming growth factor beta - PubMed (original) (raw)
Two distinct gamma interferon-inducible promoters of the major histocompatibility complex class II transactivator gene are differentially regulated by STAT1, interferon regulatory factor 1, and transforming growth factor beta
J F Piskurich et al. Mol Cell Biol. 1999 Jan.
Abstract
The major histocompatibility complex (MHC) class II transactivator (CIITA) is the master regulatory factor required for appropriate expression of class II MHC genes. Understanding the expression of CIITA is key to understanding the regulation of class II MHC genes. This report describes the independent regulation of two distinct CIITA promoters by cytokines with opposing functions, gamma interferon (IFN-gamma) and transforming growth factor beta (TGF-beta). A functional analysis of deletion mutations of the upstream promoter (promoter III) identified an IFN-gamma-responsive region located approximately 5 kb from the transcriptional start site. An in vivo DNase I hypersensitivity analysis detected a hypersensitive site in this area which supports the relevance of this region. When the downstream promoter (promoter IV) was studied by in vivo genomic footprinting, IFN-gamma-induced changes at putative binding sites for STAT1, interferon regulatory factor 1 (IRF-1), and E-box proteins were seen. Gel shift and supershift analyses for IRF-1 confirmed the in vivo footprint results. The role of the IFN-gamma-inducible transcription factor STAT1 was examined functionally. Although both promoters were controlled by STAT1, promoter-specific regulation was exhibited. The IFN-gamma response of promoter III was completely dependent on STAT1 and not IRF-1, while promoter IV was partially activated by IRF-1 in the total absence of STAT1 expression. While both promoters were affected by TGF-beta, activation of promoter III by IFN-gamma was more severely diminished by TGF-beta treatment. The differential control of CIITA promoters by TGF-beta, IRF-1, and STAT1 may be important in refining regulation of class II MHC genes in different cell types and under different stimulatory conditions.
Figures
FIG. 1
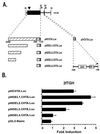
(A) Map of the 14-kb human CIITA gene fragment that contains both IFN-γ-inducible promoters of the CIITA gene. The locations of the transcriptional start sites of the upstream IFN-γ-responsive promoter (promoter III) and the downstream promoter (promoter IV) are shown by arrows. The location of the DNase I-hypersensitive site that lies approximately 6 kb upstream of the start site of promoter III is marked with an arrowhead. Locations of the DNA fragments used in reporter constructs described in this report are given (black boxes). Gray boxes indicate the 5′ untranslated regions in promoter III and IV constructs. A horizontally hatched box denotes the location of the 668-bp region previously shown to be required for constitutive basal promoter III activity in B cells (41). Regions that confer IFN-γ inducibility are indicated by diagonally and vertically hatched boxes for promoter III and promoter IV, respectively. Open boxes show the locations of the STAT1 (GAS) and IRF-1 consensus binding motifs in promoter IV. H, _Hin_dIII. (B) Deletion mutants that contain DNA sequences located distant to promoter III of CIITA confer IFN-γ inducibility in 2fTGH cells. Transient transfections of 2fTGH cells were performed by calcium phosphate coprecipitation. After 6 h, precipitates were removed and culture medium was added with or without 500 U of IFN-γ/ml. Cells were harvested for luciferase assays 14 h later. Luciferase activity was measured in RLU per microgram of protein. Fold induction after IFN-γ treatment was calculated by dividing the RLU of IFN-γ-treated samples by the RLU of untreated samples. Data shown are the averages of three independent experiments. Error bars represent standard errors of the means.
FIG. 2
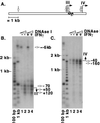
DNase I hypersensitivity analyses reveal hypersensitive sites in the proximal promoters of both promoters III and IV and an additional long-range hypersensitive site for promoter III. (A) Summary of hypersensitivity analysis and graphic representation of the CIITA genomic region showing the location of the primers and probe that were used for detection. The hatched region represents the probe used for Southern blot hybridization. The small arrows above (primer 104CIITA) and below (primer CIITAint) the hatched region indicate the locations of the primers used for the PCR. (B) Southern blot analysis of PCR-amplified products using primer CIITAint to detect promoter III-associated hypersensitive sites. The start site of the promoter is designated by a filled arrow to the right of the panel. Estimated positions of the hypersensitive sites are indicated with open arrows. Lanes 1 and 2 represent results for uninduced cells that were treated with 20 and 40 U of DNase I, respectively. Lanes 3 and 4 represent results for cells that were induced with IFN-γ for 5 h and treated with 20 and 40 U of DNase I, respectively. (C) Southern blot analysis of PCR-amplified products with primer 104CIITA to detect promoter IV-associated hypersensitive sites.
FIG. 3
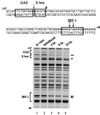
The in vivo footprint of CIITA promoter IV reveals protein-DNA contacts near the putative STAT1- and E-box-binding sites and within the IRF-1 site. The sequence of the promoter region is shown with the relevant _cis_-elements framed. Genomic footprints of the upper strand are shown in the lower panel. Lane 1 represents genomic DNA methylated in vitro to reveal the complete guanine ladder. Lanes 2 through 5 show the results of a time course of IFN-γ treatment using DNA from cells treated with DMS in culture. Open arrows indicate bases that are protected from modification. Filled arrows indicate bases for which modification is enhanced.
FIG. 4
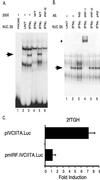
IRF-1 binds to the proximal IFN-γ-inducible promoter (promoter IV). (A) Gel shift analysis indicates that one protein complex is induced by IFN-γ (lane 2 versus lane 3) (arrow). Nuclear extracts were from 2fTGH cells induced with 500 U of IFN-γ/ml for 14 h (IFN-γ) and uninduced cells (UNT). The probe spans the IRF-1/IRF-2 site (Fig. 1A; Materials and Methods). Lane 1 contains probe only. Oligonucleotide competitors are designated in the top row and are used at 200-fold molar excess (200×). Abbreviations: WT, homologous CIITA IRF-1/IRF-2 competitor; MT, cold competitor with a mutated IRF-1/IRF-2 site; IRF-E, cold competitor with the IRF-1-binding site of the TAP1 gene. NUC. EX., nuclear extract. (B) Incubation with anti-IRF-1 induces a supershifted complex (star) and reduces the formation of the inducible complex (arrow). Antibodies are indicated at the top. Abbreviations: AB, antibody; NS, normal serum. (C) The IRF-1 site is required for induction of promoter IV by IFN-γ. Transient transfections of 2fTGH cells were performed by calcium phosphate coprecipitation using plasmids containing wild-type CIITA promoter IV (pIVCIITA.Luc) and promoter IV with a mutated IRF-1 site (pmIRF.IVCIITA.Luc). After 6 h, precipitates were removed and culture medium was added with or without 500 U of IFN-γ/ml. Cells were harvested for luciferase assays 14 h later. Fold induction after IFN-γ treatment was calculated by dividing the RLU of IFN-γ-treated samples by the RLU of untreated samples. Data shown are the averages of three independent treatment groups. Error bars represent standard errors of the means. This experiment has been repeated with similar results.
FIG. 5
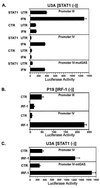
Regulation of the IFN-γ-inducible promoters by STAT1 and IRF-1. Transient transfections of U3A and P19 cells with the indicated plasmids (pIIIDEL1.CIITA.Luc for promoter III, pIVCIITA.Luc for promoter IV, pmGAS.IVCIITA.Luc for promoter IV-mtGAS, STAT1 for STAT1 expression plasmid, pcDNA3 for CTR, and IRF-1 for IRF-1 expression plasmid) were performed by calcium phosphate coprecipitation. (A) U3A is a STAT1-defective cell line derived from 2fTGH. Cultures were untreated (UNT) or treated with 500 U of human IFN-γ/ml (IFN) and harvested 14 h later. Luciferase activity was measured as RLU per microgram of protein. Error bars represent standard errors of the means. No IFN-γ induction was seen for control plasmids. These experiments have been repeated with similar results. (B) P19 is a murine embryonal carcinoma cell line that does not express IRF-1. Precipitates were removed after 6 h, and fresh culture medium was added. Cells were harvested for luciferase assays 24 h later. Luciferase activity was measured as RLU per microgram of protein. Results shown are the averages of three cultures per group. Error bars represent standard errors of the means. These experiments have been repeated with similar results. (C) U3A cells were cotransfected with the indicated plasmids. Cultures were untreated or treated with 500 U of human IFN-γ/ml and harvested 14 h later. Luciferase activity was measured as RLU per microgram of protein. Error bars represent standard errors of the means. No IFN-γ induction was seen for control or IRF-1 plasmids (data not shown). These experiments have been repeated with similar results.
FIG. 6
IFN-γ induction of the promoter IV is greater than that of promoter III. Transient transfections of 2fTGH cells were performed by calcium phosphate coprecipitation. After 6 h, precipitates were removed and culture medium was added with or without 500 U of IFN-γ/ml. Cells were harvested for luciferase assays 14 h later. Luciferase activity was measured as RLU per microgram of protein. Fold induction after IFN-γ treatment was calculated by dividing the RLU of IFN-γ-treated samples by the RLU of untreated samples. Data shown are the averages of four independent experiments. Error bars represent standard errors of the means.
FIG. 7
TGF-β suppresses both promoters, but suppression of promoter III is more pronounced. Transient transfections of 2fTGH cells were performed by calcium phosphate coprecipitation. After 6 h, precipitates were removed and culture medium was added with (TGF) or without (UNT) 10 ng of TGF-β/ml. After 12 h, culture medium was changed to medium with (IFN) or without (UNT) 500 U of IFN-γ/ml. Cells were harvested for luciferase assays 14 h later. Luciferase activity was measured as RLU per microgram of protein. Data shown are the averages of three cultures per group. Error bars represent standard errors of the means. These experiments have been repeated with similar results.
FIG. 8
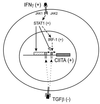
Model of the regulation of class II MHC genes by IFN-γ. B-cell constitutive expression of CIITA is mediated by the proximal 5′-flanking sequences of promoter III (horizontally hatched box). In contrast, induction of this promoter by IFN-γ is mediated by distal upstream sequences (diagonally hatched box). Binding of IFN-γ to its receptor activates JAK kinases which results in phosphorylation of STAT1. It is likely that STAT1 activation is accompanied by activation of the CIITA promoter directly via STAT1 binding to sequences in this region (black arrow). In addition, STAT1 activation induces transcription of CIITA promoter IV both by binding directly to sequences in this promoter (open arrow) and by inducing the transcription of IRF-1 that is also required for promoter activation (dashed arrow). CIITA then activates transcription of the class II MHC, Ii, and DM genes through common sequences found in the promoter regions of these genes. Binding of TGF-β to its receptor interferes with CIITA gene expression by attenuating the basal activity of both CIITA promoters. It is likely that suppression by TGF-β occurs by a mechanism that is distinct from the pathway of induction by IFN-γ.
Similar articles
- IFN-gamma regulation of class II transactivator promoter IV in macrophages and microglia: involvement of the suppressors of cytokine signaling-1 protein.
O'Keefe GM, Nguyen VT, Ping Tang LL, Benveniste EN. O'Keefe GM, et al. J Immunol. 2001 Feb 15;166(4):2260-9. doi: 10.4049/jimmunol.166.4.2260. J Immunol. 2001. PMID: 11160280 - Differential selectivity of CIITA promoter activation by IFN-gamma and IRF-1 in astrocytes and macrophages: CIITA promoter activation is not affected by TNF-alpha.
Nikcevich KM, Piskurich JF, Hellendall RP, Wang Y, Ting JP. Nikcevich KM, et al. J Neuroimmunol. 1999 Oct 29;99(2):195-204. doi: 10.1016/s0165-5728(99)00117-4. J Neuroimmunol. 1999. PMID: 10505975 - IFN-gamma regulation of the type IV class II transactivator promoter in astrocytes.
Dong Y, Rohn WM, Benveniste EN. Dong Y, et al. J Immunol. 1999 Apr 15;162(8):4731-9. J Immunol. 1999. PMID: 10202014 - Regulation of major histocompatibility complex class II genes.
Choi NM, Majumder P, Boss JM. Choi NM, et al. Curr Opin Immunol. 2011 Feb;23(1):81-7. doi: 10.1016/j.coi.2010.09.007. Epub 2010 Oct 21. Curr Opin Immunol. 2011. PMID: 20970972 Free PMC article. Review. - Class II transactivator: mastering the art of major histocompatibility complex expression.
Harton JA, Ting JP. Harton JA, et al. Mol Cell Biol. 2000 Sep;20(17):6185-94. doi: 10.1128/MCB.20.17.6185-6194.2000. Mol Cell Biol. 2000. PMID: 10938095 Free PMC article. Review. No abstract available.
Cited by
- Apical role for BRG1 in cytokine-induced promoter assembly.
Ni Z, Karaskov E, Yu T, Callaghan SM, Der S, Park DS, Xu Z, Pattenden SG, Bremner R. Ni Z, et al. Proc Natl Acad Sci U S A. 2005 Oct 11;102(41):14611-6. doi: 10.1073/pnas.0503070102. Epub 2005 Sep 29. Proc Natl Acad Sci U S A. 2005. PMID: 16195385 Free PMC article. - Role of PKCdelta in IFN-gamma-inducible CIITA gene expression.
Kwon MJ, Yao Y, Walter MJ, Holtzman MJ, Chang CH. Kwon MJ, et al. Mol Immunol. 2007 Apr;44(11):2841-9. doi: 10.1016/j.molimm.2007.01.035. Epub 2007 Mar 7. Mol Immunol. 2007. PMID: 17346795 Free PMC article. - The class II transactivator (CIITA) is regulated by post-translational modification cross-talk between ERK1/2 phosphorylation, mono-ubiquitination and Lys63 ubiquitination.
Morgan JE, Shanderson RL, Boyd NH, Cacan E, Greer SF. Morgan JE, et al. Biosci Rep. 2015 Jun 19;35(4):e00233. doi: 10.1042/BSR20150091. Biosci Rep. 2015. PMID: 26181363 Free PMC article. - Expression of the MHC class II transactivator (CIITA) type IV promoter in B lymphocytes and regulation by IFN-gamma.
Piskurich JF, Gilbert CA, Ashley BD, Zhao M, Chen H, Wu J, Bolick SC, Wright KL. Piskurich JF, et al. Mol Immunol. 2006 Feb;43(6):519-28. doi: 10.1016/j.molimm.2005.05.005. Epub 2005 Jun 13. Mol Immunol. 2006. PMID: 15950283 Free PMC article. - Biological Consequences of MHC-II Expression by Tumor Cells in Cancer.
Axelrod ML, Cook RS, Johnson DB, Balko JM. Axelrod ML, et al. Clin Cancer Res. 2019 Apr 15;25(8):2392-2402. doi: 10.1158/1078-0432.CCR-18-3200. Epub 2018 Nov 21. Clin Cancer Res. 2019. PMID: 30463850 Free PMC article. Review.
References
- Bradford M M. A rapid and sensitive method for the quantitation of microgram quantities of protein utilizing the principle of protein dye binding. Anal Biochem. 1976;72:248–254. - PubMed
- Brasier A R, Tate J E, Habener J F. Optimized use of the firefly luciferase assay as a reporter gene in mammalian cell lines. BioTechniques. 1989;7:1116–1122. - PubMed
- Chang C-H, Guerder S, Hong S-C, van Ewijk W, Flavell R A. Mice lacking the MHC class II transactivator (CIITA) show tissue-specific impairment of MHC class II expression. Immunity. 1996;4:167–178. - PubMed
Publication types
MeSH terms
Substances
Grants and funding
- P01 AI041580/AI/NIAID NIH HHS/United States
- R56 AI029564/AI/NIAID NIH HHS/United States
- R01 NS034190/NS/NINDS NIH HHS/United States
- R01 AI029564/AI/NIAID NIH HHS/United States
- R37 AI029564/AI/NIAID NIH HHS/United States
- AI41751/AI/NIAID NIH HHS/United States
- AI029564/AI/NIAID NIH HHS/United States
- AI41580/AI/NIAID NIH HHS/United States
LinkOut - more resources
Full Text Sources
Other Literature Sources
Research Materials
Miscellaneous
