The two Drosophila telomeric transposable elements have very different patterns of transcription - PubMed (original) (raw)
The two Drosophila telomeric transposable elements have very different patterns of transcription
O N Danilevskaya et al. Mol Cell Biol. 1999 Jan.
Abstract
The transposable elements HeT-A and TART constitute the telomeres of Drosophila chromosomes. Both are non-long terminal repeat (LTR) retrotransposons, sharing the remarkable property of transposing only to chromosome ends. In addition, strong sequence similarity of their gag proteins indicates that these coding regions share a common ancestor. These findings led to the assumption that HeT-A and TART are closely related. However, we now find that these elements produce quite different sets of transcripts. HeT-A produces only sense-strand transcripts of the full-length element, whereas TART produces both sense and antisense full-length RNAs, with antisense transcripts in more than 10-fold excess over sense RNA. In addition, features of TART sequence organization resemble those of a subclass of non-LTR elements characterized by unequal terminal repeats. Thus, the ancestral gag sequence appears to have become incorporated in two different types of elements, possibly with different functions in the telomere. HeT-A transcripts are found in both nuclear and cytoplasmic cell fractions, consistent with roles as both mRNA and transposition template. In contrast, both sense and antisense TART transcripts are almost entirely concentrated in nuclear fractions. Also, TART open reading frame 2 probes detect a cytoplasmic mRNA for reverse transcriptase (RT), with no similarity to TART sequence 5' or 3' of the RT coding region. This RNA could be a processed TART transcript or the product of a "free-standing" RT gene. Either origin would be novel. The distinctive transcription patterns of both HeT-A and TART are conserved in Drosophila yakuba, despite significant sequence divergence. The conservation argues that these sets of transcripts are important to the function(s) of HeT-A and TART.
Figures
FIG. 1
Diagrams of the two telomeric retrotransposons. The bars under each diagram indicate the sequences used as probes for the RNA hybridization experiments reported here. Each sequence was transcribed in vitro to yield both sense and antisense probes. TART elements can be divided into several families on the basis of their 3′ UTR sequences. The two probes marked A and B identify different subfamilies of TART and do not cross-hybridize under the conditions used here. HeT-A elements are ∼6 kb, and the TART element shown is >10 kb. (A)n, site of the poly(A) tail on RNA transposition intermediate.
FIG. 2
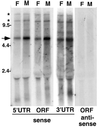
HeT-A elements produce only sense-strand transcripts. Autoradiograph of a Northern blot of total RNA from adult D. melanogaster females (lanes F) and males (lanes M) probed with HeT-A sequences. Single-strand probes detecting sense-strand RNA were used for lanes marked “sense,” while “antisense” lanes were probed with the opposite strand. See Fig. 1 for the extent of sequence in each probe. Each probe detects a prominent sense-strand RNA of ∼6 kb (arrow). Less abundant RNAs (asterisks) of approximately twice this size and greater may represent readthrough transcripts of tandem elements. (The label at ∼2 kb is due to RNA trapped by rRNA.) Each of the probes for sense-strand transcripts also detects one or more small (<2-kb) RNAs. Some of these RNAs appear to be sex specific. No antisense transcripts are detected with any of the probes. The lanes probed for antisense ORF sequences are shown. Similar results were obtained when blots were probed for 5′ and 3′ UTR antisense sequences. The marker sizes are shown in kilobases.
FIG. 3
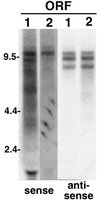
TART produces multiple full-length sequences, both sense and antisense. An autoradiograph is shown of a Northern blot of total RNA from adult Oregon R flies probed for transcripts carrying sequence of TART ORF1 (lanes 1) and ORF2 (lanes 2). Both ORFs are found in the same set of transcripts. Both sense and antisense probes detect sets of transcripts migrating between 7.5 and 12 kb; however, the sense and antisense RNAs do not exactly comigrate. The transcripts in the 7.5- to 12-kb region in Oregon R flies differ (in number and size) from those in other fly stocks and in the two cultured cell lines studied (compare Fig. 3 through 8). Note that the autoradiographic exposures shown are chosen to best display the bands produced by each probe and therefore vary from probe to probe. The detection of sense-strand RNAs requires significantly more exposure than detection of antisense transcripts. The label at ∼2 kb is due to RNA trapped by rRNA.
FIG. 4
TART A- and B-subfamily elements yield full-length transcripts of several sizes. An autoradiograph of a Northern blot of total RNA from adult 2057 flies probed with TART sequences is shown. In this stock ORF probes detect two bands of sense-strand RNA migrating above the 9.5-kb marker. (Both ORF1 and ORF2 probes give this result; ORF2 is shown.) The A-subfamily 3′ UTR probe identifies the top band as TART A RNA, while the B-subfamily 3′ UTR probe labels a band corunning with the lower band but seen only in RNA from males (indicated by the arrow in the B 3′ UTR lane). Because females in this stock lack full-length B elements, we conclude that the band just above 9.5 kb hybridizing with ORF probes in females represents a third subfamily of TART found both in males and females. This third-subfamily RNA comigrates with the B transcript in males. Both 3′ UTR probes detect very abundant short sense RNAs (<2 kb). Probes for antisense ORF sequences detect two transcripts whose gel mobilities differ slightly from that of the large sense RNAs. The larger antisense transcript may comigrate with the smaller sense RNA. Both of the large antisense RNAs hybridize with A-subfamily 3′ UTR probes. The B-subfamily 3′ UTR detects a smaller and less abundant antisense RNA seen only in males with either ORF or B 3′ UTR probes (indicated by the arrow in the B 3′ UTR lane). The label at ∼2 kb is due to RNA trapped by rRNA.
FIG. 5
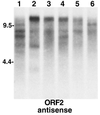
Elements yielding different-size TART transcripts can be segregated by breeding. An autoradiograph of a Northern blot of total RNA probed for TART antisense ORF2 RNA is shown. Lanes 1 to 6 contain RNA from lines selected from a mass-bred population of D. melanogaster initiated from females collected in Australia in February 1994 (20). Lines 1 to 3 were then selected on the basis of heat shock resistance, and lines 4 to 6 were parallel control lines. (Our samples, a gift of A. Hoffmann, were taken after 3 years of selection.) For our purposes the six lines illustrate the variation in TART expression patterns that can be selected from a large population of flies. Each line shows a somewhat different pattern of TART RNA. Probes for ORF1 show a similar picture. The different patterns seen clearly in the antisense strands are reflected in the sense strands (not shown), although the two strands do not give identical patterns.
FIG. 6
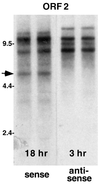
TART elements produce many more antisense- than sense-strand transcripts. An autoradiograph of a Northern blot of total RNA (replicate preparations) from the D. melanogaster Schneider 2 cell line probed with sequence from TART ORF2 is shown. Autoradiographic exposures were chosen so that probes for sense- and antisense-strand RNA produced bands of approximately equal intensity. The exposure used for sense-strand transcripts (18 h) is approximately six times that for antisense RNA (3 h). Because of the strong strand bias in A residues, the probe used to detect sense-strand RNA has incorporated nearly twice as much 32P as the complementary probe, indicating that antisense transcripts are more than 10-fold more abundant than sense RNA. ORF1 and 3′ UTR probes from TART produce similar blots, with the exception that only the ORF2 probe (containing RT sequences) detects a sense-strand transcript of 5.5 kb, which we call RTx (arrow).
FIG. 7
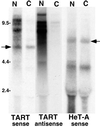
The nucleocytoplasmic distribution of TART transcripts differs from that of HeT-A transcripts. An autoradiograph of a Northern blot of RNA from cultured cells after nucleocytoplasmic fractionation is shown. N, nuclear fractions; C, cytoplasmic fractions. TART sequences were detected with ORF2 probes. HeT-A sequences were detected with a 3′ UTR probe. Full-length HeT-A RNA (right arrow) and TART RTx RNA (left arrow) are found in nuclear and cytoplasmic fractions, while the large TART transcripts (both sense and antisense) are almost entirely limited to the nuclear fraction. The 6-kb HeT-A RNA is seen with all HeT-A probes. The ∼4-kb HeT-A RNA is detected only with 3′ UTR probes and only in cultured cells; its origin is not known. The label at ∼2 kb is due to RNA trapped by rRNA.
FIG. 8
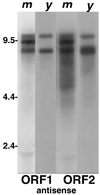
The abundant antisense transcription of TART is conserved in related Drosophila species. An autoradiograph of a Northern blot comparing TART transcripts in D. melanogaster (m) with those in D. yakuba (y) is shown. Both samples have been probed with sequences from D. melanogaster TART ORF1 and ORF2. The D. melanogaster lanes were exposed for 20 h, and the D. yakuba lanes were exposed for 44 h. Only lanes with antisense transcripts are shown. In D. yakuba, as in D. melanogaster, TART antisense transcripts are much more abundant than TART sense RNAs.
FIG. 9
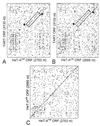
TART ORF1 has significant sequence similarity with the HeT-A coding region. (A and B) Dot matrix comparisons of the nucleotide sequence of TART ORF1 from D. melanogaster with sequences of the entire coding regions of HeT-A elements from D. melanogaster (A) and D. yakuba (B). (C) The two HeT-A elements have 65% sequence identity distributed evenly over the coding region. HeT-Amel has 38% identity with TART, and HeT-Ayak has 41% identity with TART. For both HeT-A elements, the regions of identity with TART are strongest in the C-terminal end of the coding region (boxed and marked by stars).
FIG. 10
Diagrams of TART A and TART B showing locations of perfect repeat sequences (indicated by the black bars under the elements). Both elements are truncated at the 5′ end. The TART B diagram is based on data from reference ;0. (A)n, site of the poly(A) tail on RNA transposition intermediate.
Similar articles
- The gag coding region of the Drosophila telomeric retrotransposon, HeT-A, has an internal frame shift and a length polymorphic region.
Pardue ML, Danilevskaya ON, Lowenhaupt K, Wong J, Erby K. Pardue ML, et al. J Mol Evol. 1996 Dec;43(6):572-83. doi: 10.1007/BF02202105. J Mol Evol. 1996. PMID: 8995054 - Drosophila telomeres: two transposable elements with important roles in chromosomes.
Pardue ML, DeBaryshe PG. Pardue ML, et al. Genetica. 1999;107(1-3):189-96. Genetica. 1999. PMID: 10952212 - Identification of multiple transcription initiation, polyadenylation, and splice sites in the Drosophila melanogaster TART family of telomeric retrotransposons.
Maxwell PH, Belote JM, Levis RW. Maxwell PH, et al. Nucleic Acids Res. 2006;34(19):5498-507. doi: 10.1093/nar/gkl709. Epub 2006 Oct 4. Nucleic Acids Res. 2006. PMID: 17020919 Free PMC article. - Drosophila telomere elongation.
Biessmann H, Walter MF, Mason JM. Biessmann H, et al. Ciba Found Symp. 1997;211:53-67; discussion 67-70. doi: 10.1002/9780470515433.ch5. Ciba Found Symp. 1997. PMID: 9524751 Review. - Drosophila telomeres: an example of co-evolution with transposable elements.
Silva-Sousa R, López-Panadѐs E, Casacuberta E. Silva-Sousa R, et al. Genome Dyn. 2012;7:46-67. doi: 10.1159/000337127. Epub 2012 Jun 25. Genome Dyn. 2012. PMID: 22759813 Review.
Cited by
- Telomeric retrotransposons show propensity to form G-quadruplexes in various eukaryotic species.
Jedlička P, Tokan V, Kejnovská I, Hobza R, Kejnovský E. Jedlička P, et al. Mob DNA. 2023 Apr 10;14(1):3. doi: 10.1186/s13100-023-00291-9. Mob DNA. 2023. PMID: 37038191 Free PMC article. - Additional ORFs in Plant LTR-Retrotransposons.
Vicient CM, Casacuberta JM. Vicient CM, et al. Front Plant Sci. 2020 May 26;11:555. doi: 10.3389/fpls.2020.00555. eCollection 2020. Front Plant Sci. 2020. PMID: 32528484 Free PMC article. Review. - Nuclear Ccr4-Not mediates the degradation of telomeric and transposon transcripts at chromatin in the Drosophila germline.
Kordyukova M, Sokolova O, Morgunova V, Ryazansky S, Akulenko N, Glukhov S, Kalmykova A. Kordyukova M, et al. Nucleic Acids Res. 2020 Jan 10;48(1):141-156. doi: 10.1093/nar/gkz1072. Nucleic Acids Res. 2020. PMID: 31724732 Free PMC article. - Subcellular localization and Egl-mediated transport of telomeric retrotransposon HeT-A ribonucleoprotein particles in the Drosophila germline and early embryogenesis.
Kordyukova M, Morgunova V, Olovnikov I, Komarov PA, Mironova A, Olenkina OM, Kalmykova A. Kordyukova M, et al. PLoS One. 2018 Aug 29;13(8):e0201787. doi: 10.1371/journal.pone.0201787. eCollection 2018. PLoS One. 2018. PMID: 30157274 Free PMC article. - Key role of piRNAs in telomeric chromatin maintenance and telomere nuclear positioning in Drosophila germline.
Radion E, Morgunova V, Ryazansky S, Akulenko N, Lavrov S, Abramov Y, Komarov PA, Glukhov SI, Olovnikov I, Kalmykova A. Radion E, et al. Epigenetics Chromatin. 2018 Jul 12;11(1):40. doi: 10.1186/s13072-018-0210-4. Epigenetics Chromatin. 2018. PMID: 30001204 Free PMC article.
References
- Biessmann H, Mason J M, Ferry K, d’Hulst M, Valgeirsdottir K, Traverse K L, Pardue M-L. Addition of telomere-associated HeT DNA sequences “heals” broken chromosome ends in Drosophila. Cell. 1990;61:663–673. - PubMed
- Biessmann H, Kasravi B, Bui T, Fujiwara G, Champion L E, Mason J M. Comparison of two active Het-A retroposons of Drosophila melanogaster. Chromosoma. 1994;103:90–98. - PubMed
- Bodnar A G, Ouellette M, Frolkis M, Holt S E, Chiu C-P, Morin G B, Harley C B, Shay J W, Lichsteiner S, Wright W E. Extension of life span by introduction of telomerase into normal human cells. Science. 1998;279:349–352. - PubMed
Publication types
MeSH terms
Substances
LinkOut - more resources
Full Text Sources
Molecular Biology Databases

