Visualization of melanosome dynamics within wild-type and dilute melanocytes suggests a paradigm for myosin V function In vivo - PubMed (original) (raw)
Visualization of melanosome dynamics within wild-type and dilute melanocytes suggests a paradigm for myosin V function In vivo
X Wu et al. J Cell Biol. 1998.
Abstract
Unlike wild-type mouse melanocytes, where melanosomes are concentrated in dendrites and dendritic tips, melanosomes in dilute (myosin Va-) melanocytes are concentrated in the cell center. Here we sought to define the role that myosin Va plays in melanosome transport and distribution. Actin filaments that comprise a cortical shell running the length of the dendrite were found to exhibit a random orientation, suggesting that myosin Va could drive the outward spreading of melanosomes by catalyzing random walks. In contrast to this mechanism, time lapse video microscopy revealed that melanosomes undergo rapid ( approximately 1.5 microm/s) microtubule-dependent movements to the periphery and back again. This bidirectional traffic occurs in both wild-type and dilute melanocytes, but it is more obvious in dilute melanocytes because the only melanosomes in their periphery are those undergoing this movement. While providing an efficient means to transport melanosomes to the periphery, this component does not by itself result in their net accumulation there. These observations, together with previous studies showing extensive colocalization of myosin Va and melanosomes in the actin-rich periphery, suggest a mechanism in which a myosin Va-dependent interaction of melanosomes with F-actin in the periphery prevents these organelles from returning on microtubules to the cell center, causing their distal accumulation. This "capture" model is supported by the demonstration that (a) expression of the myosin Va tail domain within wild-type cells creates a dilute-like phenotype via a process involving initial colocalization of tail domains with melanosomes in the periphery, followed by an approximately 120-min, microtubule-based redistribution of melanosomes to the cell center; (b) microtubule-dependent melanosome movement appears to be damped by myosin Va; (c) intermittent, microtubule-independent, approximately 0.14 microm/s melanosome movements are seen only in wild-type melanocytes; and (d) these movements do not drive obvious spreading of melanosomes over 90 min. We conclude that long-range, bidirectional, microtubule-dependent melanosome movements, coupled with actomyosin Va-dependent capture of melanosomes in the periphery, is the predominant mechanism responsible for the centrifugal transport and peripheral accumulation of melanosomes in mouse melanocytes. This mechanism represents an alternative to straightforward transport models when interpreting other myosin V mutant phenotypes.
Figures
Figure 1
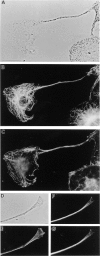
Organization of microtubules and F-actin in melanocytes. Shown are phase contrast images of a melan-a melanocyte exhibiting a single, long dendritic extension (A) and the distal portion of another dendrite (D), and the distributions of microtubules (B, F, and G; F and G are two different focal planes) and F-actin (C and E) within them. Bars: (A) 10 μm; (B) 2 μm.
Figure 7
Colocalization of GFP-tagged myosin Va tail domains and melanosomes in the periphery of transfected melanocytes before the generation of the _dilute_-like phenotype. (A) Untransfected cells (nonfluorescent) and a single cell transfected with plasmid EGFP-MC-ST before the appearance of the _dilute_-like phenotype (24 h after transfection). (B) GFP fluorescence in this transfected cell (1-μm section). Note the colocalization of fluorescence and black pigment (arrows). Bar, 7.5 μm.
Figure 2
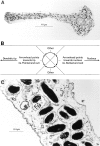
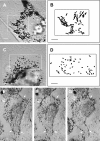
Orientation of F-actin within melanocyte dendrites. (A) Low-magnification transmission electron micrograph of the dendrite of a melan-a melanocyte labeled with subfragment 1. (B) Schematic indicating how F-actin orientation was scored in dendrites. (C) High-magnification micrograph of a section of dendrite from an S1-labeled melanocyte. Black arrowheads have been applied to aid in showing the orientation of filaments within this section.
Figure 3
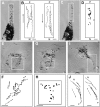
Rapid, bidirectional melanosome translocation in the periphery of dilute melanocytes. (A) A typical dilute null melanocyte in primary culture. (B1–B10 and C1–C10) Successive video stills (1-s intervals) of typical centrifugal (B1–B10) and centripetal (C1–C10) melanosome movements (white arrows). (D and E) The paths for a portion of the centrifugal (D) and centripetal (E) melanosome movements that occurred over a 3-min time span within the boxed area in A. The path diagrams for this and some subsequent figures are reoriented relative to the image of the cell so that up is towards the periphery (P) and down is towards the nucleus (N). As in all subsequent path diagrams, the positions of melanosomes are shown at 1-s intervals. (F) A lightly melanized dilute melanocyte. (G) The paths for a portion of the centrifugal (closed circles) and centripetal (open circles) movements that occurred over a 3-min period within the boxed area in F. (H) The paths for four individual melanosomes that moved centrifugally and then centripetally. (I1–I11) Video stills of one such melanosome (white arrows). (J) A more dendritic dilute melanocyte. (K and L) The paths for the most obvious centrifugal and centripetal movements that occurred over a 40-s period within the boxed area in J. (M) A large dendritic extension from a dilute melanocyte. (N) Several highly persistent bidirectional melanosome movements that occurred over a 3-min interval within the boxed area in M. The identification of these organelles as melanosomes is certain because they can also be seen to move in brightfield images, where the black melanin within them is the only thing visible, and because these black objects match the match the size and shape of authentic melanosomes. Bars, 2.88 μm.
Figure 4
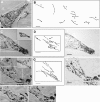
Microtubule dependence of the fast peripheral and central melanosome movements. (A) A dilute melanocyte before the addition of nocodazole. (B) Some of the fast centrifugal (left) and centripetal (right) movements that occurred over a 2-min period within the boxed area in A. (C) The same cell as in A, but 5 min after the addition of 16 μM nocodazole to the perfusion medium. (D) The paths for all of the melanosomes within the boxed area in C over the ensuing 1 min. (E) The lightly melanized cell also described in Fig. 3, before the addition of nocodazole. (F) Some of the fast central movements that occurred within the boxed area in E over a 1-min span. (G) The same cell as in E, but after treatment with nocodazole and incubation at 4°C, as described in the text. (H) The complete paths for all of the melanosomes within the boxed area in G over a 1-min time span (i.e., all 60 positions for each melanosome are shown). (I) The same cell as in G, but following perfusion for 30 min without nocodazole. (J) A portion of the fast centrifugal (left) and centripetal (right) movements that occurred over a 2-min period within the boxed area in I. Bars, 2.88 μm.
Figure 5
Rapid, bidirectional melanosome translocation in wild-type melanocytes. (A) A well-spread wild-type melanocyte. (B) The paths for a portion of the fast centrifugal and centripetal (arrowheads) movements that occurred over a 2-min span within the boxed area in A. (C) The dendrite and melanosome-rich tip of the wild-type melanocyte shown in the inset. (D) The paths for a portion of the fast centrifugal and centripetal movements that occurred over a 3-min span within the boxed area in C. (E) The paths for two centrifugal movements (closed circles) that delivered melanosomes to, and two centripetal movements (open circles) that removed melanosomes from, the dendritic tip. (F) The dendritic extension of the cell shown in the inset, which had a prominent accumulation of melanosomes along the lateral edges of the dendrite. (G) Some of the fast centrifugal and centripetal movements that occurred over a 3-min period within the boxed area in F. (H) The paths for three centrifugal movements (closed circles) that delivered melanosomes to, and three centripetal movements (open circles) that removed melanosomes from, the lateral edge of this dendrite. (I and J) The tip of the cell shown in F before (I) and after (J) an ∼10-min period where pronounced centrifugal movements led to an approximately twofold increase in the numbers of melanosomes at the tip. Bars, 2.88 μm.
Figure 9
The dynamics of melanosomes in microtubule-depleted wild-type and dilute null melanocytes. (A and C) Microtubule-depleted wild-type and dilute null melanocytes, respectively. (B and D) The paths for all of the melanosomes present within the boxed areas in A and C, respectively, over an entire 100-s period (i.e., the positions for every melanosome were digitized over the entire 100 s, or until the melanosome was no longer visible because it moved out of the plane of focus or became indistinguishable from surrounding melanosomes). (E–G) A melan-a melanocyte before microtubule depletion (E), 5 min after being returned to 37°C (in the presence of nocodazole) after a 30-min incubation at 4°C with nocodazole (F) and 90 min later (G). Arrows in all three panels point to the prominent concentration of melanosomes in the cortex of this cell. The black area marked by an arrowhead in G is part of another cell. Bars: (A–D) 2.2 μm; (E–G) 4.5 μm.
Figure 10
Histograms of the speeds of melanosomes in microtubule-depleted wild-type and dilute melanocytes. Speeds for wild-type (filled bars) and dilute (hashed bars) melanocytes were binned in 0.025-μm/s increments (except for the first bin, which represents true zero, i.e., not a range) and plotted as a percentage of total steps.
Figure 6
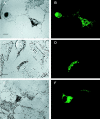
Expression of myosin Va tail domain fusion proteins in wild-type melanocytes creates a _dilute_-like phenotype. (A, C, and E) Fields of melan-a melanocytes showing untransfected cells (nonfluorescent) and cells transfected with plasmids EGFP-MC-ST (A and C) and FLAG-MC-LT (E) (48 h after transfection). (B, D, and F) Corresponding confocal micrographs of GFP fluorescence in fixed (B; stacked images) and living (D; 1-μm section) cells, and FLAG fluorescence (using rhodamine-labeled anti-FLAG monoclonal antibody) in fixed cells (F; 1-μm section). Bars: (A) 16.7 μm; (C and E) 7.5 μm.
Figure 8
Time lapse video micrographs of a transfected melan-a melanocyte during the generation of the _dilute_-like phenotype. (A–F) Video stills at 30-min intervals of a single melan-a melanotype transfected with plasmid EGFP-MC-ST (center). At time zero, this cell had peripherally distributed fluorescence that localized with the melanosomes accumulated under the plasma membrane. (G) This same cell 5 min after the image in F. (H) The distribution of fluorescence ∼90 s after capturing the image in G (the time required to change cameras). The intense spot of fluorescence probably represents myosin Va tails accumulated at the microtubule-organizing center (see Wu et al., 1998). Bars, 6.4 μm.
Figure 11
Model depicting how microtubule- and actomyosin Va–dependent melanosome traffic cooperate to drive the centrifugal transport and peripheral accumulation of melanosomes. Melanosomes undergo fast, bidirectional, long-range microtubule-dependent translocations within dendritic extensions (1). Myosin Va serves to capture melanosomes delivered to the periphery via the centrifugal component of microtubule-dependent movement by mediating their interaction with F-actin (2). The myosin Va molecules involved in this capture can be associated with peripheral F-actin (3), the soluble pool (4), and/or may be present as passengers on melanosomes as they are carried to the periphery on microtubules (5). This latter possibility is supported by the distributions of the GFP–myosin Va chimera reported here, and would be consistent with the landmark observation in squid axoplasm that individual organelles can move on both actin and microtubules (Kuznetsov et al., 1992). Melanosome capture occurs primarily at the actin-rich dendritic tip (2), but also along the lateral edge of dendrites (especially in less polarized melanocytes) (6). While a large percentage of captured melanosomes do not exhibit obvious motion (7), short-range, myosin Va–dependent melanosome movements in the periphery do occur. These movements may be due to the myosin Va–dependent translocation of these organelles on actin (8), and/ or to the movement of actin to which melanosomes are tethered by myosin Va (not shown). The myosin Va–dependent movement of melanosomes on actin will tend to be restricted by the physical barriers inherent in isotropic actin networks (9), by the association of individual melanosomes with filaments of opposite polarity (10), and by incomplete anchorage of actin filaments. Actin is sparse in the central cytoplasm (11), except for lamellae, which exclude melanosomes and do not contain myosin Va (12). Melanosomes also move on the large mass of microtubules in the center of melanocytes (13). These microtubules provide the “sink” that drives the accumulation of melanosomes in the center of myosin Va− cells and of wild-type cells transfected with dominant-negative constructs.
Similar articles
- Rab27a enables myosin Va-dependent melanosome capture by recruiting the myosin to the organelle.
Wu X, Rao K, Bowers MB, Copeland NG, Jenkins NA, Hammer JA 3rd. Wu X, et al. J Cell Sci. 2001 Mar;114(Pt 6):1091-100. doi: 10.1242/jcs.114.6.1091. J Cell Sci. 2001. PMID: 11228153 - Expression of constructs of the neuronal isoform of myosin-Va interferes with the distribution of melanosomes and other vesicles in melanoma cells.
da Silva Bizario JC, da Cunha Nascimento AA, Casaletti L, Patussi EV, Chociay MF, Larson RE, Espreafico EM. da Silva Bizario JC, et al. Cell Motil Cytoskeleton. 2002 Feb;51(2):57-75. doi: 10.1002/cm.10010. Cell Motil Cytoskeleton. 2002. PMID: 11921164 - Melanoregulin regulates a shedding mechanism that drives melanosome transfer from melanocytes to keratinocytes.
Wu XS, Masedunskas A, Weigert R, Copeland NG, Jenkins NA, Hammer JA. Wu XS, et al. Proc Natl Acad Sci U S A. 2012 Jul 31;109(31):E2101-9. doi: 10.1073/pnas.1209397109. Epub 2012 Jul 2. Proc Natl Acad Sci U S A. 2012. PMID: 22753477 Free PMC article. - Making sense of melanosome dynamics in mouse melanocytes.
Wu X, Hammer JA 3rd. Wu X, et al. Pigment Cell Res. 2000 Aug;13(4):241-7. doi: 10.1034/j.1600-0749.2000.130405.x. Pigment Cell Res. 2000. PMID: 10952391 Review. - Molecular motors and their role in pigmentation.
Lambert J, Vancoillie G, Naeyaert JM. Lambert J, et al. Cell Mol Biol (Noisy-le-grand). 1999 Nov;45(7):905-18. Cell Mol Biol (Noisy-le-grand). 1999. PMID: 10643995 Review.
Cited by
- MARCKS and related chaperones bind to unconventional myosin V isoforms in airway epithelial cells.
Lin KW, Fang S, Park J, Crews AL, Adler KB. Lin KW, et al. Am J Respir Cell Mol Biol. 2010 Aug;43(2):131-6. doi: 10.1165/rcmb.2010-0016RC. Epub 2010 Mar 4. Am J Respir Cell Mol Biol. 2010. PMID: 20203291 Free PMC article. - The role of mVps18p in clustering, fusion, and intracellular localization of late endocytic organelles.
Poupon V, Stewart A, Gray SR, Piper RC, Luzio JP. Poupon V, et al. Mol Biol Cell. 2003 Oct;14(10):4015-27. doi: 10.1091/mbc.e03-01-0040. Epub 2003 Jul 11. Mol Biol Cell. 2003. PMID: 14517315 Free PMC article. - The actin-binding domain of Slac2-a/melanophilin is required for melanosome distribution in melanocytes.
Kuroda TS, Ariga H, Fukuda M. Kuroda TS, et al. Mol Cell Biol. 2003 Aug;23(15):5245-55. doi: 10.1128/MCB.23.15.5245-5255.2003. Mol Cell Biol. 2003. PMID: 12861011 Free PMC article. - Case Report: MYO5B Homozygous Variant c.2090+3A>T Causes Intron Retention Related to Chronic Cholestasis and Diarrhea.
Zheng Y, Peng Y, Zhang S, Zhao H, Chen W, Yang Y, Hu Z, Yin Q, Peng Y. Zheng Y, et al. Front Genet. 2022 May 30;13:872836. doi: 10.3389/fgene.2022.872836. eCollection 2022. Front Genet. 2022. PMID: 35706451 Free PMC article. - Principles of unconventional myosin function and targeting.
Hartman MA, Finan D, Sivaramakrishnan S, Spudich JA. Hartman MA, et al. Annu Rev Cell Dev Biol. 2011;27:133-55. doi: 10.1146/annurev-cellbio-100809-151502. Epub 2011 May 31. Annu Rev Cell Dev Biol. 2011. PMID: 21639800 Free PMC article. Review.
References
- Baas PW, Yu W. A composite model for establishing the microtubule arrays of the neuron. Mol Neurobiol. 1998;12:145–161. - PubMed
- Bray, D. 1992. In Cell Movements. Garland Publishing, Inc., New York. 243–264.
- Brown SS. Myosins in yeast. Curr Opin Cell Biol. 1997;9:44–48. - PubMed
