The avidity spectrum of T cell receptor interactions accounts for T cell anergy in a double transgenic model - PubMed (original) (raw)
The avidity spectrum of T cell receptor interactions accounts for T cell anergy in a double transgenic model
L Girgis et al. J Exp Med. 1999.
Abstract
The mechanism of self-tolerance in the CD4(+) T cell compartment was examined in a double transgenic (Tg) model in which T cell receptor (TCR)-alpha/beta Tg mice with specificity for the COOH-terminal peptide of moth cytochrome c in association with I-Ek were crossed with antigen Tg mice. Partial deletion of cytochrome-reactive T cells in the thymus allowed some self-specific CD4(+) T cells to be selected into the peripheral T cell pool. Upon restimulation with peptide in vitro, these cells upregulated interleukin (IL)-2 receptor but showed substantially lower cytokine production and proliferation than cells from TCR Tg controls. Proliferation and cytokine production were restored to control levels by addition of saturating concentrations of IL-2, consistent with the original in vitro definition of T cell anergy. However, the response of double Tg cells to superantigen stimulation in the absence of exogenous IL-2 was indistinguishable from that of TCR Tg controls, indicating that these self-reactive cells were not intrinsically hyporesponsive. Measurement of surface expression of Tg-encoded TCR alpha and beta chains revealed that cells from double Tg mice expressed the same amount of TCR-beta as cells from TCR Tg controls, but only 50% of TCR-alpha, implying expression of more than one alpha chain. Naive CD4(+) T cells expressing both Tg-encoded and endogenous alpha chains also manifested an anergic phenotype upon primary stimulation with cytochrome c in vitro, suggesting that low avidity for antigen can produce an anergic phenotype in naive cells. The carboxyfluorescein diacetate succinimidyl ester cell division profiles in response to titered peptide +/- IL-2 indicated that expression of IL-2 receptor correlated with peptide concentration but not TCR level, whereas IL-2 production was profoundly affected by the twofold decrease in specific TCR expression. Addition of exogenous IL-2 recruited double Tg cells into division, resulting in a pattern of cell division indistinguishable from that of controls. Thus, in this experimental model, cells expressing more than one alpha chain escaped negative selection to a soluble self-protein in the thymus and had an anergic phenotype indistinguishable from that of low avidity naive cells. The data are consistent with the notion that avidity-mediated selection for self-reactivity in the thymus may lead to the appearance of anergy within the peripheral, self-reactive T cell repertoire, without invoking the induction of hyporesponsiveness to TCR-mediated signals.
Figures
Figure 1
Thymus and lymph node T cells from double Tg mice manifest an anergic phenotype in vitro. (A) Thymocytes and lymphocytes were stimulated under four different stimulation conditions: 1 μM MCC87–103 peptide with or without rhIL-2 at 50 U/ml, IL-2 alone, or TCM alone. Four replicate cultures from each of four double and four single TCR Tg H-2k/b mice were set up under each condition. Each point represents the mean result for the 16 cultures and error bars represent the SEM. This result is representative of two experiments. (B) Proliferation of thymocytes and lymph node cells in response to titered concentrations of MCC87–103 peptide. Each point represents the mean result for four double or single TCR H-2k/b mice (16 cultures) and error bars represent the SEM. Where error bars are not visible, they are too small to be apparent. These data are also representative of two experiments. □, TCM alone; ○, IL-2; ▪, MCC peptide; •, MCC peptide plus IL-2.
Figure 2
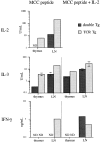
Cytokine production by thymus and lymph node cells from double versus TCR Tg mice. IL-2 was measured in supernatants from wells stimulated with 10 μM MCC87–103 (from the experiment shown in Fig. 1 B). IL-3 was measured in the same supernatants and in the corresponding wells to which additional rhIL-2 was added. IFN-γ was measured in the day 4 supernatants of cultures set up with 106 CFSE-labeled cells/ml and 10 μM MCC87–103 ± rhIL-2 (see Figs. 3 and 4 for CFSE profiles from these cultures). IL-4, IL-5, and IL-10 were below the limit of detection in the CFSE culture supernatants. Error bars represent the SEM for four individual mice in each group for IL-2 and IL-3 assays, and for duplicate IFN-γ ELISA assays of the CFSE culture supernatants. ND, none detected.
Figure 3
CFSE division profile of CD4+Vα11+ thymus and lymph node cells after in vitro stimulation with MCC peptide in the absence of exogenous IL-2. Thymus and lymph node cell suspensions from double and TCR Tg donor mice were depleted of CD8+ cells, labeled with CFSE, and cultured with a titration of MCC87–103 peptide in the presence of a constant number of syngeneic irradiated APCs. Wells with no additional peptide were included as controls. No cell division was seen on days 1 and 2 (data not shown). Histograms of CFSE fluorescence intensity were gated for CD4+Vβ3+Vα11+PI− cells and are shown for cultures harvested on day 4. By day 7, the vast majority of TCR Tg cells had entered division, and many had proliferated such that their CFSE signal was too low to be distinguished from the autofluorescence of activated T cells (>8 divisions). In contrast, no further division of double Tg cells was seen between days 4 and 7. The data are representative of three experiments.
Figure 4
CFSE division profile of CD4+ Vα11+ thymus and lymph node cells after in vitro stimulation with MCC peptide and exogenous IL-2. Cultures were set up as for Fig. 3, with addition of rhIL-2 (50 U/ml). Analysis of day 4 CFSE division profiles was performed by gating on CD4+Vβ3+ Vα11+PI− cells. Once again, no cell division was seen on days 1 and 2 (data not shown). By day 7, the majority of cells in cultures of TCR and double Tg cells had divided at least eight times (the level at which CFSE reaches the level of autofluorescence for activated T cells). The data are representative of three experiments.
Figure 5
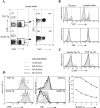
Expression of TCR, CD4, and CD44 in double and TCR Tg mice. (A) 5C.C7 TCR expression by CD4+ cells in the lymph nodes of double and TCR Tg mice. (B) Reduction in the level of Tg α but not Tg β expression by CD4+CD8− cells in the thymus and lymph nodes of double Tg mice (filled profiles) as compared with TCR Tg controls (unfilled profiles). (C) CD44 expression by Tgα+ versus α− subsets of double and TCR lymph node CD4+ cells. (D) Response of double and TCR Tg cells to in vitro stimulation by 1 μM MCC87–103 peptide and 50 U/ml rhIL-2. Day 3 profiles were gated for IL-2R+ cells (left). A minor difference in the initial efficiency of CFSE labeling accounts for the difference in the absolute intensity of the CFSE profiles. Further gating for each CFSE division peak was performed according to the gates shown in the left panels, yielding the Vα11 profiles in the center panels. (Right) The line graph represents the geometric mean fluorescence intensity of Vα11 at each division for two mice in each group. □, TCR Tg; ○, double Tg. These data are representative of six in vitro experiments involving stimulation with either peptide ± IL-2 or SEA.
Figure 6
CFSE division profile of CD4+CD8−Vα11+ thymus and lymph node cells after in vitro stimulation with SEA in the absence of exogenous IL-2. Histograms of CFSE fluorescence intensity, gated on CD4+Vβ3+Vα11+PI− cells, are shown for day 3 cultures. The profiles are representative of two experiments.
Figure 7
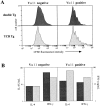
Response of sorted CD4+CD8−Vα11+ thymus cells to in vitro stimulation with SEA in the absence of exogenous IL-2. CD8- depleted thymocytes from double and TCR Tg mice were sorted into CD4+PI−Vα11+ and Vα11− subsets before CFSE-labeling and cultured with syngeneic irradiated APCs and 100 ng/ml SEA. Histograms of CFSE fluorescence intensity show equivalent cell division profiles from all sorted subsets of cells on day 3. In addition, 100% of CD4+ cells upregulated IL-2Rα in each culture (data not shown). Similar findings were achieved with lymph node cells (data not shown). (B) Cytokine production by SEA-stimulated sorted cells from the experiment shown in A, measured in day 3 culture supernatants. dark gray bars, double Tg; light gray bars, TCR Tg.
Figure 8
Naive T cells of low avidity manifest an anergic phenotype in vitro. Left panels show representative overlay histograms of Vα11 expression, stained directly ex vivo, from a number of Tg mouse lines (filled histograms) compared with a −D H-2b/k control stained on the same occasion (unfilled histograms) (see Table I for a description of the Tg lines). Right panels show the in vitro proliferative response as assessed by [3H]TdR incorporation from cultures of thymus and lymph node cells stimulated with MCC87–103 with and without rhIL-2, IL-2 alone, and TCM alone, as indicated. □, TCM; ○, IL-2; ▪, MCC peptide; •, MCC peptide plus IL-2.
Similar articles
- In vitro positive selection and anergy induction of class II-restricted TCR transgenic thymocytes by a cortical thymic epithelial cell line.
Nelson AJ, Clegg CH, Farr AG. Nelson AJ, et al. Int Immunol. 1998 Sep;10(9):1335-46. doi: 10.1093/intimm/10.9.1335. Int Immunol. 1998. PMID: 9786433 - Anergy in peripheral memory CD4(+) T cells induced by low avidity engagement of T cell receptor.
Mirshahidi S, Huang CT, Sadegh-Nasseri S. Mirshahidi S, et al. J Exp Med. 2001 Sep 17;194(6):719-31. doi: 10.1084/jem.194.6.719. J Exp Med. 2001. PMID: 11560989 Free PMC article. - Thymus and autoimmunity: production of CD25+CD4+ naturally anergic and suppressive T cells as a key function of the thymus in maintaining immunologic self-tolerance.
Itoh M, Takahashi T, Sakaguchi N, Kuniyasu Y, Shimizu J, Otsuka F, Sakaguchi S. Itoh M, et al. J Immunol. 1999 May 1;162(9):5317-26. J Immunol. 1999. PMID: 10228007 - Thymic commitment of regulatory T cells is a pathway of TCR-dependent selection that isolates repertoires undergoing positive or negative selection.
Coutinho A, Caramalho I, Seixas E, Demengeot J. Coutinho A, et al. Curr Top Microbiol Immunol. 2005;293:43-71. doi: 10.1007/3-540-27702-1_3. Curr Top Microbiol Immunol. 2005. PMID: 15981475 Review. - Non-deletional mechanisms of peripheral and central tolerance: studies with transgenic mice with tissue-specific expression of a foreign MHC class I antigen.
Hämmerling GJ, Schönrich G, Momburg F, Auphan N, Malissen M, Malissen B, Schmitt-Verhulst AM, Arnold B. Hämmerling GJ, et al. Immunol Rev. 1991 Aug;122:47-67. doi: 10.1111/j.1600-065x.1991.tb00596.x. Immunol Rev. 1991. PMID: 1834543 Review.
Cited by
- Triggering a second T cell receptor on diabetogenic T cells can prevent induction of diabetes.
Fossati G, Cooke A, Papafio RQ, Haskins K, Stockinger B. Fossati G, et al. J Exp Med. 1999 Aug 16;190(4):577-83. doi: 10.1084/jem.190.4.577. J Exp Med. 1999. PMID: 10449528 Free PMC article. - T-cell tolerance induction is normal in the (NZB x NZW)F1 murine model of systemic lupus erythematosus.
Wither J, Vukusic B. Wither J, et al. Immunology. 2000 Mar;99(3):345-51. doi: 10.1046/j.1365-2567.2000.00981.x. Immunology. 2000. PMID: 10712663 Free PMC article. - Stromal and hematopoietic cells in secondary lymphoid organs: partners in immunity.
Malhotra D, Fletcher AL, Turley SJ. Malhotra D, et al. Immunol Rev. 2013 Jan;251(1):160-76. doi: 10.1111/imr.12023. Immunol Rev. 2013. PMID: 23278748 Free PMC article. Review. - Nonspecific down-regulation of CD8+ T-cell responses in mice expressing human papillomavirus type 16 E7 oncoprotein from the keratin-14 promoter.
Tindle RW, Herd K, Doan T, Bryson G, Leggatt GR, Lambert P, Frazer IH, Street M. Tindle RW, et al. J Virol. 2001 Jul;75(13):5985-97. doi: 10.1128/JVI.75.13.5985-5997.2001. J Virol. 2001. PMID: 11390600 Free PMC article. - Tumour-specific CD4 T cells eradicate melanoma via indirect recognition of tumour-derived antigen.
Shklovskaya E, Terry AM, Guy TV, Buckley A, Bolton HA, Zhu E, Holst J, Fazekas de St. Groth B. Shklovskaya E, et al. Immunol Cell Biol. 2016 Jul;94(6):593-603. doi: 10.1038/icb.2016.14. Epub 2016 Feb 3. Immunol Cell Biol. 2016. PMID: 26837456
References
- Kappler JW, Roehm N, Marrack P. T cell tolerance by clonal elimination in the thymus. Cell. 1987;49:273–280. - PubMed
- Kisielow P, Bluethmann H, Staerz UD, Steinmetz M, von Boehmer H. Tolerance in T-cell-receptor transgenic mice involves deletion of nonmature CD4+8+thymocytes. Nature. 1988;333:742–746. - PubMed
- Sha WC, Nelson CA, Newberry RD, Kranz DM, Russell JH, Loh DY. Positive and negative selection of an antigen receptor on T cells in transgenic mice. Nature. 1988;336:73–76. - PubMed
- Berg LJ, Fazekas de St. Groth B, Pullen AM, Davis MM. Phenotypic differences between αβ versus β T-cell receptor transgenic mice undergoing negative selection. Nature. 1989;340:559–562. - PubMed
- Webb S, Morris C, Sprent J. Extrathymic tolerance of mature T cells: clonal elimination as a consequence of immunity. Cell. 1990;63:1249–1256. - PubMed
Publication types
MeSH terms
Substances
LinkOut - more resources
Full Text Sources
Molecular Biology Databases
Research Materials
Miscellaneous


