Initiation of autoimmune diabetes by developmentally regulated presentation of islet cell antigens in the pancreatic lymph nodes - PubMed (original) (raw)
Initiation of autoimmune diabetes by developmentally regulated presentation of islet cell antigens in the pancreatic lymph nodes
P Höglund et al. J Exp Med. 1999.
Abstract
Little is known about the events triggering lymphocyte invasion of the pancreatic islets in prelude to autoimmune diabetes. For example, where islet-reactive T cells first encounter antigen has not been identified. We addressed this issue using BDC2.5 T cell receptor transgenic mice, which express a receptor recognizing a natural islet beta cell antigen. In BDC2.5 animals, activated T cells were found only in the islets and the lymph nodes draining them, and there was a close temporal correlation between lymph node T cell activation and islet infiltration. When naive BDC2.5 T cells were transferred into nontransgenic recipients, proliferating cells were observed only in pancreatic lymph nodes, and this occurred significantly before insulitis was detectable. Surprisingly, proliferation was not seen in 10-day-old recipients. This age-dependent dichotomy was reproduced in a second transfer system based on an unrelated antigen artificially expressed on beta cells. We conclude that beta cell antigens are transported specifically to pancreatic lymph nodes, where they trigger reactive T cells to invade the islets. Systemic or extrapancreatic T cell priming, indicative of activation via molecular mimicry or superantigens, was not seen. Compromised presentation of beta cell antigens in the pancreatic lymph nodes of juvenile animals may be the root of a first "checkpoint" in diabetes progression.
Figures
Figure 1
Activated lymphocytes in BDC2.5 mice. (A) CD69 expression on CD4+Vβ4+ T cells from spleen (SP), ILNs, MLNs, PLNs, and IILs from a young BDC2.5 mouse. The percentage of positive cells included within the indicated region is shown for each histogram. (B) Representative biparametric CD69/CD44 and CD69/ CD62L histograms of gated CD4+ T cells from the same sources. (C) Underrepresentation of nontransgenic Vα2+ TCRs among CD69+CD4+ lymphocytes in PLNs compared with ILNs from BDC2.5 mice. Dashed line, an approximation of the percentage of Vα2+ cells within CD4+ T cells in the whole lymphoid system of the analyzed mouse (estimated from pooled data of spleen and LN T cells).
Figure 2
Temporal correlation between the activation of T cells in PLNs and islet infiltration in young BDC2.5 mice. Percentage of infiltrated islets was plotted against the percentage of CD69+ among CD4+ T cells in PLNs in BDC2.5 mice of different ages. Each dot represents an individual mouse.
Figure 3
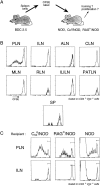
Proliferation of CFSE-labeled transferred BDC2.5 spleen cells occurs selectively in PLNs. (A) The transfer protocol: splenocytes from BDC2.5 mice are labeled with CFSE in vitro, then transferred to Cα0/NOD recipients. Proliferation of the transferred CD4+Vβ4+ T cells is visualized, a few days after transfer, as progressive decrease of labeling intensity in individual cells. (B) CFSE label 3 d after transfer to Cα0/ NOD recipients in PLNs, ILNs, axillary LNs (ALN), cervical LNs (CLN), MLNs, RLNs, iliac LNs (ILILN), parathymic LNs (PATLN), and spleen. (C) Proliferation in PLNs occurs in Cα0/NOD, RAG0/NOD, and in normal NOD recipients.
Figure 4
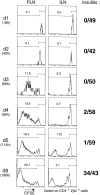
Proliferation of transferred BDC2.5 cells in the PLNs occurs before islet cell infiltration. In a representative experiment, a cohort of Cα0/NOD mice were injected with 5 × 10⁷ CFSE-labeled BDC2.5 spleen cells and subsequently analyzed for CFSE dilution in PLNs and ILNs at various times after transfer. The “proliferation index” shown for each histogram is obtained by dividing the fraction of proliferating cells by the fraction of nonproliferating cells (gates as shown). Insulitis values on right: number of infiltrated islets over the total number of islets scored.
Figure 5
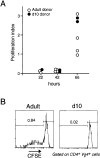
A comparison between adult and 10-d-old BDC2.5 mice as donors and recipients in the transfer model. (A) 5 × 10⁷ T cells from 10-d-old or adult BDC2.5 donors were transferred to adult Cα0/NOD recipients. The graph is a summary of several independent experiments, showing the proliferation index of CD4+Vβ4+ T cells in PLNs at different time points, calculated as for Fig. 4; each dot represents an individual mouse. (B) BDC2.5 donor T cells were transferred to adult or 10-d-old Cα0/NOD mice, as indicated (proliferation index as above).
Figure 6
Proliferation of OVA-specific CD8+ T cells in adult and 10-d-old RIP-mOVA mice. Recipients were injected with 2 × 10⁷ splenocytes from OT-I transgenic mice, and loss of CFSE by proliferation was evaluated in gated CD8+ T cells in ILNs, RLNs, and PLNs (see above) 67 h after transfer.
Similar articles
- CD8(+) T cells specific for beta cells encounter their cognate antigens in the islets of NOD mice.
Pang S, Zhang L, Wang H, Yi Z, Li L, Gao L, Zhao J, Tisch R, Katz JD, Wang B. Pang S, et al. Eur J Immunol. 2009 Oct;39(10):2716-24. doi: 10.1002/eji.200939408. Eur J Immunol. 2009. PMID: 19658094 - Diabetogenic T cells are primed both in pancreatic and gut-associated lymph nodes in NOD mice.
Jaakkola I, Jalkanen S, Hänninen A. Jaakkola I, et al. Eur J Immunol. 2003 Dec;33(12):3255-64. doi: 10.1002/eji.200324405. Eur J Immunol. 2003. PMID: 14635033 - Perfluoropolyethylene glycol–labeled BDC2.5 T cells.
Zhang H. Zhang H. 2008 Aug 8 [updated 2008 Sep 16]. In: Molecular Imaging and Contrast Agent Database (MICAD) [Internet]. Bethesda (MD): National Center for Biotechnology Information (US); 2004–2013. 2008 Aug 8 [updated 2008 Sep 16]. In: Molecular Imaging and Contrast Agent Database (MICAD) [Internet]. Bethesda (MD): National Center for Biotechnology Information (US); 2004–2013. PMID: 20641385 Free Books & Documents. Review. - Immunopathology of the human pancreas in type-I diabetes.
Richardson SJ, Willcox A, Bone AJ, Morgan NG, Foulis AK. Richardson SJ, et al. Semin Immunopathol. 2011 Jan;33(1):9-21. doi: 10.1007/s00281-010-0205-0. Epub 2010 Apr 28. Semin Immunopathol. 2011. PMID: 20424842 Review.
Cited by
- Interleukin-15 plays an essential role in the pathogenesis of autoimmune diabetes in the NOD mouse.
Bobbala D, Chen XL, Leblanc C, Mayhue M, Stankova J, Tanaka T, Chen YG, Ilangumaran S, Ramanathan S. Bobbala D, et al. Diabetologia. 2012 Nov;55(11):3010-20. doi: 10.1007/s00125-012-2675-1. Epub 2012 Aug 14. Diabetologia. 2012. PMID: 22890824 - The Autoimmunity-Associated Gene CLEC16A Modulates Thymic Epithelial Cell Autophagy and Alters T Cell Selection.
Schuster C, Gerold KD, Schober K, Probst L, Boerner K, Kim MJ, Ruckdeschel A, Serwold T, Kissler S. Schuster C, et al. Immunity. 2015 May 19;42(5):942-52. doi: 10.1016/j.immuni.2015.04.011. Epub 2015 May 12. Immunity. 2015. PMID: 25979422 Free PMC article. - Pathogenic mechanisms in type 1 diabetes: the islet is both target and driver of disease.
Graham KL, Sutherland RM, Mannering SI, Zhao Y, Chee J, Krishnamurthy B, Thomas HE, Lew AM, Kay TW. Graham KL, et al. Rev Diabet Stud. 2012 Winter;9(4):148-68. doi: 10.1900/RDS.2012.9.148. Epub 2012 Dec 28. Rev Diabet Stud. 2012. PMID: 23804258 Free PMC article. Review. - Unexpected acceleration of type 1 diabetes by transgenic expression of B7-H1 in NOD mouse peri-islet glia.
Yantha J, Tsui H, Winer S, Song A, Wu P, Paltser G, Ellis J, Dosch HM. Yantha J, et al. Diabetes. 2010 Oct;59(10):2588-96. doi: 10.2337/db09-1209. Epub 2010 Jun 3. Diabetes. 2010. PMID: 20522597 Free PMC article. - Pancreatic NOD beta cells express MHC class II protein and the frequency of I-A(g7) mRNA-expressing beta cells strongly increases during progression to autoimmune diabetes.
Walter U, Toepfer T, Dittmar KE, Kretschmer K, Lauber J, Weiss S, Servos G, Lechner O, Scherbaum WA, Bornstein SR, Von Boehmer H, Buer J. Walter U, et al. Diabetologia. 2003 Aug;46(8):1106-14. doi: 10.1007/s00125-003-1164-y. Epub 2003 Jul 10. Diabetologia. 2003. PMID: 12856083
References
- Bach JF. Insulin-dependent diabetes mellitus as an autoimmune disease. Endocr Rev. 1994;15:516–542. - PubMed
- Tisch R, McDevitt H. Insulin-dependent diabetes mellitus. Cell. 1996;85:291–297. - PubMed
- Bach JF, Mathis D. 70th forum in immunology: the NOD mouse. Res Immunol. 1997;148:285–286. - PubMed
- Leslie RD, Elliott RB. Early environmental events as a cause of IDDM. Evidence and implications. Diabetes. 1994;43:843–850. - PubMed
- Herrath MG, Holz A, Homann D, Oldstone MBA. Role of viruses in type I diabetes. Semin Immunol. 1998;10:87–100. - PubMed
Publication types
MeSH terms
Substances
LinkOut - more resources
Full Text Sources
Other Literature Sources
Medical
Molecular Biology Databases


