Mitochondrial release of caspase-2 and -9 during the apoptotic process - PubMed (original) (raw)
Mitochondrial release of caspase-2 and -9 during the apoptotic process
S A Susin et al. J Exp Med. 1999.
Abstract
The barrier function of mitochondrial membranes is perturbed early during the apoptotic process. Here we show that the mitochondria contain a caspase-like enzymatic activity cleaving the caspase substrate Z-VAD.afc, in addition to three biological activities previously suggested to participate in the apoptotic process: (a) cytochrome c; (b) an apoptosis-inducing factor (AIF) which causes isolated nuclei to undergo apoptosis in vitro; and (c) a DNAse activity. All of these factors, which are biochemically distinct, are released upon opening of the permeability transition (PT) pore in a coordinate, Bcl-2-inhibitable fashion. Caspase inhibitors fully neutralize the Z-VAD.afc-cleaving activity, have a limited effect on the AIF activity, and have no effect at all on the DNase activities. Purification of proteins reacting with the biotinylated caspase substrate Z-VAD, immunodetection, and immunodepletion experiments reveal the presence of procaspase-2 and -9 in mitochondria. Upon induction of PT pore opening, these procaspases are released from purified mitochondria and become activated. Similarly, upon induction of apoptosis, both procaspases redistribute from the mitochondrion to the cytosol and are processed to generate enzymatically active caspases. This redistribution is inhibited by Bcl-2. Recombinant caspase-2 and -9 suffice to provoke full-blown apoptosis upon microinjection into cells. Altogether, these data suggest that caspase-2 and -9 zymogens are essentially localized in mitochondria and that the disruption of the outer mitochondrial membrane occurring early during apoptosis may be critical for their subcellular redistribution and activation.
Figures
Figure 1
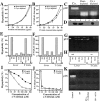
Three biological activities not requiring cytochrome c are coordinately released into the supernatant of mitochondria. (A) AIF activity not requiring cytochrome c. Supernatants of Atr-treated liver mitochondria were immunodepleted of cytochrome c or sham-immunodepleted using an anti–IL-2 antibody and tested for their capacity to induce hypoploidy in isolated HeLa nuclei in a cell-free system of apoptosis. (B) A Z-VAD.afc– cleaving activity not relying on the presence of cytochrome c. The same supernatants as in A were incubated with the fluorogenic caspase substrate Z-VAD. afc, and afc-dependent fluorescence was measured. (C) A DNAse activity not requiring cytochrome c. The mitochondrial supernatant (60 μg/ml) was incubated with purified supercoiled plasmid DNA (pUC), followed by horizontal agarose gel electrophoresis and detection of DNA with ethidium bromide. (D) Control of cytochrome c depletion by immunoblot. Supernatants of control mitochondria (Co.) or Atr-treated mitochondria (lanes 1–6) were left untreated (lane 1) or subjected to immunodepletion with antibodies specific for IL-2 (lane 2) or cytochrome c (lane 3). In addition, the immunocomplexes immobilized by beads were analyzed for the presence of cytochrome c (lane 4, anti–IL-2; lane 5, anti-cytochrome c; lane 6, no antibody). (E–H) Mitochondria purified from liver or T cell hybridoma cells expressing Bcl-2 or a Neo control vector were treated with the indicated combination of Atr, BA, and/or CsA and tested for AIF activity (E), Z-VAD.afc–cleaving activity (F), DNAse activity (G), or cytochrome c (H). (I–K) Inhibitory effect of Z-VAD.fmk. The supernatant of Atr-treated hepatocyte mitochondria was treated with Z-VAD.fmk (50 μM, 15 min) and tested for AIF activity (I) and for Z-VAD.afc–cleaving activity at two different protein concentrations (J) and for DNAse activity (K) at 40 μg protein/ml. In addition, the effect of ATA (5 mM) on the DNAse activity was assessed (K).
Figure 2
Overview of the FPLC separation procedure. Mitochondrial intermembrane proteins were sequentially applied to MiniS cation exchange, MiniQ column anion exchange, or phenyl superose hydrophobicity columns as detailed in Materials and Methods and in Results. This methodology allows for the separation of all biological activities analyzed in this paper.
Figure 3
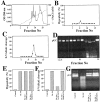
Selective retention of AIF activity on a MiniS cation exchange column. (A) Intermembrane proteins soluble in 50 mM Hepes-KOH (pH 6.75) were applied to a MiniS FPLC column and eluted by 25 mM NaCl. Fractions (40 μl) were recovered for further biological testing as in the legend to Fig. 1. Data are shown for two different experiments, one in which intermembrane proteins were obtained after addition of Atr (5 mM, 30 min; thin line) and one in which intermembrane proteins were obtained after preincubation of mitochondria with 100 μM Z-VAD.fmk for 15 min (thick line). (B) Profile of AIF activity obtained in the presence or absence of 100 μM Z-VAD.fmk. Z-VAD.fmk was either added to the mitochondria before treatment with Atr (▴) or it was added to the supernatant (Sn) of mitochondria after treatment with Atr (□). (C) Z-VAD.afc–cleaving activity measured in the presence or absence of Z-VAD.fmk added to the supernatant. (D) DNAse activity. Results are representative of ten independent experiments.
Figure 4
Biochemical and functional separation of biological activities. (A) The flow-through of the MiniS column shown in Fig. 3 (fractions 2–4) was recovered in 50 mM Tris-HCl (pH 8.5), applied to a MiniQ anion exchange column, and eluted by increasing the concentration of NaCl in fractions of 150 μl. These fractions were subjected to further evaluation as in the legend to Fig. 1, namely quantitation of AIF activity (B), Z-VAD.afc–cleaving activity (C), and DNAse activity (D). The numbers in B–D refer to the fractions eluted from the MiniQ column in A. Alternatively, supernatants of Atr-treated mitochondria were tested for AIF activity (E), Z-VAD.afc– cleaving activity (F), or DNAse activity (G) after addition of 1 mM ZnCl2 or 5 mM EGTA. Results are representative of five independent determinations.
Figure 5
Identification of the Z-VAD– binding activity as caspase-2 and -9. (A) Proteins reacting with biotinylated VAD.fmk in the intermembrane space of liver mitochondria. The supernatant of control mitochondria (lane 1) or of Atr-treated mitochondria (lanes 2 and 3), the flow-through of the MiniS column (see Fig. 2 and Fig. 3 A; lanes 4 and 5), purified AIF (lane 6), or the Z-VAD.afc–cleaving activity eluting at 280 mM from the MiniQ column (see Fig. 2 and Fig. 4 A; lanes 7 and 8) were allowed to react with biotinylated VAD.fmk, either without pretreatment (lanes 1, 2, 4, 6, and 7) or after preincubation with Z-VAD.fmk (lanes 3, 5, and 8). Note that Z-VAD.fmk has been added to mitochondria before Atr (line 3). In addition, the proteins reacting with biotinylated VAD.fmk retained on an avidin column were purified (lane 9). These proteins, which contained approximately similar levels of Z-VAD.afc–cleaving activity (10 U) or ∼100 ng purified protein (lane 6) were separated by SDS-PAGE, blotted onto nitrocellulose, and subjected to the detection of biotinylated VAD.fmk using an avidin-based detection system. (B and C) The same blot as in A was subjected to immunodetection with antibodies specific for caspase-2 (B) or -9 (C). (D and E) Mitochondria from different organs were purified and cultured for 30 min in the presence or absence of 5 mM Atr, followed by immunoblot detection of caspase-2 (D) or -9 (E). Results are representative of two to four independent experiments. (F and G) Specificity control of caspase-2– and caspase-9–specific antisera. Recombinant caspase-2 (lane 1), -3 (lane 2), or -9 (lane 3) was immunoblotted (100 ng/lane), followed by immunodetection with the caspase-2 (F) or caspase-9 (G)–specific antibody. Similarly, caspase-2– and caspase-9–specific antibodies fail to recognize caspase-6 and -7 (not shown).
Figure 6
Submitochondrial localization of caspase-2 and -9. Purified mitochondria were either lysed by osmotic shock (total preparation, lane 1) or were subjected to fractionation into matrix (lanes 2 and 6), inner membrane (lanes 3 and 7), intermembrane (lanes 4 and 8), or outer membrane (lanes 5 and 9) proteins, in the absence (lanes 2–5) or presence (lanes 6–9) of 100 μM Z-VAD.fmk throughout each single step of the fractionation procedure. Thereafter, equivalent amounts of protein (15 μg/lane) were subjected to immunoblot detection of caspase-2 (A) and -9 (B). A representative immunoelectron micrograph of mitochondria labeled with a specific caspase-9 antibody is also shown (C).
Figure 7
Neutralization of the Z-VAD.afc–cleaving activity by immunodepletion of caspase-2 and -9. Soluble intermembrane proteins were depleted of caspase-2 and/or -9 using specific antisera, and the AIF activity (A) or Z-VAD.afc-cleaving activity (B) was assessed. Typical results out of three experiments are shown.
Figure 8
Apoptosis induction by microinjection of recombinant caspases. Rat-1 fibroblasts were left untreated or cultured with etoposide (1 μM, 6 h), in the absence or presence of Z-VAD.fmk (100 μM), to obtain a positive or negative control of apoptotic morphology, respectively. Alternatively, cells pretreated with Z-VAD.fmk (100 μM, 60 min) or left untreated were microinjected with buffer only or with recombinant caspase-2 or -9 (3 U/μl). Microinjected viable cells (100–200 per session, two to five independent sessions of injection) could be identified because the injectate contained FITC-dextran (0.25% [wt/vol], green fluorescence; not shown). Microphotographs representing the dominant (>70%) phenotype of microinjected cells stained either with Hoechst 33342 (blue fluorescence, A) or with Annexin V (red fluorescence, B) are shown after 90 min of culture. Z-VAD. fmk pretreatment prevented phosphatidylserine exposure induced by etoposide, caspase-2, or caspase-9, as measured with Annexin V (not shown).
Figure 9
Loss of subcellular compartmentalization of cytochrome c, caspase-2, and caspase-9. Rat-1 cells were left untreated or were cultured in the presence of staurosporine (4 h, 1 μM), fixed, and stained to determine the subcellular distribution of the indicated molecules by indirect immunofluorescence analysis.
Figure 10
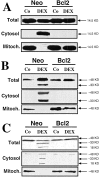
Redistribution of caspase-2 and -9 from the mitochondrion. T cell hybridoma cells transfected with a Neo control vector or with Bcl-2 were cultured in the absence or presence of 1 μM DEX, followed by subcellular fractionation, as described in Materials and Methods. Equivalent amounts of proteins were subjected to immunoblot analysis in order to determine the subcellular localization and activation of cytochrome c (A), caspase-2 (B), or caspase-9 (C). Results are representative of three independent determinations.
Similar articles
- Bax-induced caspase activation and apoptosis via cytochrome c release from mitochondria is inhibitable by Bcl-xL.
Finucane DM, Bossy-Wetzel E, Waterhouse NJ, Cotter TG, Green DR. Finucane DM, et al. J Biol Chem. 1999 Jan 22;274(4):2225-33. doi: 10.1074/jbc.274.4.2225. J Biol Chem. 1999. PMID: 9890985 - Molecular characterization of mitochondrial apoptosis-inducing factor.
Susin SA, Lorenzo HK, Zamzami N, Marzo I, Snow BE, Brothers GM, Mangion J, Jacotot E, Costantini P, Loeffler M, Larochette N, Goodlett DR, Aebersold R, Siderovski DP, Penninger JM, Kroemer G. Susin SA, et al. Nature. 1999 Feb 4;397(6718):441-6. doi: 10.1038/17135. Nature. 1999. PMID: 9989411 - Mitochondrio-nuclear translocation of AIF in apoptosis and necrosis.
Daugas E, Susin SA, Zamzami N, Ferri KF, Irinopoulou T, Larochette N, Prévost MC, Leber B, Andrews D, Penninger J, Kroemer G. Daugas E, et al. FASEB J. 2000 Apr;14(5):729-39. FASEB J. 2000. PMID: 10744629 - Mitochondria, the killer organelles and their weapons.
Ravagnan L, Roumier T, Kroemer G. Ravagnan L, et al. J Cell Physiol. 2002 Aug;192(2):131-7. doi: 10.1002/jcp.10111. J Cell Physiol. 2002. PMID: 12115719 Review. - Apoptosis-inducing factor (AIF): a novel caspase-independent death effector released from mitochondria.
Candé C, Cohen I, Daugas E, Ravagnan L, Larochette N, Zamzami N, Kroemer G. Candé C, et al. Biochimie. 2002 Feb-Mar;84(2-3):215-22. doi: 10.1016/s0300-9084(02)01374-3. Biochimie. 2002. PMID: 12022952 Review.
Cited by
- Regulation of the intrinsic apoptosis pathway by reactive oxygen species.
Wu CC, Bratton SB. Wu CC, et al. Antioxid Redox Signal. 2013 Aug 20;19(6):546-58. doi: 10.1089/ars.2012.4905. Epub 2012 Oct 25. Antioxid Redox Signal. 2013. PMID: 22978471 Free PMC article. Review. - Procaspase-9 is attached to the mitochondrial outer membrane in the early stages of apoptosis.
Milisav I, Suput D. Milisav I, et al. Cell Mol Biol Lett. 2007;12(4):509-22. doi: 10.2478/s11658-007-0020-3. Epub 2007 Apr 28. Cell Mol Biol Lett. 2007. PMID: 17468838 Free PMC article. - Defective TNF-alpha-mediated hepatocellular apoptosis and liver damage in acidic sphingomyelinase knockout mice.
García-Ruiz C, Colell A, Marí M, Morales A, Calvo M, Enrich C, Fernández-Checa JC. García-Ruiz C, et al. J Clin Invest. 2003 Jan;111(2):197-208. doi: 10.1172/JCI16010. J Clin Invest. 2003. PMID: 12531875 Free PMC article. - W196 and the _β_-Hairpin Motif Modulate the Redox Switch of Conformation and the Biomolecular Interaction Network of the Apoptosis-Inducing Factor.
Romero-Tamayo S, Laplaza R, Velazquez-Campoy A, Villanueva R, Medina M, Ferreira P. Romero-Tamayo S, et al. Oxid Med Cell Longev. 2021 Jan 15;2021:6673661. doi: 10.1155/2021/6673661. eCollection 2021. Oxid Med Cell Longev. 2021. PMID: 33510840 Free PMC article. - Increased expression but not sensitivity to Fas/CD95 in glioblastoma cells depleted of mitochondrial DNA.
Liang BC. Liang BC. Exp Ther Med. 2010 Nov;1(6):1049-1055. doi: 10.3892/etm.2010.158. Epub 2010 Sep 29. Exp Ther Med. 2010. PMID: 22993639 Free PMC article.
References
- Thompson CB. Apoptosis in the pathogenesis and treatment of disease. Science. 1995;267:1456–1462. - PubMed
- Kroemer G, Petit PX, Zamzami N, Vayssière J-L, Mignotte B. The biochemistry of apoptosis. FASEB J. 1995;9:1277–1287. - PubMed
- Jacobson MD, Weil M, Raff MC. Programmed cell death in animal development. Cell. 1997;88:347–354. - PubMed
Publication types
MeSH terms
Substances
LinkOut - more resources
Full Text Sources
Other Literature Sources
Molecular Biology Databases


