Mechanisms for induction of acquired host immunity by neutrophil peptide defensins - PubMed (original) (raw)
Mechanisms for induction of acquired host immunity by neutrophil peptide defensins
J W Lillard Jr et al. Proc Natl Acad Sci U S A. 1999.
Abstract
Human neutrophil peptide (HNP) defensins were studied to determine their potential effects on adaptive mucosal immunity. Intranasal delivery of HNPs plus ovalbumin (OVA) enhanced OVA-specific serum IgG antibody (Ab) responses. However, OVA-specific IgA Abs were not induced in mucosal secretions or in serum. CD4(+) T cells of intranasally immunized mice displayed higher OVA-specific proliferative responses and elevated production of interferon gamma, interleukin (IL) 5, IL-6, and IL-10 when compared with control groups receiving OVA alone. In vitro, HNPs also enhanced both proliferative responses and T helper (Th) cytokine secretion profiles of CD3epsilon-stimulated spleen- and Peyer's patch-derived naive CD4(+) T cells. HNPs modulated the expression of costimulatory molecules by lipopolysaccharide- or CD3epsilon-stimulated splenic and Peyer's patch B or T cell populations, respectively. These studies show that defensins enhance systemic IgG, but not IgA, Ab responses through help provided by CD4(+) Th1- and Th2-type cytokines and foster B and T cell interactions to link innate immunity with the adaptive immune system.
Figures
Figure 1
Kinetics of serum OVA-specific IgA, IgM, and IgG and IgG subclass Ab responses. After anesthesia, groups of C57BL/6 mice were intranasally immunized three times on days 0, 7, and 14 with 50 μg of OVA and 0.0 or 1.0 μg of HNPs in 10 μl of PBS. The data presented are the mean Ab titers ± SEM of these experiments. Experimental groups consisted of five mice, and studies were repeated three times. The data distribution of OVA-specific IgA, IgM, and IgG serum Abs collected on day 14 (A) and day 21 (B) was determined by ELISA. The profile of Ag-specific IgG subclasses of serum samples taken on day 14 (C) and day 21 (D) also was determined by ELISA. The data presented are the mean Ab titer ± SEM. Asterisks indicate statistically significant differences (∗, P < 0.05; ∗∗, P < 0.01) relative to Ab titers of mice immunized with OVA alone.
Figure 2
Numbers of Ag-specific AFCs in peripheral and mucosal tissues after intranasal immunization with HNPs and OVA. After anesthesia, groups of C57BL/6 mice were intranasally immunized on days 0, 7, and 14 with 50 μg of OVA and 0.0 or 1.0 μg of HNPs in 10 μl of PBS. Experimental groups consisted of five mice, and studies were repeated three times. OVA-specific IgA, IgM, and IgG AFCs present in cervical lymph nodes, lower respiratory tract and associated lymphoid tissues, Peyer’s patches, mesenteric lymph nodes, and spleens were determined by ELISPOT analysis. The data presented are the mean AFCs ± SEM 1 week after the last immunization of these experiments. Asterisks indicate statistically significant differences (∗, P < 0.05; ∗∗, P < 0.01) relative to Ab titers of mice immunized with OVA alone.
Figure 3
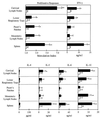
OVA-specific proliferation and induction of Th1- and Th2-type cytokine secretion by spleen- and mucosa-derived CD4+ T cells. After anesthesia, groups of C57BL/6 mice were intranasally immunized on days 0, 7, and 14 with 50 μg of OVA and 0.0 (empty boxes) or 1.0 μg (filled boxes) of HNPs in 10 μl of PBS. One week after the last immunization, lower respiratory tract, Peyer’s patches, cervical, mesenteric, and spleen lymphoid tissue-derived CD4+ T cells were purified and cultured at a density of 5 × 10⁶ cells/ml with 500 μg/ml of OVA for 3 days with T-cell-depleted and -irradiated splenic feeder cells (1 × 10⁶ cells/ml) in complete medium. Experimental groups consisted of five mice, and studies were repeated three times. Proliferation was measured by 3H-thymidine incorporation. The stimulation index corresponds to the cpm of cell cultures containing OVA divided by the cpm of cultures with no additions. The data presented are the mean stimulation index ± SEM. ∗ indicate statistically significant differences (∗, P < 0.05; ∗∗, P < 0.01) relative to the stimulation index of mice immunized with OVA alone. Cytokine protein production of these cultured supernatants was determined by ELISA. The data presented are the mean cytokine levels (pg/ml) ± SEM in each group. Asterisks indicate statistically significant differences (∗, P < 0.05; ∗∗, P < 0.01) relative to cytokine levels of mice immunized with OVA alone.
Figure 4
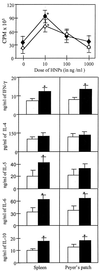
Anti-CD3ɛ and HNP-mediated proliferative responses and cytokine secretion by naive CD4+ T lymphocytes. Spleen- (⧫) or Peyer’s patch-derived (◊) cells were isolated from naive mice and stimulated in vitro in rat anti-mouse CD3ɛ-coated 96-well plates with 0, 10, 100, or 1,000 ng/ml of HNPs. Cytokine protein production of cultured supernatants containing a suboptimal dose of anti-mouse CD3 mAb and 0 (□) or 10 ng/ml (■) of HNPs was determined by ELISA. Experimental studies were repeated three times, and the data presented are the mean proliferation ± SEM measured by 3H-thymidine incorporation and illustrated as cpm or the mean cytokine levels ± SEM in each group. Asterisks indicate the statistically significant differences (P < 0.05) relative to the cpm of or cytokine levels of CD4+ T cells incubated without HNPs.
Similar articles
- Interleukin 12 and innate molecules for enhanced mucosal immunity.
Boyaka PN, Lillard JW Jr, McGhee J. Boyaka PN, et al. Immunol Res. 1999;20(3):207-17. doi: 10.1007/BF02790404. Immunol Res. 1999. PMID: 10741861 Review. - RANTES potentiates antigen-specific mucosal immune responses.
Lillard JW Jr, Boyaka PN, Taub DD, McGhee JR. Lillard JW Jr, et al. J Immunol. 2001 Jan 1;166(1):162-9. doi: 10.4049/jimmunol.166.1.162. J Immunol. 2001. PMID: 11123289 - Release from Th1-type immune tolerance in spleen and enhanced production of IL-5 in Peyer's patch by cholera toxin B induce the glomerular deposition of IgA.
Yamanaka T, Tamauchi H, Suzuki Y, Suzuki H, Horikoshi S, Terashima M, Iwabuchi K, Habu S, Okumura K, Tomino Y. Yamanaka T, et al. Immunobiology. 2016 Apr;221(4):577-85. doi: 10.1016/j.imbio.2015.12.001. Epub 2015 Dec 15. Immunobiology. 2016. PMID: 26719095 - Peyer's patches are required for oral tolerance to proteins.
Fujihashi K, Dohi T, Rennert PD, Yamamoto M, Koga T, Kiyono H, McGhee JR. Fujihashi K, et al. Proc Natl Acad Sci U S A. 2001 Mar 13;98(6):3310-5. doi: 10.1073/pnas.061412598. Proc Natl Acad Sci U S A. 2001. PMID: 11248075 Free PMC article. - Protective mucosal immunity in aging is associated with functional CD4+ T cells in nasopharyngeal-associated lymphoreticular tissue.
Hagiwara Y, McGhee JR, Fujihashi K, Kobayashi R, Yoshino N, Kataoka K, Etani Y, Kweon MN, Tamura S, Kurata T, Takeda Y, Kiyono H, Fujihashi K. Hagiwara Y, et al. J Immunol. 2003 Feb 15;170(4):1754-62. doi: 10.4049/jimmunol.170.4.1754. J Immunol. 2003. PMID: 12574339
Cited by
- Defensins as anti-inflammatory compounds and mucosal adjuvants.
Kohlgraf KG, Pingel LC, Dietrich DE, Brogden KA. Kohlgraf KG, et al. Future Microbiol. 2010 Jan;5(1):99-113. doi: 10.2217/fmb.09.104. Future Microbiol. 2010. PMID: 20020832 Free PMC article. Review. - The Alarmin HMGN1 contributes to antitumor immunity and is a potent immunoadjuvant.
Wei F, Yang D, Tewary P, Li Y, Li S, Chen X, Howard OM, Bustin M, Oppenheim JJ. Wei F, et al. Cancer Res. 2014 Nov 1;74(21):5989-98. doi: 10.1158/0008-5472.CAN-13-2042. Epub 2014 Sep 9. Cancer Res. 2014. PMID: 25205103 Free PMC article. - Gene Expression Deconvolution for Uncovering Molecular Signatures in Response to Therapy in Juvenile Idiopathic Arthritis.
Cui A, Quon G, Rosenberg AM, Yeung RS, Morris Q; BBOP Study Consortium. Cui A, et al. PLoS One. 2016 May 31;11(5):e0156055. doi: 10.1371/journal.pone.0156055. eCollection 2016. PLoS One. 2016. PMID: 27244050 Free PMC article. - Cationic host defence peptides: multifaceted role in immune modulation and inflammation.
Choi KY, Chow LN, Mookherjee N. Choi KY, et al. J Innate Immun. 2012;4(4):361-70. doi: 10.1159/000336630. Epub 2012 Mar 14. J Innate Immun. 2012. PMID: 22739631 Free PMC article. Review. - Granulysin-derived peptides demonstrate antimicrobial and anti-inflammatory effects against Propionibacterium acnes.
McInturff JE, Wang SJ, Machleidt T, Lin TR, Oren A, Hertz CJ, Krutzik SR, Hart S, Zeh K, Anderson DH, Gallo RL, Modlin RL, Kim J. McInturff JE, et al. J Invest Dermatol. 2005 Aug;125(2):256-63. doi: 10.1111/j.0022-202X.2005.23805.x. J Invest Dermatol. 2005. PMID: 16098035 Free PMC article.
References
- Fleischmann J, Church J A, Lehrer R I. Am J Med Sci. 1986;291:334–341. - PubMed
- Harwig S S, Park A S, Lehrer R I. Blood. 1992;79:1532–1537. - PubMed
Publication types
MeSH terms
Substances
Grants and funding
- AI 43197/AI/NIAID NIH HHS/United States
- DK 44240/DK/NIDDK NIH HHS/United States
- R01 AI018958/AI/NIAID NIH HHS/United States
- AI 18958/AI/NIAID NIH HHS/United States
- P01 DK044240/DK/NIDDK NIH HHS/United States
- R01 AI043197/AI/NIAID NIH HHS/United States
LinkOut - more resources
Full Text Sources
Other Literature Sources
Research Materials
Miscellaneous


