Biochemical characterization of fungal phytases (myo-inositol hexakisphosphate phosphohydrolases): catalytic properties - PubMed (original) (raw)
Biochemical characterization of fungal phytases (myo-inositol hexakisphosphate phosphohydrolases): catalytic properties
M Wyss et al. Appl Environ Microbiol. 1999 Feb.
Abstract
Supplementation with phytase is an effective way to increase the availability of phosphorus in seed-based animal feed. The biochemical characteristics of an ideal phytase for this application are still largely unknown. To extend the biochemical characterization of wild-type phytases, the catalytic properties of a series of fungal phytases, as well as Escherichia coli phytase, were determined. The specific activities of the fungal phytases at 37 degreesC ranged from 23 to 196 U. (mg of protein)-1, and the pH optima ranged from 2.5 to 7.0. When excess phytase was used, all of the phytases were able to release five phosphate groups of phytic acid (myo-inositol hexakisphosphate), which left myo-inositol 2-monophosphate as the end product. A combination consisting of a phytase and Aspergillus niger pH 2.5 acid phosphatase was able to liberate all six phosphate groups. When substrate specificity was examined, the A. niger, Aspergillus terreus, and E. coli phytases were rather specific for phytic acid. On the other hand, the Aspergillus fumigatus, Emericella nidulans, and Myceliophthora thermophila phytases exhibited considerable activity with a broad range of phosphate compounds, including phenyl phosphate, p-nitrophenyl phosphate, sugar phosphates, alpha- and beta-glycerophosphates, phosphoenolpyruvate, 3-phosphoglycerate, ADP, and ATP. Both phosphate liberation kinetics and a time course experiment in which high-performance liquid chromatography separation of the degradation intermediates was used showed that all of the myo-inositol phosphates from the hexakisphosphate to the bisphosphate were efficiently cleaved by A. fumigatus phytase. In contrast, phosphate liberation by A. niger or A. terreus phytase decreased with incubation time, and the myo-inositol tris- and bisphosphates accumulated, suggesting that these compounds are worse substrates than phytic acid is. To test whether broad substrate specificity may be advantageous for feed application, phosphate liberation kinetics were studied in vitro by using feed suspensions supplemented with 250 or 500 U of either A. fumigatus phytase or A. niger phytase (Natuphos) per kg of feed. Initially, phosphate liberation was linear and identical for the two phytases, but considerably more phosphate was liberated by the A. fumigatus phytase than by the A. niger phytase at later stages of incubation.
Figures
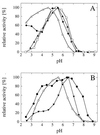
FIG. 1
pH optimum curves for wild-type phytases. The data are expressed as percentages of the maximal activity. (A) Symbols: ⧫, A. niger phytase; □, A. terreus CBS phytase; ▴, A. terreus 9A1 phytase; ▵, E. coli phytase; (B) Symbols: •, A. fumigatus phytase; ▾, E. nidulans phytase; (◊) M. thermophila phytase.
FIG. 2
Substrate specificities of wild-type phytases and A. niger pH 2.5 acid phosphatase. All substrates were used at a concentration of 5 mM. 1, phytic acid; 2, _p_-nitrophenyl phosphate; 3, phenyl phosphate; 4, fructose 1,6-bisphosphate; 5, fructose 6-phosphate; 6, glucose 6-phosphate; 7, ribose 5-phosphate; 8, α-glycerophosphate; 9, β-glycerophosphate; 10, 3-phosphoglycerate; 11, phosphoenolpyruvate; 12, AMP; 13, ADP; 14, ATP. (A) A. fumigatus phytase. (B) E. nidulans phytase. (C) M. thermophila phytase. (D) A. niger pH 2.5 acid phosphatase. (E) A. niger pH 2.5 acid phosphatase (measurements obtained at pH 2.5 instead of pH 5.0). (F) A. niger phytase. (G) A. terreus CBS phytase. (H) A. terreus 9A1 phytase. (I) E. coli phytase.
FIG. 3
Energetically most favorable conformation of phytic acid (_myo_-inositol hexakisphosphate). The numbering of the carbon atoms is the numbering for the
d
-configuration.
FIG. 4
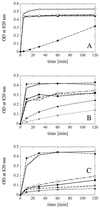
Phytic acid (A), _myo_-inositol 1-monophosphate (B), and _myo_-inositol 2-monophosphate (C) degradation kinetics observed with a limiting concentration of substrate (0.2 or 0.75 mM) and excess enzyme (approximately 0.5 U/ml). Symbols: ○, A. fumigatus phytase plus A. niger pH 2.5 acid phosphatase; •, A. fumigatus phytase; ▾, E. nidulans phytase; ▴, A. niger phytase; ▵, A. terreus CBS phytase; □, M. thermophila phytase; ⧫, A. niger pH 2.5 acid phosphatase. OD, optical density.
FIG. 5
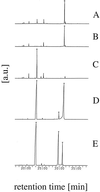
Gas chromatography analysis of the end products of phytic acid degradation. Two-hour samples from the incubations shown in Fig. 4 (A through C) or commercially available reference compounds (D and E) were analyzed. (A) A. fumigatus phytase. (B) A. niger phytase. (C) A. fumigatus phytase plus A. niger pH 2.5 acid phosphatase. (D) _myo_-Inositol plus _myo_-inositol 2-monophosphate. (E) _myo_-Inositol plus _myo_-inositol 1-monophosphate. a.u., arbitrary units.
FIG. 6
HPLC analysis of phytic acid degradation kinetics. (A) A. fumigatus phytase (0.015 U/ml). (B) E. nidulans phytase (0.025 U/ml). (C) M. thermophila phytase (0.05 U/ml). (D) A. niger phytase (0.075 U/ml). (E) A. terreus CBS phytase (0.2 U/ml). (F) E. coli phytase (0.5 U/ml). Symbols: ■, _myo_-inositol hexakisphosphate; ▵, _myo_-inositol pentakisphosphate; •, _myo_-inositol tetrakisphosphate; □, _myo_-inositol trisphosphate; ▴, _myo_-inositol bisphosphate; ○, _myo_-inositol monophosphate. Note that the initial activities used for the different phytases were different in order to get degradation of phytic acid down to the monophosphate stage within 90 min.
FIG. 7
Kinetics of phosphate liberation from phytic acid catalyzed by different wild-type phytases. The phytase preparations were adjusted so that they had identical initial reaction rates. For the phytic acid concentration used (0.2 mM) an optical density at 820 nm of ∼0.55 corresponded to hydrolysis of five of the six phosphomonoester bonds. Symbols: •, A. fumigatus phytase; ▾, E. nidulans phytase; □, M. thermophila phytase; ▴, A. niger phytase; ▵, A. terreus CBS phytase; ■, A. terreus 9A1 phytase. OD, optical density.
FIG. 8
In vitro phosphate liberation from animal feed. Autoclaved feed samples were resuspended in 200 mM sodium acetate (pH 5.0) and incubated for various periods of time at 37°C; the samples were either not supplemented (□) or supplemented with 250 U of A. fumigatus phytase per kg of feed (•) or 250 U of A. niger phytase per kg of feed (▵). OD, optical density.
Similar articles
- Biophysical characterization of fungal phytases (myo-inositol hexakisphosphate phosphohydrolases): molecular size, glycosylation pattern, and engineering of proteolytic resistance.
Wyss M, Pasamontes L, Friedlein A, Rémy R, Tessier M, Kronenberger A, Middendorf A, Lehmann M, Schnoebelen L, Röthlisberger U, Kusznir E, Wahl G, Müller F, Lahm HW, Vogel K, van Loon AP. Wyss M, et al. Appl Environ Microbiol. 1999 Feb;65(2):359-66. doi: 10.1128/AEM.65.2.359-366.1999. Appl Environ Microbiol. 1999. PMID: 9925554 Free PMC article. - Optimization of the catalytic properties of Aspergillus fumigatus phytase based on the three-dimensional structure.
Tomschy A, Tessier M, Wyss M, Brugger R, Broger C, Schnoebelen L, van Loon AP, Pasamontes L. Tomschy A, et al. Protein Sci. 2000 Jul;9(7):1304-11. doi: 10.1110/ps.9.7.1304. Protein Sci. 2000. PMID: 10933495 Free PMC article. - Activity of Escherichia coli, Aspergillus niger, and Rye Phytase toward Partially Phosphorylated myo-Inositol Phosphates.
Greiner R. Greiner R. J Agric Food Chem. 2017 Nov 8;65(44):9603-9607. doi: 10.1021/acs.jafc.7b03897. Epub 2017 Oct 31. J Agric Food Chem. 2017. PMID: 29052415 - Biochemical properties and substrate specificities of alkaline and histidine acid phytases.
Oh BC, Choi WC, Park S, Kim YO, Oh TK. Oh BC, et al. Appl Microbiol Biotechnol. 2004 Jan;63(4):362-72. doi: 10.1007/s00253-003-1345-0. Epub 2003 Oct 28. Appl Microbiol Biotechnol. 2004. PMID: 14586576 Review. - Molecular characterization, physicochemical properties, known and potential applications of phytases: An overview.
Rao DE, Rao KV, Reddy TP, Reddy VD. Rao DE, et al. Crit Rev Biotechnol. 2009;29(2):182-98. doi: 10.1080/07388550902919571. Crit Rev Biotechnol. 2009. PMID: 19514894 Review.
Cited by
- Isolation of a thermostable acid phytase from Aspergillus niger UFV-1 with strong proteolysis resistance.
Monteiro PS, Guimarães VM, de Melo RR, de Rezende ST. Monteiro PS, et al. Braz J Microbiol. 2015 Mar 1;46(1):251-60. doi: 10.1590/S1517-838220120037. eCollection 2015 Mar. Braz J Microbiol. 2015. PMID: 26221114 Free PMC article. - Phytate-Induced Dose-Response Auto-Activation of Enzyme in Commercial Recombinant Phytase From Escherichia coli.
Naghdi E, Moosavi-Nejad Z, Gholamhossein Goudarzi B, Soudi MR. Naghdi E, et al. Iran J Biotechnol. 2023 Jan 1;21(1):e3315. doi: 10.30498/ijb.2022.334455.3315. eCollection 2023 Jan. Iran J Biotechnol. 2023. PMID: 36811107 Free PMC article. - Fungal phytases: from genes to applications.
Corrêa TLR, de Araújo EF. Corrêa TLR, et al. Braz J Microbiol. 2020 Sep;51(3):1009-1020. doi: 10.1007/s42770-020-00289-y. Epub 2020 May 14. Braz J Microbiol. 2020. PMID: 32410091 Free PMC article. Review. - Cloning, Sequencing, and In Silico Analysis of β-Propeller Phytase Bacillus licheniformis Strain PB-13.
Kumar V, Singh G, Sangwan P, Verma AK, Agrawal S. Kumar V, et al. Biotechnol Res Int. 2014;2014:841353. doi: 10.1155/2014/841353. Epub 2014 Apr 24. Biotechnol Res Int. 2014. PMID: 24864215 Free PMC article. - Characterisation of a soil MINPP phytase with remarkable long-term stability and activity from Acinetobacter sp.
Rix GD, Sprigg C, Whitfield H, Hemmings AM, Todd JD, Brearley CA. Rix GD, et al. PLoS One. 2022 Aug 31;17(8):e0272015. doi: 10.1371/journal.pone.0272015. eCollection 2022. PLoS One. 2022. PMID: 36044476 Free PMC article.
References
- Cosgrove D J. Inositol phosphates. Their chemistry, biochemistry and physiology. Studies in organic chemistry. Vol. 4. Amsterdam, The Netherlands: Elsevier Scientific Publishing Co.; 1980.
- Greiner R, Konietzny U, Jany K-D. Purification and characterization of two phytases from Escherichia coli. Arch Biochem Biophys. 1993;303:107–113. - PubMed
- Greiner R, Haller E, Konietzny U, Jany K-D. Purification and characterization of a phytase from Klebsiella terrigena. Arch Biochem Biophys. 1997;341:201–206. - PubMed
MeSH terms
Substances
LinkOut - more resources
Full Text Sources
Other Literature Sources
Molecular Biology Databases
Research Materials


