The kinetics of exocytosis and endocytosis in the synaptic terminal of goldfish retinal bipolar cells - PubMed (original) (raw)
The kinetics of exocytosis and endocytosis in the synaptic terminal of goldfish retinal bipolar cells
G Neves et al. J Physiol. 1999.
Abstract
1. The kinetics of exocytosis and endocytosis were studied in the giant synaptic terminal of depolarizing bipolar cells from the goldfish retina. Two techniques were applied: capacitance measurements of changes in membrane surface area, and fluorescence measurements of exocytosis using the membrane dye FM1-43. 2. Three phases of exocytosis occurred during maintained depolarization to 0 mV. The first component was complete within about 10 ms and involved a pool of 1200-1800 vesicles (with a total membrane area equivalent to about 1.6 % of the surface of the terminal). The second component of exocytosis involved the release of about 4400 vesicles over 1 s. The third component of exocytosis was stimulated continuously at a rate of about 1000 vesicles s-1. 3. After short depolarizations (< 200 ms), neither the FM1-43 signal nor the capacitance signal continued to rise, indicating that exocytosis stopped rapidly after closure of Ca2+ channels. The fall in capacitance could therefore be used to monitor endocytosis independently of exocytosis. The capacitance measured after brief stimuli began to fall immediately, recovering to the pre-stimulus baseline with a rate constant of 0.8 s-1. 4. The amount of exocytosis measured using the capacitance and FM1-43 techniques was similar during the first 200 ms of depolarization, suggesting that the most rapidly released vesicles could be detected by either method. 5. After a few seconds of continuous stimulation, the net increase in membrane surface area reached a plateau at about 5 %, even though continuous exocytosis occurred at a rate of 0.9 % s-1. Under these conditions of balanced exocytosis and endocytosis, the rate constant of endocytosis was about 0.2 s-1. The average rate of endocytosis during maintained depolarization was therefore considerably slower than the rate observed after a brief stimulus. 6. After longer depolarizations (> 500 ms), both the capacitance and FM1-43 signals continued to rise for periods of seconds after closure of Ca2+ channels. The continuation of exocytosis was correlated with a persistent increase in [Ca2+]i in the synaptic terminal, as indicated by the activation of a Ca2+-dependent conductance and measurements of [Ca2+]i using the fluorescent indicator furaptra. 7. The delayed fall in membrane capacitance after longer depolarizations occurred along a double exponential time course indicating the existence of two endocytic processes: fast endocytosis, with a rate constant of 0.8 s-1, and slow endocytosis, with a rate constant of 0.1 s-1. 8. Increasing the duration of depolarization caused an increase in the fraction of membrane recovered by slow endocytosis. After a 100 ms stimulus, all the membrane was recycled by fast endocytosis, but after a 5 s depolarization, about 50 % of the membrane was recycled by slow endocytosis. 9. These results demonstrate the existence of fast and slow endocytic mechanisms at a synapse and support the idea that prolonged stimulation leads to an increase in the amount of membrane retrieved by the slower route. The rise in cytoplasmic Ca2+ that occurred during longer depolarizations was correlated with stimulation of continuous exocytosis and inhibition of fast endocytosis. The results also confirm that transient and continuous components of exocytosis coexist in the synaptic terminal of depolarizing bipolar cells.
Figures
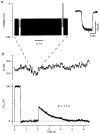
Figure 4. Changes in membrane capacitance in response to depolarization
A, an example of the stimulation protocol. A sinusoidal voltage (50 mV peak to peak, 2 kHz) was applied on top of the holding potential (-70 mV). The sinusoid was briefly interrupted to apply two 10 ms depolarizing pulses. The first, to -50 mV, measured the leak conductance. The second, to 0 mV, activated an inward Ca2+ current, which is shown in the inset after leak subtraction. B, measurements of conductance (G) and capacitance change (Δ_C_m) provided by a dual-phase digital lock-in amplifier that analysed the current evoked by the sinusoidal command voltage and measured the amplitude at two orthogonal phases. The capacitance trace shows a 100 fF calibration applied at the beginning of the recording episode by dithering the whole-cell capacitance compensation. The calibration for the conductance trace was derived from the voltage and current records by assuming that the leak conductance reversed at 0 mV (see Methods). All capacitance records shown in Figs 4 and 6 were obtained from isolated terminals.
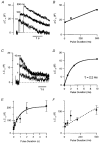
Figure 6. Changes in membrane capacitance evoked by depolarizations of different durations
A, capacitance responses to depolarizing pulses lasting 10, 100 and 500 ms. B, capacitance change as a function of pulse duration, incorporating results shown in A. Each point is the mean of two measurements. The line fitted to the points gives the initial rate of the second component of exocytosis as 44 fF s−1. Extrapolation of this line back to time zero yields an estimate of 21 fF for the capacity of the first component of exocytosis. C, capacitance responses to depolarizing pulses lasting 1, 3 and 10 ms. D, capacitance change as a function of the pulse duration for the responses shown in C. The exponential curve through the points has a time constant of 2.2 ms and capacity of 16 fF. The point at 0 ms is the response to the tail current through Ca2+ channels closing at the end of these depolarizing pulses. This was estimated by depolarizing to +140 mV for 5 ms to open Ca2+ channels maximally without Ca2+ influx, and then repolarizing to -70 mV, allowing Ca2+ entry during the fraction of a millisecond that these channels remained open (see also Mennerick & Matthews, 1996). E, the mean capacitance change elicited by depolarizing pulses of different durations (from 10 ms to 5 s) plotted as a function of pulse duration. Each point is the mean of between 8 and 69 observations, and error bars are ± 1
s.e.m.
The time course of the averaged capacitance increase could be described empirically by the function: Δ_C(t_) = Δ_C_max - Δ_C_1exp(-k_1_t), with Δ_C_max = 207 fF, Δ_C_1 = 175 fF and _k_1 = 1.03 s−1. This is plotted as a continuous line. F, expansion of E to show the increase in capacitance over the first 500 ms of depolarization in more detail. The dashed line, representing the initial rate of the second component of exocytosis, has a slope of 160 fF s−1. Extrapolation of this line back to time zero yields an estimate of 33 fF for the capacity of the first component of exocytosis. All measurements included in the averaged results shown in E and F and Fig. 8 were obtained from isolated synaptic terminals voltage clamped using the permeabilized-patch or the conventional whole-cell techniques.
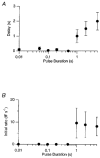
Figure 8. The delayed fall in membrane capacitance
A, the delay between the end of a depolarizing stimulus and the beginning of the fall in capacitance plotted as a function of the duration of the stimulus. B, the initial rate of rise of capacitance after repolarization plotted as a function of the duration of the stimulus. The rate was measured by fitting a line to the first 0.5-2 s of the capacitance increase. All depolarizations were to 0 mV. Bars show ±
s.e.m.
Note logarithmic scale for pulse duration.
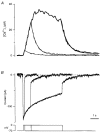
Figure 5. Changes in membrane conductance did not evoke artifactual changes in capacitance
Measurements of changes in capacitance (top trace) and conductance (bottom trace) in an isolated synaptic terminal voltage clamped using the conventional whole-cell technique. The stimuli were applied 1 min (A), 5 min (B), 7.5 min (C) and 16 min (D) after obtaining the whole-cell configuration. The calcium currents (leak subtracted) evoked by each depolarization to 0 mV are shown on an expanded time scale below each record. The durations of the depolarizations were 2 s (A), 100 ms (B) and 1 s (C and D). The scale bar for time represents 6 s for the capacitance and conductance traces, and 2 s for the Ca2+ currents. Note that the continuation of the capacitance increase after repolarization became smaller as the secretory response declined, even though the conductance increase caused by Ca2+ influx was maintained.
Figure 1. The voltage dependence of FM1-43 fluorescence
The change in fluorescence of FM1-43 in the plasma membrane in response to a 5 s hyperpolarization from -50 to -85 mV. Averaged from the same 13 cells used to measure the average time course of exocytosis in Fig. 3_C_ and D. Twenty per cent of the change in fluorescence occurred with a time constant of 0.28 s.
Figure 3. Fluorescence measurements of exocytosis
A, single trace showing the stimulation protocol. FM1-43 (5 μM) was present throughout. The fluorescence change is expressed as a percentage of the fluorescence associated with the plasma membrane (see Methods). The membrane potential is shown in the lower axis. The holding potential was -70 mV. First, a 35 mV hyperpolarization from -50 mV was applied for 5 s to measure the voltage-dependent change in FM1-43 fluorescence. Next, a 70 mV depolarization to 0 mV was applied for 5 s to activate Ca2+ influx and stimulate vesicle cycling. The trace was decimated to 20 ms per point and smoothed by convolution with a Gaussian function of
s.d.
= 64 ms. B, the fluorescence change associated with the stimulation of exocytosis for the cell shown in A. The voltage-dependent change in fluorescence of FM1-43 in the plasma membrane was subtracted from the total fluorescence change during the 5 s depolarization to 0 mV (see Methods). The grey line describing the time course of exocytosis has three linear components. First, a rapid initial increase of 3.6 %. Second, a linear phase with slope of 3.6 % s−1 and capacity of 5 %. Third, a continuous component occurring at 0.77 % s−1. Note the relatively sharp discontinuity between the second and third components of exocytosis. C, average exocytic response from 13 cells to a 5 s depolarization to 0 mV. Only the first response from a given experiment was used. The voltage-dependent change in FM1-43 fluorescence in the plasma membrane (shown in Fig. 1) was subtracted. The depolarization began at 1 s. The averaged Ca2+ current (after leak subtraction) is shown in the lower axis, and inactivates with a time constant of 1.2 s. Note that exocytosis continues for about 4 s after the closure of Ca2+ channels. The trace was decimated to 10 ms per point and smoothed by convolution with a Gaussian function of
s.d.
= 11.5 ms. D, the average time course of exocytosis on an expanded time scale. The grey line describing the response has three components. First, a rapid increase of 1.6 %. Second, a linear phase with slope of 3.8 % s−1 and capacity of 3.7 %. Third, a continuous component occurring at 0.86 % s−1. The inset shows the initial increase on an expanded time scale. All records were obtained using the permeabilized-patch technique. The permeabilized-patch technique was also used in Figs 4, 6, 9_A_ and B, 10 and 11_A_.
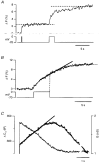
Figure 9. Exocytosis after closure of Ca2+ channels
A, exocytosis continued after long depolarizations. An FM1-43 measurement of exocytosis showing that exocytosis stopped almost immediately after a depolarizing pulse lasting 200 ms, but continued for at least 5 s after a 2 s stimulus. FM1-43 concentration was 5 μM. Average of three experiments from three different cells. B, continuous exocytosis did not require open Ca2+ channels. A single FM1-43 record of exocytosis elicited by a 5 s depolarization to 0 mV. Exocytosis continued for 6 s after repolarization. The smooth line was fitted to the fluorescence increase during the last 3 s of depolarization and then extrapolated. The rate of exocytosis did not significantly decrease until 4 s after the closure of Ca2+ channels. The slope of the line measures the rate of continuous exocytosis as 0.76 % of membrane area per second. C, capacitance measurements also indicated that exocytosis continued after closure of Ca2+ channels. Measurements of changes in conductance (G, thin trace) and capacitance (Δ_C_m, thick trace) in response to a 2 s depolarization to 0 mV. The traces are an expansion of those shown in Fig. 5_A_. The smooth line was fitted to the capacitance increase occurring over the first 2 s after repolarization. The slope gives a lower limit for the rate of continuous exocytosis as 20 fF s−1 (0.4 % of membrane area per second for this terminal with a capacitance of 4.7 pF). Note that over this period the Ca2+-activated conductance recovers to basal levels, indicating that the [Ca2+] near the membrane is continuously falling (see Fig. 10).
Figure 10. The Ca2+-activated conductance and Ca2+ accumulation
A, measurements of spatially averaged [Ca2+]i in the synaptic terminal of an intact bipolar cell made with the low-affinity fluorescent indicator furaptra. Shown are responses to depolarizations from -70 to 0 mV lasting 0.2, 1 and 5 s (thick line). The corresponding Ca2+ currents are shown in B. The fall in [Ca2+]i at the end of each stimulus could be described as a single exponential, as shown by the fitted curves. The time constants of recovery were 0.93, 0.67 and 0.78 s after the 0.2, 1 and 5 s stimuli, respectively. After the 5 s stimulus, [Ca2+]i did not return to baseline during the recording period (baseline for exponential fit, 1.5 μM) indicating that slower components of Ca2+ extrusion may be active after these strong stimuli. The [Ca2+]i at the end of stimulation was correlated with the amplitude of the Ca2+-activated conductance, which recovered with time constants of 1.06 s after the 1 s stimulus, and 1.09 s after the 5 s stimulus (as shown by the smooth curves).
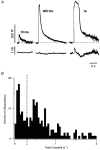
Figure 11. Capacitance measurements of fast and slow endocytosis
A, capacitance responses to depolarizing pulses lasting 10 ms, 200 ms and 1 s from an intact bipolar cell. Lower traces show conductance changes elicited by these stimuli. The recovery phase of the capacitance response after the short stimulus could be fitted with a single exponential function, but a double exponential function provided a better description after the longer stimuli (thick lines). The rate constants of endocytosis were 0.36 s−1 after the 10 ms pulse, 1.1 s−1 and 0.11 s−1 after the 200 ms pulse and 2.0 s−1 and 0.08 s−1 after the 1 s pulse. The percentage of membrane endocytosed through the faster mechanism was 67 % after the 200 ms pulse and 63 % after the 1 s pulse. Capacitance recordings were decimated to 100 points per second and smoothed by convolution with a Gaussian function of
s.d.
= 23 ms. B, histogram of the rate constants obtained from single and double exponential fits to 168 capacitance responses. The dashed line at 0.3 s−1 separating the two peaks illustrates how the rate constants were divided into two populations (slow < 0.3 s−1 and fast > 0.3 s−1). Results in B and Fig. 12 include measurements made in intact cells (with the patch pipette on the cell body) as well as isolated terminals.
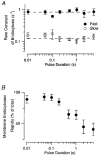
Figure 12. Increasing stimulus duration increased the amount of membrane recycled by slow endocytosis
A, the values of the fast and slow rate constants plotted as a function of stimulus duration. Each point is the mean of between 15 and 27 measurements, and error bars show ± 1
s.e.m.
The dashed lines represent the values of the fast and slow rate constants averaged over all pulse durations (fast = 0.84 s−1 and slow = 0.13 s−1). Note the logarithmic axes. B, the percentage of membrane endocytosed through the fast mechanism plotted as a function of stimulus duration. Note that the results only apply to the period over which the fall in capacitance was described by the fitted function, which was the great majority of the falling phase. This method of analysis did not, therefore, take into account membrane that was recycled during the depolarizing pulse or in the delay period between closure of Ca2+ channels and the cessation of exocytosis.
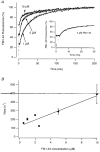
Figure 2. Stopped-flow measurements of membrane staining by FM1-43
A, the time course of the increase in fluorescence observed after mixing goldfish retinal membranes with various concentrations of FM1-43. A significant part of the reaction occurred within the mixing time of the apparatus (2-3 ms), but the remainder of the records could be described as the sum of two exponentials, as shown by the fitted lines. Each record is expressed as a percentage of the maximum increase in fluorescence, rather than an absolute fluorescence increase, because measurements at different concentrations of FM1-43 were necessarily carried out using different volumes of membrane-containing solutions. The inset shows that 80 % of the membrane was stained within 20 ms of mixing with 5 μM FM1-43. B, the rate constant of the rapid component of the fluorescence increase plotted against the concentration of FM1-43. The line fitted to the points has a slope of 35 μM−1 s−1, and intercepts with the _y-_axis at 123 s−1. Bars show ±
s.e.m.
Scheme 1
Figure 7. Comparison of FM1-43 and capacitance measurements during maintained depolarization
A, capacitance responses expressed as a percentage increase in membrane area (•) compared with the time course of exocytosis measured using FM1-43 (continuous noisy line). The capacitance measurements are from the results used to plot Fig. 6_E._ Each measurement was normalized to the resting capacitance of the synaptic terminal before stimulation to measure the percentage increase in membrane surface area. Error bars show ±
s.e.m.
The FM1-43 trace is from Fig. 3_D_ The FM1-43 signal indicates that after 2 s of stimulation, exocytosis proceeds at a constant rate of 0.86 % of the surface area per second. The capacitance signal indicates that the surface area over this period is fixed at a steady level, indicating that exocytosis and endocytosis were balanced. The maximum increase in surface area averaged 5 %. B, expansion of A to show the capacitance and FM1-43 signals during the first second of stimulation. The two measurements agree closely over the first 200 ms. C and D, comparison between measured and predicted increases i.n surface area. The predicted increases in surface area (continuous noisy lines) were calculated from the FM1-43 signal, assuming a fixed rate constant of endocytosis (see text). A rate constant of 0.84 s−1, the mean rate of rapid endocytosis, did not fit the results well (C). A rate constant of 0.13 s−1, the mean rate constant of slow endocytosis, provided a better description (D).
Similar articles
- The actions of barium and strontium on exocytosis and endocytosis in the synaptic terminal of goldfish bipolar cells.
Neves G, Neef A, Lagnado L. Neves G, et al. J Physiol. 2001 Sep 15;535(Pt 3):809-24. doi: 10.1111/j.1469-7793.2001.t01-1-00809.x. J Physiol. 2001. PMID: 11559777 Free PMC article. - Continuous vesicle cycling in the synaptic terminal of retinal bipolar cells.
Lagnado L, Gomis A, Job C. Lagnado L, et al. Neuron. 1996 Nov;17(5):957-67. doi: 10.1016/s0896-6273(00)80226-3. Neuron. 1996. PMID: 8938127 - Electrical resonance and Ca2+ influx in the synaptic terminal of depolarizing bipolar cells from the goldfish retina.
Burrone J, Lagnado L. Burrone J, et al. J Physiol. 1997 Dec 15;505 ( Pt 3)(Pt 3):571-84. doi: 10.1111/j.1469-7793.1997.571ba.x. J Physiol. 1997. PMID: 9457636 Free PMC article. - Exocytosis and endocytosis of synaptic vesicles and functional roles of vesicle pools: lessons from the Drosophila neuromuscular junction.
Kuromi H, Kidokoro Y. Kuromi H, et al. Neuroscientist. 2005 Apr;11(2):138-47. doi: 10.1177/1073858404271679. Neuroscientist. 2005. PMID: 15746382 Review. - Monitoring secretory membrane with FM1-43 fluorescence.
Cochilla AJ, Angleson JK, Betz WJ. Cochilla AJ, et al. Annu Rev Neurosci. 1999;22:1-10. doi: 10.1146/annurev.neuro.22.1.1. Annu Rev Neurosci. 1999. PMID: 10202529 Review.
Cited by
- Encoding of luminance and contrast by linear and nonlinear synapses in the retina.
Odermatt B, Nikolaev A, Lagnado L. Odermatt B, et al. Neuron. 2012 Feb 23;73(4):758-73. doi: 10.1016/j.neuron.2011.12.023. Neuron. 2012. PMID: 22365549 Free PMC article. - Concentration-dependent staining of lactotroph vesicles by FM 4-64.
Stenovec M, Poberaj I, Kreft M, Zorec R. Stenovec M, et al. Biophys J. 2005 Apr;88(4):2607-13. doi: 10.1529/biophysj.104.054098. Epub 2005 Jan 28. Biophys J. 2005. PMID: 15681650 Free PMC article. - Multiple Modes of Fusion and Retrieval at the Calyx of Held Synapse.
Wu XS, Wu LG. Wu XS, et al. Adv Neurobiol. 2023;33:43-62. doi: 10.1007/978-3-031-34229-5_3. Adv Neurobiol. 2023. PMID: 37615863 - Rapid synaptic vesicle endocytosis in cone photoreceptors of salamander retina.
Van Hook MJ, Thoreson WB. Van Hook MJ, et al. J Neurosci. 2012 Dec 12;32(50):18112-23. doi: 10.1523/JNEUROSCI.1764-12.2012. J Neurosci. 2012. PMID: 23238726 Free PMC article. - Synaptic mechanisms of adaptation and sensitization in the retina.
Nikolaev A, Leung KM, Odermatt B, Lagnado L. Nikolaev A, et al. Nat Neurosci. 2013 Jul;16(7):934-41. doi: 10.1038/nn.3408. Epub 2013 May 19. Nat Neurosci. 2013. PMID: 23685718 Free PMC article.
References
- Betz WJ, Mao F, Smith CB. Imaging exocytosis and endocytosis. Current Opinion in Neurobiology. 1996;6:365–371. - PubMed
Publication types
MeSH terms
Substances
LinkOut - more resources
Full Text Sources
Miscellaneous
