Prostaglandin E receptor subtypes in cultured rat microglia and their role in reducing lipopolysaccharide-induced interleukin-1beta production - PubMed (original) (raw)
Prostaglandin E receptor subtypes in cultured rat microglia and their role in reducing lipopolysaccharide-induced interleukin-1beta production
A O Caggiano et al. J Neurochem. 1999 Feb.
Abstract
Prostaglandins (PGs) are potent modulators of brain function under normal and pathological conditions. The diverse effects of PGs are due to the various actions of specific receptor subtypes for these prostanoids. Recent work has shown that PGE2, while generally considered a proinflammatory molecule, reduces microglial activation and thus has an antiinflammatory effect on these cells. To gain further insight to the mechanisms by which PGE2 influences the activation of microglia, we investigated PGE receptor subtype, i.e., EP1, EP2, EP3, and EP4, expression and function in cultured rat microglia. RT-PCR showed the presence of the EP1 and EP2 but not EP3 and EP4 receptor subtypes. Sequencing confirmed their identity with previously published receptor subtypes. PGE2 and the EP1 agonist 17-phenyl trinor PGE2 but not the EP3 agonist sulprostone elicited reversible intracellular [Ca2+] increases in microglia as measured by fura-2. PGE2 and the EP2/EP4-specific agonists 11-deoxy-PGE1 and 19-hydroxy-PGE2 but not the EP4-selective agonist 1-hydroxy-PGE1 induced dose-dependent production of cyclic AMP (cAMP). Interleukin (IL)-1beta production, a marker of activated microglia, was also measured following lipopolysaccharide exposure in the presence or absence of the receptor subtype agonists. PGE2 and the EP2 agonists reduced IL-1beta production. IL-1beta production was unchanged by EP1, EP3, and EP4 agonists. The adenylyl cyclase activator forskolin and the cAMP analogue dibutyryl cAMP also reduced IL-1beta production. Thus, the inhibitory effects of PGE2 on microglia are mediated by the EP2 receptor subtype, and the signaling mechanism of this effect is likely via cAMP. These results show that the effects of PGE2 on microglia are receptor subtype-specific. Furthermore, they suggest that specific and selective manipulation of the effects of PGs on microglia and, as a result, brain function may be possible.
Figures
FIG. 1
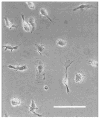
Phase-contrast digital photomicrograph of cultured rat microglia. Photomicrograph shows the morphology of microglia 3 days after isolation from mixed glial cell cultures as used in all experimental manipulations. Note the diversity in cell size and shape but the absence of membrane spiking and inclusion bodies, which might indicate activation. These microglia were plated on glass coverslips and maintained in normal medium. The image was acquired after equilibration in Ringer’s solution and before experimental manipulation. Bar = 25 _μ_m.
FIG. 2
Agarose gels of RT-PCR products for the PGE receptor subtypes. Positive control cDNA (+ Cont.), microglial cDNA (MG RT+), and microglial RNA processed as in the preparation of cDNA but without the reverse transcriptase enzyme (MG RT−) were the templates for each primer pair. Astrocyte cDNA (Astro RT) was also a template for the EP3 primers. All primer sets amplified the appropriate-sized product in the positive control cDNA. The markers shown on the left side indicate bp. Two sets of EP1 primers (EP1 and EP1′) and the EP2 primer set amplified the expected targets in MG RT+ but not MG RT− cDNAs. The EP3 and EP4 primers failed to produce their respective bands in MG RT+ cDNA; however, the EP3 product was amplified from Astro RT cDNA.
FIG. 3
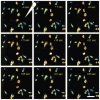
Time series of fura-2 images of microglia during exposure to PGE2. To confirm the expression and activity of the EP1 receptor, microglia were loaded with the Ca2+-sensitive dye fura-2 acetoxymethyl ester. PGE2, the EP1-specific agonist 17PT, the EP3 agonist sulprostone, or normal Ringer’s solution was applied to the cells using a Picospritzer. These pseudo-colored images show the response of microglia to a 20-s application of PGE2. The cone in the upper left image shows the approximate location of the ejection microelectrode. Low [Ca2+]i is indicated by blue and green, and higher concentrations are denoted by yellow, red, and white; however, the scale has been adjusted for demonstration purposes. The time of each image in relation to the beginning of the stimulus is shown in the upper right corners. Bar = 30 _μ_m.
FIG. 4
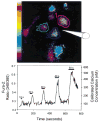
Pseudo-colored image (top panel) and line trace (bottom panel) of the average fura-2 ratios from microglia during stimulation with PGE2. Fura-2-loaded cells were exposed to PGE2 five times as indicated by the horizontal bars. Fura-2 ratios were measured from the areas of interest shown by the circled areas, and the average of these ratios is plotted below. The durations of exposures are as shown on the bars. Notice the immediate response to the application of the agonist and the incremental response with increased exposure times.
FIG. 5
Line and scatter plot of average fura-2 responses in microglia exposed to PGE2, 17PT, sulprostone, or normal Ringer’s solution. Microglia were loaded with fura-2 and exposed to agonist or control Ringer’s solution using a Picospritzer. The duration of the application was 20 s and is shown by the bar labeled “on” and “off.” Each data point was normalized to the fura-2 baseline values determined by averaging each time point from 5 to 10 s into each trace. Data are group averages ± SE (bars) values. Notice the rapid and consistent rise and fall following PGE2 application. 17PT gave similar rise responses but showed a prolonged decline back to baseline. Sulprostone and Ringer’s solution produced no response. Peak responses to PGE2 and 17PT were significantly different from baseline (p < 0.005). Baseline [Ca2+]i values for PGE2- and 17PT-stimulated cells were 77 ± 1.08 and 79 ± 1.57 n_M,_ respectively; peak values were 151 ± 6.0 and 191 ± 26 n_M,_ respectively.
FIG. 6
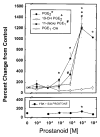
Line and scatter plot shows the cAMP production from microglial cultures. Top panel: Microglia were exposed to PGE2, the EP2 agonists 11dx and 19OH, or the EP4 agonist PGE-OH for 30 min at 37°C. PGE2, 11dx, and 19OH each resulted in dose-dependent cAMP production. No cAMP was produced following exposure to PGE-OH. Values were compared with control cells exposed to normal medium with rolipram using Student’s t test. Significant differences from control with values of p < 0.005 are shown by the symbols indicated. Bottom panel: Microglia were treated with FSK at submaximal concentration (10 μM) and sulprostone. All values are normalized to those in cells treated with FSK and no sulprostone. Sulprostone produced a small significant increase (p = 0.035) at 10 μM, but this trend was not present at 1 or 100 μM.
FIG. 7
Histogram of IL-1_β_ production from microglia following exposure to LPS. Microglial cultures were incubated in medium containing 1 μ_g/ml LPS and the indicated agonists for 24 h. Data from each trial were normalized to the mean IL-1_β values from cultures treated with normal medium and no LPS. PGE2 and the EP2 agonists 11dx and 19OH significantly reduced the IL-1_β_ production. The EP1, EP3, and EP4 agonists 17PT, sulprostone, and PGE-OH were ineffective at reducing the LPS-induced IL-1_β_ production. Forskolin and dibutyryl cAMP (dBcAMP) also significantly reduced the IL-1_β_ production. Data are group mean ± SE (bars) values and were compared with IL-1_β_ production from cells treated with LPS alone. **p < 0.005.
Similar articles
- Binary regulation of interleukin (IL)-6 production by EP1 and EP2/EP4 subtypes of PGE2 receptors in IL-1beta-stimulated human gingival fibroblasts.
Noguchi K, Shitashige M, Endo H, Kondo H, Ishikawa I. Noguchi K, et al. J Periodontal Res. 2002 Feb;37(1):29-36. doi: 10.1034/j.1600-0765.2002.00641.x. J Periodontal Res. 2002. PMID: 11842936 - [Cooperation of two subtypes of PGE2 receptor, Gi coupled EP3 and Gs coupled EP2 or EP4 subtype].
Hatae N. Hatae N. Yakugaku Zasshi. 2003 Oct;123(10):837-43. doi: 10.1248/yakushi.123.837. Yakugaku Zasshi. 2003. PMID: 14577329 Review. Japanese. - [Role of EP4 receptor in bone resorption induced by PGE].
Miyaura C. Miyaura C. Nihon Yakurigaku Zasshi. 2001 Apr;117(4):293-7. doi: 10.1254/fpj.117.293. Nihon Yakurigaku Zasshi. 2001. PMID: 11338379 Review. Japanese.
Cited by
- Role of prostaglandins in neuroinflammatory and neurodegenerative diseases.
Lima IV, Bastos LF, Limborço-Filho M, Fiebich BL, de Oliveira AC. Lima IV, et al. Mediators Inflamm. 2012;2012:946813. doi: 10.1155/2012/946813. Epub 2012 Jun 18. Mediators Inflamm. 2012. PMID: 22778499 Free PMC article. Review. - Microglia lacking E Prostanoid Receptor subtype 2 have enhanced Abeta phagocytosis yet lack Abeta-activated neurotoxicity.
Shie FS, Breyer RM, Montine TJ. Shie FS, et al. Am J Pathol. 2005 Apr;166(4):1163-72. doi: 10.1016/s0002-9440(10)62336-x. Am J Pathol. 2005. PMID: 15793296 Free PMC article. - Peripherally derived macrophages modulate microglial function to reduce inflammation after CNS injury.
Greenhalgh AD, Zarruk JG, Healy LM, Baskar Jesudasan SJ, Jhelum P, Salmon CK, Formanek A, Russo MV, Antel JP, McGavern DB, McColl BW, David S. Greenhalgh AD, et al. PLoS Biol. 2018 Oct 17;16(10):e2005264. doi: 10.1371/journal.pbio.2005264. eCollection 2018 Oct. PLoS Biol. 2018. PMID: 30332405 Free PMC article. - Anti-inflammatory role of microsomal prostaglandin E synthase-1 in a model of neuroinflammation.
Brenneis C, Coste O, Altenrath K, Angioni C, Schmidt H, Schuh CD, Zhang DD, Henke M, Weigert A, Brüne B, Rubin B, Nusing R, Scholich K, Geisslinger G. Brenneis C, et al. J Biol Chem. 2011 Jan 21;286(3):2331-42. doi: 10.1074/jbc.M110.157362. Epub 2010 Nov 12. J Biol Chem. 2011. PMID: 21075851 Free PMC article. - Regulation of PGE2 Pathway During Cerebral Ischemia Reperfusion Injury in Rat.
Xu Y, Liu Y, Li K, Miao S, Lv C, Wang C, Zhao J. Xu Y, et al. Cell Mol Neurobiol. 2021 Oct;41(7):1483-1496. doi: 10.1007/s10571-020-00911-5. Epub 2020 Jul 3. Cell Mol Neurobiol. 2021. PMID: 32621176
References
- Ashwell KW, Hollander H, Streit W, Stone J. The appearance and distribution of microglia in the developing retina of the rat. Vis Neurosci. 1989;2:437–448. - PubMed
- Bader MF, Taupenot L, Ulrich G, Aunis D, Ciesielski-Treska J. Bacterial endotoxin induces [Ca2+]i transients and changes the organization of actin in microglia. Glia. 1994;11:336–344. - PubMed
- Boie Y, Stocco R, Sawyer N, Slipetz DM, Ungrin MD, Neuschafer-Rube F, Puschel GP, Metters KM, Abramovitz M. Molecular cloning and characterization of the four rat prostaglandin E2 prostanoid receptor subtypes. Eur J Pharmacol. 1997;340:227–241. - PubMed
- Borges S, Berry M. The effects of dark rearing on the development of the visual cortex of the rat. J Comp Neurol. 1978;180:277–300. - PubMed
Publication types
MeSH terms
Substances
Grants and funding
- TN-53459/PHS HHS/United States
- R01 NS019108/NS/NINDS NIH HHS/United States
- T32 GM007281/GM/NIGMS NIH HHS/United States
- NS-19108/NS/NINDS NIH HHS/United States
- R01 NS019108-24/NS/NINDS NIH HHS/United States
- T32-GM-07281/GM/NIGMS NIH HHS/United States
LinkOut - more resources
Full Text Sources
Other Literature Sources
Molecular Biology Databases
Miscellaneous


