Neurotransmitter secretion along growing nerve processes: comparison with synaptic vesicle exocytosis - PubMed (original) (raw)
Comparative Study
Neurotransmitter secretion along growing nerve processes: comparison with synaptic vesicle exocytosis
S Zakharenko et al. J Cell Biol. 1999.
Erratum in
- J Cell Biol 1999 Feb 22;144(4):following 801
Abstract
In mature neurons, synaptic vesicles continuously recycle within the presynaptic nerve terminal. In developing axons which are free of contact with a postsynaptic target, constitutive membrane recycling is not localized to the nerve terminal; instead, plasma membrane components undergo cycles of exoendocytosis throughout the whole axonal surface (Matteoli et al., 1992; Kraszewski et al., 1995). Moreover, in growing Xenopus spinal cord neurons in culture, acetylcholine (ACh) is spontaneously secreted in the quantal fashion along the axonal shaft (Evers et al., 1989; Antonov et al., 1998). Here we demonstrate that in Xenopus neurons ACh secretion is mediated by vesicles which recycle locally within the axon. Similar to neurotransmitter release at the presynaptic nerve terminal, ACh secretion along the axon could be elicited by the action potential or by hypertonic solutions. We found that the parameters of neurotransmitter secretion at the nerve terminal and at the middle axon were strikingly similar. These results lead us to conclude that, as in the case of the presynaptic nerve terminal, synaptic vesicles involved in neurotransmitter release along the axon contain a complement of proteins for vesicle docking and Ca2+-dependent fusion. Taken together, our results support the idea that, in developing axons, the rudimentary machinery for quantal neurotransmitter secretion is distributed throughout the whole axonal surface. Maturation of this machinery in the process of synaptic development would improve the fidelity of synaptic transmission during high-frequency stimulation of the presynaptic cell.
Figures
Figure 1
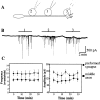
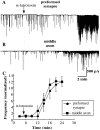
Spontaneous release of ACh from Xenopus neurons. (A) Schematic diagram or recording configuration. An isolated Xenopus myocyte was detached from the substrate, clamped at the resting membrane potential (−70 mV) using whole-cell patch clamp technique, and then sequentially manipulated into contact with three different sites along the axon. At each site the whole-cell patch clamp recording was performed for ∼5 min. (B) A representative example of membrane current recorded from a voltage-clamped myocyte. Downward deflections represent SSCs. SSCs could be detected immediately after establishment of contact between the myocyte and the axon (horizontal black bars). (C) Changes in the frequency and amplitude of the current events with time after the onset of recording, normalized to the values at the beginning of the recording. Data from eight recordings at preformed synapses (circles) and from 10 recordings at the middle axonal segment (squares). Membrane current was continuously recorded for a period of 35 min. In recordings from the middle axon the data were collected immediately after establishment of contact between the myocyte and the axon. Notice that the SSC frequency and SSC amplitude do not significantly change during the period of recording.
Figure 2
Spontaneous release of ACh in isolated Xenopus neurons is mediated by the local recycling of ACh-containing vesicles along the axon. (A) Schematic diagram of recording configuration. Myocyte (M) was manipulated into contact with the middle axonal segment 1 d after cell culture preparation. Whole-cell configuration was established ∼1–2 min after manipulation. Patch clamp recordings from the myocytes were performed for ∼30 min. The neurons chosen for experiments were free of contact with other cells and had a single axon ∼300–500 μm in length. (B) The trace is a representative example of membrane current recorded from whole-cell voltage-clamped myocyte (V h = −70 mV) manipulated into contact with the middle axonal segment. Downward deflections represent SSCs. SSCs could be detected immediately after establishment of whole-cell configuration (start of the recording). Nocodazole (5 μg/ml, arrow) was applied to the bath ∼5 min after the start of recording. (C) Representative fluorescent images of Xenopus neurons loaded with Cy3-Rhodamine before (top) and after (bottom) detergent extraction in a microtubule-stabilizing buffer. In control cells (left panels) the bulk of tubulin was retained in the neuron after extraction. In neurons treated for 30 min with nocodazole (5 μg/ml, right panels), most of the tubulin was removed during the extraction procedure. Similar results were obtained in experiments performed on 10 control neurons and on 10 nocodazole-treated neurons. (D) Nocodazole treatment arrests axonal growth. Representative differential interference contrast (DIC) images of neurite 1 d after cell culture preparation. Numbers indicate time in minutes. Nocodazole (5 μg/ml) was applied 30 min after the start of the experiment. Within 30 min after nocodazole application, axonal elongation slowed down and the growth cone retracted. Similar results were observed in nine different experiments.
Figure 3
Treatment with nocodazole inhibits transport of mitochondria along Xenopus neurites. Representative fluorescent images of mitochondria in a control neuron and in a neuron treated for 30 min with nocodazole (5 μg/ml). Mitochondria were stained with Rhodamine 123 and visualized with digital fluorescence microscopy. Transport of individual mitochondria (arrows) could be detected in control cells. In neurons treated with nocodazole, none of the ∼300 observed mitochondria displayed episodes of long-range transport. Numbers indicate the time in seconds after the start of experiment.
Figure 4
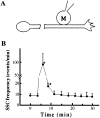
Spontaneous neurotransmitter secretion along the axon can be detected at the distal axonal fragments separated from the soma. (A) ACh release along the axon was measured using patch clamp recordings from the myocyte (M) manipulated into contact with the middle axon. The axon was transected with a sharp microelectrode in the vicinity of the cell body. (B) The time dependence of the SSC frequency in recordings from myocytes normalized to the control frequency before transection. Typically, the SSC frequency dramatically increased immediately after transection, and returned to the baseline level within 15–20 min after transection. Each data point is a mean ± SEM of nine different experiments. *, significantly different from control values (P < 0.05, ANOVA).
Figure 5
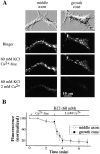
(A) DIC (top) and fluorescence images of Xenopus neuron after staining with FM1-43, and after superfusion with 60 mM KCl in Ca2+-free medium followed by superfusion with solution containing 60 mM KCl and 2 mM Ca2+. Staining revealed a characteristic array of fluorescent spots, which are likely to represent clusters of synaptic vesicles. FM1-43–stained organelles were rapidly destained upon KCl-induced depolarization in the medium containing 2 mM Ca2+ but not in the Ca2+-free medium. Destaining could be detected both at the middle axonal segment and at the growth cone region. (B) The average brightness of the fluorescent spots during destaining. For each cell the intensity was normalized to that at the onset of depolarization before averaging. Data from 80 fluorescent spots in eight different cells. Destaining at the middle axonal segment (open circles) and at the growth cone region (filled squares) occurred with a similar kinetics. No statistically significant destaining was observed when perfusion medium contained 5 mM EGTA (Ca2+-free medium).
Figure 6
Evoked synaptic currents (ESCs) at different axonal segments. Continuous traces depict the membrane current recorded at the preformed synapse (A) and at the middle axon (B). The neurons were extracellularly stimulated (0.5 ms duration, 0.2 Hz) to generate action potentials. ESCs (arrows) are shown as downward deflections among randomly occurring SSCs.
Figure 7
Evoked ACh secretion is inhibited by ω−conotoxin GVIA. Traces are representative examples of the membrane currents recorded from myocytes at the preformed synapses (A) and the middle axonal segment (B). Evoked synaptic currents (small arrows) were elicited by electrical stimulation of the cell body to generate action potentials. Bath application of ω−conotoxin GVIA (1 μM, large arrow) rapidly inhibited ESCs both at the preformed synapses and at the middle axon. Samples of ESCs before and after ω−conotoxin GVIA application are shown below at a higher resolution.
Figure 8
Induction of SSCs by application of hypertonic solution. Current traces are representative examples of whole-cell recordings from myocytes at the preformed synapses (A) and the middle axon (B). Hypertonic solution containing 300 mM sucrose in culture medium was applied to the neurons using a local perfusion system. Superfusion of the neuron with hyperosmotic solution (horizontal black bars) resulted in a rapid increase in the SSC frequency. (C) Normalized frequency of SSCs after application of hypertonic solution to the preformed synapses (solid bar) and the middle axon (open bar). For each recording the average frequency of SSCs during a period of 20–60 s after the onset of sucrose application was normalized to that before the application of hyperosmotic solution. Data are presented as a mean ± SEM of 10 (preformed synapse) and 14 (middle axon) experiments.
Figure 9
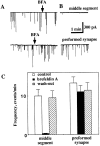
Effect of Brefeldin A (BFA) on quantal ACh release from growing Xenopus axons. (A and B) Current traces are examples of whole-cell current recordings from the myocyte manipulated into contact with the middle axonal segment (top traces) or from myocyte at the preformed synapse of Xenopus axon (bottom traces) 1 d after cell culture preparation. Arrows indicate the onset of BFA application (10 μg/ml). After 5 min of recording, the whole-cell pipette was withdrawn and recording from the same myocyte was performed again 1 h after the onset of BFA application (B). Almost complete inhibition of quantal ACh secretion was observed at the middle axon but not at the nerve terminal after BFA treatment. (C) Quantitative analysis of the effect of BFA on the quantal ACh secretion from the axon. Each bar represents the average of 14–27 series of experiments ± SEM. About a 30-fold decrease in the SSC frequency was observed at the middle axonal segment 1 h after BFA treatment. The reduction in the SSC frequency found in the spontaneously formed synapses after BFA treatment was not statistically significant (P > 0.05, t test). After a 30-min BFA wash out, the frequency of secretion events at various axonal regions was similar to that recorded in control cultures.
Figure 10
Effect of BFA on ACh does not involve the cell body. The axon was transected with a sharp microelectrode in the vicinity of the cell body as in Fig. 4. Myocytes were manipulated into contact with the middle of axonal fragment 15 min after transection, the time when the SSC frequency returns to control (before transection) values (time 0 on the plot). Spontaneous neurotransmitter secretion was measured for ∼25 min by patch clamp recordings from the myocytes (control). The average SSC frequency was calculated for 3-min intervals and normalized to the SSC frequency at time point 0 (solid circles). Bath application of BFA (10 μg/ml) 5 min after the start of recording resulted in a decrease in the SSC frequency (open circles). Each bar represents the average of 10 experiments ± SEM. *, P < 0.05, ANOVA.
Figure 11
Tetanus-induced depression at the preformed synapses (circles) and along the axonal shaft (squares). Amplitudes of ESCs during a 30-s tetanic stimulation at 5 Hz were averaged in 5-s bins. Each data point (± SEM) represents the values averaged for 10 recordings from preformed synapses and 12 recordings from the middle axon. A significant difference between the two series of experiments was found as soon as 5 s after the onset of stimulation. *, P < 0.05, ANOVA.
Figure 12
Paired pulse ratio at the preformed synapse (circles) and the middle axon (squares). The ratio of the ESC amplitude induced by the second stimulus to that of the first stimulus is plotted for different interpulse intervals (ranging from 10 to 200 ms). For each neuron the ratio was determined as an average of at least five pairs of ESCs. Data from eight (preformed synapse) and nine (middle axon) experiments were averaged and presented as mean ± SEM. No statistically significant difference between the PPF was observed between the two series of experiments (ANOVA).
Figure 13
α-Latrotoxin elicits massive neurotransmitter release from Xenopus neurons. (A and B). Representative examples of membrane currents recorded from myocytes at a preformed synapse (A) and from the myocyte manipulated into contact with the middle axon (B). α-Latrotoxin (1 nM, arrow) was applied ∼5 min after the onset of recording. SSC frequency increased with a characteristic delay of ∼10 min. (C) Quantitative analysis of the effect of α-latrotoxin on neurotransmitter secretion at the preformed synapses (circles) and at the middle axon (squares). Changes in the frequency of the current events with time after the onset of α-latrotoxin application, normalized to the values at the beginning of the recording. Data from five recordings at preformed synapses and five recordings at the middle axon were normalized for each cell before averaging.
Figure 14
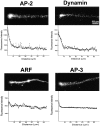
Distribution of dynamin, AP-2, AP-3, and ARF along the neurites. Neurons were fixed, detergent-permeabilized, and then stained with antibodies to dynamin-1, α subunit of AP-2, σ subunit of AP-3, and ARF1. Immunoreactivity recognized by all four antibodies was present throughout the whole axonal surface and had a finely punctate appearance. In the case of dynamin and AP-2, immunoreactivity was concentrated at the growth cone region. Immunoreactivity to AP-3 and ARF was more uniformly distributed throughout the axon. For quantitative analysis of fluorescence intensity distribution, intensity profiles of the axons were created from immunofluorescence images. The sampling areas were chosen along the axon and the average intensity of fluorescence in these areas (arbitrary units) was plotted as a function of distance from the growth cone. For each of the fluorescence profiles, the data from at least 25 different neurons were pooled together.
Similar articles
- Distribution of neurotransmitter secretion in growing axons.
Antonov I, Chang S, Zakharenko S, Popov SV. Antonov I, et al. Neuroscience. 1999 Mar;90(3):975-84. doi: 10.1016/s0306-4522(98)00497-7. Neuroscience. 1999. PMID: 10218797 - Interaction of stoned and synaptotagmin in synaptic vesicle endocytosis.
Fergestad T, Broadie K. Fergestad T, et al. J Neurosci. 2001 Feb 15;21(4):1218-27. doi: 10.1523/JNEUROSCI.21-04-01218.2001. J Neurosci. 2001. PMID: 11160392 Free PMC article. - Redistribution of presynaptic proteins during alpha-latrotoxin-induced release of neurotransmitter and membrane retrieval at the frog neuromuscular junction.
Boudier JA, Martin-Moutot N, Boudier JL, Iborra C, Takahashi M, Seagar MJ. Boudier JA, et al. Eur J Neurosci. 1999 Oct;11(10):3449-56. doi: 10.1046/j.1460-9568.1999.00778.x. Eur J Neurosci. 1999. PMID: 10564353 - The synaptic vesicle cycle.
Sudhof TC. Sudhof TC. Annu Rev Neurosci. 2004;27:509-47. doi: 10.1146/annurev.neuro.26.041002.131412. Annu Rev Neurosci. 2004. PMID: 15217342 Review. - Physical link and functional coupling of presynaptic calcium channels and the synaptic vesicle docking/fusion machinery.
Sheng ZH, Westenbroek RE, Catterall WA. Sheng ZH, et al. J Bioenerg Biomembr. 1998 Aug;30(4):335-45. doi: 10.1023/a:1021985521748. J Bioenerg Biomembr. 1998. PMID: 9758330 Review.
Cited by
- BDNF up-regulates alpha7 nicotinic acetylcholine receptor levels on subpopulations of hippocampal interneurons.
Massey KA, Zago WM, Berg DK. Massey KA, et al. Mol Cell Neurosci. 2006 Dec;33(4):381-8. doi: 10.1016/j.mcn.2006.08.011. Epub 2006 Oct 9. Mol Cell Neurosci. 2006. PMID: 17029981 Free PMC article. - Tetanus toxin blocks the exocytosis of synaptic vesicles clustered at synapses but not of synaptic vesicles in isolated axons.
Verderio C, Coco S, Bacci A, Rossetto O, De Camilli P, Montecucco C, Matteoli M. Verderio C, et al. J Neurosci. 1999 Aug 15;19(16):6723-32. doi: 10.1523/JNEUROSCI.19-16-06723.1999. J Neurosci. 1999. PMID: 10436029 Free PMC article. - Sorting to synaptic-like microvesicles from early and late endosomes requires overlapping but not identical targeting signals.
Blagoveshchenskaya AD, Cutler DF. Blagoveshchenskaya AD, et al. Mol Biol Cell. 2000 May;11(5):1801-14. doi: 10.1091/mbc.11.5.1801. Mol Biol Cell. 2000. PMID: 10793153 Free PMC article. - Postnatal Restriction of Activity-Induced Ca2+ Responses to Schwann Cells at the Neuromuscular Junction Are Caused by the Proximo-Distal Loss of Axonal Synaptic Vesicles during Development.
Heredia DJ, Feng CY, Agarwal A, Nennecker K, Hennig GW, Gould TW. Heredia DJ, et al. J Neurosci. 2018 Oct 3;38(40):8650-8665. doi: 10.1523/JNEUROSCI.0956-18.2018. Epub 2018 Aug 24. J Neurosci. 2018. PMID: 30143570 Free PMC article. - Ectopic vesicular glutamate release at the optic nerve head and axon loss in mouse experimental glaucoma.
Fu CT, Sretavan DW. Fu CT, et al. J Neurosci. 2012 Nov 7;32(45):15859-76. doi: 10.1523/JNEUROSCI.0038-12.2012. J Neurosci. 2012. PMID: 23136425 Free PMC article.
References
- Antonov, I., S. Chang, S. Zakharenko, and S.V. Popov. 1998. Distribution of neurotransmitter secretion in growing axons. Neuroscience. In press. - PubMed
- Bennett MK. Calcium and the regulation of neurotransmitter secretion. Curr Opin Neurobiol. 1997;7:316–322. - PubMed
- Betz WJ, Bewick GS. Optical analysis of synaptic vesicle recycling at the frog neuromuscular junction. Science. 1992;255:200–203. - PubMed
Publication types
MeSH terms
Substances
LinkOut - more resources
Full Text Sources
Miscellaneous
