Mutant influenza viruses with a defective NS1 protein cannot block the activation of PKR in infected cells - PubMed (original) (raw)
Mutant influenza viruses with a defective NS1 protein cannot block the activation of PKR in infected cells
E Hatada et al. J Virol. 1999 Mar.
Abstract
A short model genome RNA and also the genome RNA of influenza A virus bearing both 5'- and 3'-terminal common sequences activated the interferon-induced double-stranded-RNA-dependent protein kinase, PKR, by stimulating autophosphorylation in vitro. The activated PKR catalyzed phosphorylation of the alpha subunit of eucaryotic translation initiation factor 2 (eIF2alpha). The NS1 protein efficiently eliminated the PKR-activating activity of these RNAs by binding to them. Two mutant NS1 proteins, each harboring a single amino acid substitution at different regions, exhibited temperature sensitivity in their RNA binding activity in the mutant virus-infected cell lysates as well as when they were prepared as fusion proteins expressed in bacteria. The virus strains carrying these mutant NS1 proteins exhibited temperature sensitivity in virus protein synthesis at the translational level, as reported previously, and could not repress the autophosphorylation of PKR developing during the virus growth, which is normally suppressed by a viral function(s). As a result, the level of eIF2alpha phosphorylation was elevated 2.5- to 3-fold. The defect in virus protein synthesis was well correlated with the level of phosphorylation of PKR and eIF2alpha.
Figures
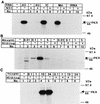
FIG. 1
Autophosphorylation of PKR stimulated by various RNAs and eliminated by preincubation with the NS1 protein. (A) Various RNAs were preincubated in the absence (−) or presence (+) of the GST-NS1 protein (0.5 μg) for 30 min at 30°C in the kinase reaction mixture as indicated above the lane number. ATP and [γ-32P]ATP were then added to the mixture, followed by the PKR fraction (1 μg of protein) for the PKR autophosphorylation reaction as described in Materials and Methods. The phosphorylated proteins were analyzed by SDS–10% PAGE. The tested RNAs (1 μg/ml each) were poly(A)-poly(U) (AU), poly(I)-poly(C) (IC), the mini-vRNA (Min), and tRNA. (B and C) Increasing amounts of the mini-vRNA (Min) (B) and virion RNA (Vir) (C) as indicated were preincubated in the absence (−) or presence (+) of 0.5 μg of GST-NS1 protein. PKR autophosphorylation was examined as described in for panel A. Migrations of the protein markers (Amersham Pharmacia Biotech) are indicated on the right of each panel.
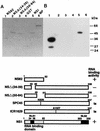
FIG. 2
Structures of NS1 deletion proteins and their RNA binding abilities. (Lower panel) Structures of NS1 deletion proteins NS82, NSΔ(34-39), and NSΔ(50-84). The amino acid substitutions in two ts mutant NS1s are also shown. (A and B) The GST-NS1 fusion proteins were induced in E. coli cells and purified by using a glutathione-agarose column. Equal molar quantities of the proteins (9.5 pmol) were subjected to SDS–12% PAGE, and the gel was stained with Coomassie brilliant blue (A). For Northwestern blotting (B), proteins in the gel were electroblotted onto a nitrocellulose membrane and subjected to the RNA binding reaction with a 32P-labeled dsRNA probe as described in Materials and Methods. Lanes 1, GST-NS82; lanes 2, GST-NSΔ(34-39); lanes 3, GST-NSΔ(50-84); lanes 4, GST protein; lanes 5, GST-NS1 (full length); lanes 6, GST-NP. Migrations of protein markers (Sigma) are indicated on the right of panel B.
FIG. 3
Effect of the GST-NS1 fusion proteins on PKR-catalyzed eIF2α phosphorylation. Mini-vRNA (1 μg/ml) was preincubated in the kinase reaction mixture for 30 min at 30°C without NS proteins (lane 1) or in the presence of GST–wild-type NS1 (lane 2), GST-NS82 (lane 3), GST-NSΔ(50-84) (lane 4), or the GST protein (lane 5). The PKR autophosphorylation reaction (upper panel) was carried out as described in the legend to Fig. 1A. For PKR-catalyzed eIF2α phosphorylation (lower panel), the PKR autophosphorylation reaction was performed as described above but without addition of the labeled ATP. Thereafter, [γ-32P]ATP and eIF2 were added to the reaction mixtures, which were further incubated for 20 min at 30°C. The phosphorylated proteins were subjected to SDS–15% PAGE as described in Materials and Methods. For protein markers on the right, see the legend to Fig. 1.
FIG. 4
RNA binding abilities of the NS1 ts mutant proteins. The GST-NS1 fusion proteins for the ts mutant NS1s (illustrated in Fig. 2) were expressed in E. coli and purified with a glutathione-agarose column. The temperature sensitivities of their RNA binding activities were examined by Northwestern blotting (NW) with 9.5 pmol of each protein as described in the legend to Fig. 2. The RNA binding reaction was performed with a 32P-labeled dsRNA probe at either room temperature (middle panel) or 40°C (right panel). The dye-staining pattern of these proteins is shown (left panel). GST–wild-type NS1, GST-SPC45 NS1, GST-ICR1629 NS1, and the GST protein were applied to lanes 1, 2, 3, and 4, respectively. For protein markers on the right, see the legend to Fig. 1.
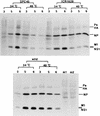
FIG. 5
Protein synthesis in virus-infected HeLa cells. Cells infected with the wild-type, SPC45, and ICR1629 viruses (MOI of 10) were grown at either 34 or 40°C and labeled with [35S]methionine (10 μCi/ml) for 30 min beginning from 3, 5, and 6 h p.i., as shown above the panels. For other experimental details, see reference . Lanes m1 and m2, cells mock infected and labeled during 6 to 6.5 h p.i. at 34 and 40°C, respectively. Ps, virus polymerase proteins. HA, hemagglutinin.
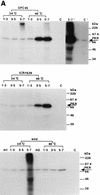
FIG. 6
Phosphorylation of PKR and eIF2α in HeLa cells infected with the ts NS1 mutant viruses. Confluent monolayers of HeLa cells were infected with the wild-type or ts mutant viruses (MOI of 10) at either 34 or 40°C, labeled with [32P]orthophosphate (500 μCi/ml) (ARC) for 2 h, and harvested. Cell lysates were prepared and reacted with the polyclonal antibody against human PKR (A) or the polyclonal antibody against human eIF2α (C-20) (1 μg) (B) for 1 h at room temperature as described in Materials and Methods. The resulting immunoprecipitates were then analyzed by SDS-PAGE and autoradiography. (A) Phosphorylation of PKR. The labeling was from 1 to 3 h p.i. (lanes 1 to 3), from 3 to 5 h p.i. (lanes 3 to 5), and from 5 to 7 h p.i. (lanes 5 to 7), as shown above each panel. Lanes m1 and m2, cells mock infected and labeled during 5 to 7 h p.i. at 34 and 40°C, respectively. Lane C, 32P-PKR labeled in vitro. Longer exposures for lanes 5 to 7 and C are shown on the right of the upper panel (5-7′ and C′). For protein markers on the right, see the legend to Fig. 1. (B) Phosphorylation of eIF2α. The viruses were grown at 34 or 40°C as shown at the top, and the infected cells were labeled with 32P from 4 to 6 h p.i. The immunosupernatants of lanes 5 and 6 were treated with the anti-PKR antibody, and the immunoprecipitates (one-third of total) were analyzed in lanes 7 and 8, respectively. Lane C1, 32P-labeled purified PKR and rabbit eIF2α.
FIG. 7
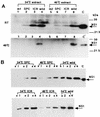
dsRNA binding activities of NS1 proteins in wild-type- or ts mutant-infected-cell lysates. The virus-infected cells (MOI of 10) were grown at either 34 or 40°C and lysed at 6 h p.i. as described in the legend to Fig. 6 and Materials and Methods. (A) dsRNA binding activities of NS1 proteins in cell lysates corresponding to 30 μl of the lysates (300× volume) (3 × 10⁵ cells). Lysates from infected cells grown at either 34°C (lanes 1 to 4) or 40°C (lanes 5 to 8) were subjected to SDS-PAGE for Northwestern blotting with the 32P-dsRNA probe as described in the legend to Fig. 2. Lanes 2 and 6, SPC45-infected cells; lanes 3 and 7, ICR1629-infected cells; lanes 4 and 8, wild-type virus-infected cells, lanes 1 and 5, mock-infected cells (m1 and m2). The RNA binding reaction was performed at either room temperature (RT) or 40°C as indicated on the left. Lanes C and C′, 0.6 and 0.15 μg of purified NS1, respectively. (B) The amounts of NS1 in the cell lysates were compared. Increasing volumes (1× [0.1 μl of lysate; 103 cells], 2×, and 4×) of the lysates was subjected to SDS-PAGE for ECL immunodetection of NS1 protein with the anti-NS1 antibody. Lane C, 6 ng of purified NS1.
FIG. 8
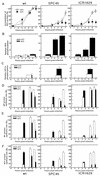
Quantitation of the results shown in Fig. 5, 6, and 7. All results shown are derived from at least three separate experiments and are the averages and standard deviations. (A) Amounts of NS1 accumulated in the infected cells grown at 34 or 40°C. For experimental details, see the legend to Fig. 7B. The intensities of the ECL bands were measured with a microdensitometer (dual-wavelength flying-spot scanner CS-9000; Shimadzu), and the relative values are shown, with NS1 in the wild-type lysates 6 h p.i. at 34°C set as 100%. (B to F) Radioactivities of gel bands were measured with a BAS1000 image analyzer. (B) Phosphorylation of PKR during virus growth. The radioactivity of the PKR band shown in Fig. 6A is represented as the relative value, with that of the wild-type virus-infected cells labeled from 5 to 7 h p.i. at 34°C set as 1.0. (C) Phosphorylation of eIF2α in virus-infected cells during 4 to 6 h p.i. (Fig. 6B). The relative values are represented, with the radioactivity obtained from the wild-type virus-infected cells at 34°C set as 1.0. (D to F) Rates of synthesis of NP (D), M1 (E), and NS1 (F) (30-min labeling) in the infected cells (Fig. 5), represented as the relative value, with that of the respective protein in the wild-type virus-infected cells labeled 6 h p.i. at 34°C set as 100%.
Similar articles
- Binding of the influenza A virus NS1 protein to PKR mediates the inhibition of its activation by either PACT or double-stranded RNA.
Li S, Min JY, Krug RM, Sen GC. Li S, et al. Virology. 2006 May 25;349(1):13-21. doi: 10.1016/j.virol.2006.01.005. Epub 2006 Feb 8. Virology. 2006. PMID: 16466763 - A site on the influenza A virus NS1 protein mediates both inhibition of PKR activation and temporal regulation of viral RNA synthesis.
Min JY, Li S, Sen GC, Krug RM. Min JY, et al. Virology. 2007 Jun 20;363(1):236-43. doi: 10.1016/j.virol.2007.01.038. Epub 2007 Feb 22. Virology. 2007. PMID: 17320139 - Influenza A Virus Virulence Depends on Two Amino Acids in the N-Terminal Domain of Its NS1 Protein To Facilitate Inhibition of the RNA-Dependent Protein Kinase PKR.
Schierhorn KL, Jolmes F, Bespalowa J, Saenger S, Peteranderl C, Dzieciolowski J, Mielke M, Budt M, Pleschka S, Herrmann A, Herold S, Wolff T. Schierhorn KL, et al. J Virol. 2017 Apr 28;91(10):e00198-17. doi: 10.1128/JVI.00198-17. Print 2017 May 15. J Virol. 2017. PMID: 28250123 Free PMC article. - PKR--a protein kinase regulated by double-stranded RNA.
Clemens MJ. Clemens MJ. Int J Biochem Cell Biol. 1997 Jul;29(7):945-9. doi: 10.1016/s1357-2725(96)00169-0. Int J Biochem Cell Biol. 1997. PMID: 9375375 Review.
Cited by
- Activation of interferon regulatory factor 3 is inhibited by the influenza A virus NS1 protein.
Talon J, Horvath CM, Polley R, Basler CF, Muster T, Palese P, García-Sastre A. Talon J, et al. J Virol. 2000 Sep;74(17):7989-96. doi: 10.1128/jvi.74.17.7989-7996.2000. J Virol. 2000. PMID: 10933707 Free PMC article. - Innate Immune Response to Influenza Virus at Single-Cell Resolution in Human Epithelial Cells Revealed Paracrine Induction of Interferon Lambda 1.
Ramos I, Smith G, Ruf-Zamojski F, Martínez-Romero C, Fribourg M, Carbajal EA, Hartmann BM, Nair VD, Marjanovic N, Monteagudo PL, DeJesus VA, Mutetwa T, Zamojski M, Tan GS, Jayaprakash C, Zaslavsky E, Albrecht RA, Sealfon SC, García-Sastre A, Fernandez-Sesma A. Ramos I, et al. J Virol. 2019 Sep 30;93(20):e00559-19. doi: 10.1128/JVI.00559-19. Print 2019 Oct 15. J Virol. 2019. PMID: 31375585 Free PMC article. - Influenza virus mRNA translation revisited: is the eIF4E cap-binding factor required for viral mRNA translation?
Burgui I, Yángüez E, Sonenberg N, Nieto A. Burgui I, et al. J Virol. 2007 Nov;81(22):12427-38. doi: 10.1128/JVI.01105-07. Epub 2007 Sep 12. J Virol. 2007. PMID: 17855553 Free PMC article. - Viral suppression of the interferon system.
Weber F, Haller O. Weber F, et al. Biochimie. 2007 Jun-Jul;89(6-7):836-42. doi: 10.1016/j.biochi.2007.01.005. Epub 2007 Jan 27. Biochimie. 2007. PMID: 17336442 Free PMC article. Review. - Influenza B virus ribonucleoprotein is a potent activator of the antiviral kinase PKR.
Dauber B, Martínez-Sobrido L, Schneider J, Hai R, Waibler Z, Kalinke U, García-Sastre A, Wolff T. Dauber B, et al. PLoS Pathog. 2009 Jun;5(6):e1000473. doi: 10.1371/journal.ppat.1000473. Epub 2009 Jun 12. PLoS Pathog. 2009. PMID: 19521506 Free PMC article.
References
- Chien C, Tejero R, Huang Y, Zimmerman D E, Rios C B, Krug R M, Monteilon G T. A novel RNA-binding motif in influenza A virus non-structural protein 1. Nat Struct Biol. 1997;4:891–895. - PubMed
- Chou P Y, Fasman G D. Empirical predictions of protein conformation. Annu Rev Biochem. 1978;47:251–276. - PubMed
- Desselberger U, Racaniello V R, Zazra J J, Palese P. The 3′ and 5′-terminal sequences of influenza A, B and C virus RNA segments are highly conserved and show partial inverted complementarity. Gene. 1980;8:315–328. - PubMed
MeSH terms
Substances
LinkOut - more resources
Full Text Sources
Other Literature Sources
Research Materials
