Interaction of dendritic cells with skin endothelium: A new perspective on immunosurveillance - PubMed (original) (raw)
Interaction of dendritic cells with skin endothelium: A new perspective on immunosurveillance
C Robert et al. J Exp Med. 1999.
Abstract
The goal of this study was to determine the mechanisms by which dendritic cells (DCs) in blood could interact with endothelium, a prerequisite to extravasation into tissues. Our results indicate that DCs express both HECA-452-reactive and nonreactive isoforms of P-selectin glycoprotein ligand 1 (PSGL-1) and can tether and roll efficiently on E- and P-selectin under flow conditions in vitro. Freshly isolated blood DCs were further observed to roll continuously along noninflamed murine dermal endothelium in vivo. This interaction is strictly dependent on endothelial selectins, as shown by experiments with blocking antibodies and with E- and P-selectin-deficient mice. We hypothesize that DCs in blood are constitutively poised at the interface of blood and skin, ready to extravasate upon induction of inflammation, and we showed that cutaneous inflammation results in a rapid recruitment of DCs from the blood to tissues. We propose that this is an important and previously unappreciated element of immunosurveillance.
Figures
Figure 1
Blood DCs express HLA-DR but do not express specific lineage markers CD14, CD19, or CD56 or any TCR (reference 3). (a) They represent <1% of the PBMCs (reference 3). After immunomagnetic depletion of T cells, monocytes, and NK cells, using CD3, CD11b, and CD16 antibodies and positive selection of CD4+ leukocytes (blood DC isolation kit from Miltenyi Biotec), a population of >90% pure blood DCs is obtained (b).
Figure 2
(a and b) Freshly isolated DCs homogeneously express P- and E-selectin ligand, PSGL-1/CLA. FACS® analysis of cultured DCs stained with mAb to PSGL-1 (PSL-275) and to CLA (HECA-452). (c) Cultured DCs express PSGL-1 (4H10), and 30% (30–50%) of them also express CLA. (d and e) Immunoblotting of cultured DC lysates with anti–PSGL-1 (d) and HECA-452 (e) shows that the CLA epitope is expressed on a single glycoprotein. Analysis under standard reducing conditions (lane 1) revealed specific immunoreactive bands at 240 kD (dimer) and 140 kD (monomer) with each specific antibody; and under enhanced reducing conditions (lane 2), only one specific band at 140 kD (monomer) was seen for both HECA-452 and anti– PSGL-1 immunoreactivities. The bands at 50 and 60 kD in the HECA-452 blot represent the HECA antibody used for immunomagnetic separation, as shown previously (reference 10).
Figure 3
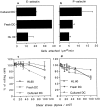
DCs tether and roll on E- and P-selectin in vitro. Interaction of DCs with E- and P-selectin was assessed in a parallel plate flow chamber. HL60 cells are included as a positive binding control. Both fresh and cultured DCs formed tethers on E-selectin (a) and P-selectin (b) at 1 dyn/ cm2 and rolled in a calcium-dependent fashion. DCs bound to either E- (c) or P-selectin (d) showed strong resistance to detachment by increasing wall shear stress with >80–100% of cells remaining bound at 25 dyn/cm2. E- and P-selectin binding was abolished by perfusion of medium containing 5 mM EDTA. The data presented are the mean and range of two experiments and are representative of several independent observations.
Figure 4
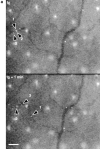
(a) DCs tether and roll in murine ear postcapillary venules in vivo. Calcein-labeled DCs were observed in ear postcapillary venules (top panel) after carotid injection. Continuous observation of bound cells (representative examples identified by arrowheads) reveals considerable heterogeneity of individual velocities. Three cells identified in the top panel are observed to move significantly different distances over the 1-min period of observation. All other cells shown have rolled out of the field of view during the 1-min interval. During that same period, several additional rolling cells have appeared (bottom panel). Unbound cells moved through the field of view within <1 s (not shown). The large bright areas seen between vessels are autofluorescent hair follicles. Bar, 100 μm. (b) Attachment and rolling of cultured DCs in wild-type mice (51 cells in a 28-μm-diameter venule; mean blood flow velocity = 890.6 μm/s, V crit = 388.2 μm/s) and E/P-selectin double-deficient mice (64 cells in a 34-μm-diameter venule; mean blood flow velocity = 1,281 μm/s, V crit = 471.7 μm/ s). V crit, the velocity of an idealized noninteracting cell (i.e., moving freely with the bloodstream) traveling at the vessel wall, was calculated as described (reference 22). DCs were not observed to form productive attachments in E/P-selectin−/− mice, where all cells (solid line) traveled at velocities greater than V crit, whereas ∼53% of cells observed in wild-type mice (dashed line) rolled at velocities less than V crit.
Figure 5
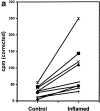
Immature murine bone marrow–derived DCs are acutely recruited into inflamed skin. Mice sensitized to oxazolone were challenged on the right ear 48 h before intravenous infusion of 5 × 10⁶ 51Cr-labeled DCs. 6 h after DC infusion, the mice were killed and the cpm were compared in both ears. (a) Results obtained in nine mice are shown; cpm values are corrected by subtraction of the background radioactivity. There is a significant difference between the challenged and control ear (P < 0.01, Student's t test). (b) Shows the fold increase in cpm measured in inflamed ears versus contralateral control ears for nine independent determinations. The area from 0 to 1 is shaded. Values above the shaded area reflect an increased number of labeled cells in the inflamed ear, and values within the shaded area would reflect a decreased number of cells in the inflamed ear relative to control. The solid line and hatched field represent the mean and 95% confidence interval for fold increase of inflamed ear counts versus control (P < 0.01, Student's t test). (c–e) Confocal microscopy images of an inflamed ear 6 h after infusion of 20 × 106 calcein-labeled murine bone marrow–derived DCs. 100 μg of PE-conjugated mAb anti–mouse CD31 (PharMingen) was infused 5 min before the animal was killed, in order to visualize the vessels. Several fields of the same ear (photographed through a 40× objective) are shown: (c) a calcein-labeled DC is seen just outside of the vessel wall; (d) another DC is seen between two small vessels; and (e) a calcein- labeled DC has clearly extravasated and is shown deeper in the surrounding tissues. No extravascular cells were observed in contralateral, noninflamed ear.
Comment in
- Mobilizing dendritic cells for tolerance, priming, and chronic inflammation.
Sallusto F, Lanzavecchia A. Sallusto F, et al. J Exp Med. 1999 Feb 15;189(4):611-4. doi: 10.1084/jem.189.4.611. J Exp Med. 1999. PMID: 9989975 Free PMC article. Review. No abstract available.
Similar articles
- Immature mouse dendritic cells enter inflamed tissue, a process that requires E- and P-selectin, but not P-selectin glycoprotein ligand 1.
Pendl GG, Robert C, Steinert M, Thanos R, Eytner R, Borges E, Wild MK, Lowe JB, Fuhlbrigge RC, Kupper TS, Vestweber D, Grabbe S. Pendl GG, et al. Blood. 2002 Feb 1;99(3):946-56. doi: 10.1182/blood.v99.3.946. Blood. 2002. PMID: 11806998 - Neutrophils, monocytes, and dendritic cells express the same specialized form of PSGL-1 as do skin-homing memory T cells: cutaneous lymphocyte antigen.
Kieffer JD, Fuhlbrigge RC, Armerding D, Robert C, Ferenczi K, Camphausen RT, Kupper TS. Kieffer JD, et al. Biochem Biophys Res Commun. 2001 Jul 20;285(3):577-87. doi: 10.1006/bbrc.2001.5230. Biochem Biophys Res Commun. 2001. PMID: 11453631 - Functional selectin ligands mediating human CD34(+) cell interactions with bone marrow endothelium are enhanced postnatally.
Hidalgo A, Weiss LA, Frenette PS. Hidalgo A, et al. J Clin Invest. 2002 Aug;110(4):559-69. doi: 10.1172/JCI14047. J Clin Invest. 2002. PMID: 12189250 Free PMC article. - Insights into selectin function from knockout mice.
Frenette PS, Wagner DD. Frenette PS, et al. Thromb Haemost. 1997 Jul;78(1):60-4. Thromb Haemost. 1997. PMID: 9198128 Review. - New discoveries with mice mutant in endothelial and platelet selectins.
Hartwell DW, Wagner DD. Hartwell DW, et al. Thromb Haemost. 1999 Aug;82(2):850-7. Thromb Haemost. 1999. PMID: 10605793 Review.
Cited by
- Effect of Dry Eye Disease on the Kinetics of Lacrimal Gland Dendritic Cells as Visualized by Intravital Multi-Photon Microscopy.
Ortiz G, Chao C, Jamali A, Seyed-Razavi Y, Kenyon B, Harris DL, Zoukhri D, Hamrah P. Ortiz G, et al. Front Immunol. 2020 Aug 12;11:1713. doi: 10.3389/fimmu.2020.01713. eCollection 2020. Front Immunol. 2020. PMID: 32903439 Free PMC article. - Regulation by chemokines of circulating dendritic cell precursors, and the formation of portal tract-associated lymphoid tissue, in a granulomatous liver disease.
Yoneyama H, Matsuno K, Zhang Y, Murai M, Itakura M, Ishikawa S, Hasegawa G, Naito M, Asakura H, Matsushima K. Yoneyama H, et al. J Exp Med. 2001 Jan 1;193(1):35-49. doi: 10.1084/jem.193.1.35. J Exp Med. 2001. PMID: 11136819 Free PMC article. - Alpha4beta1 integrin mediates the recruitment of immature dendritic cells across the blood-brain barrier during experimental autoimmune encephalomyelitis.
Jain P, Coisne C, Enzmann G, Rottapel R, Engelhardt B. Jain P, et al. J Immunol. 2010 Jun 15;184(12):7196-206. doi: 10.4049/jimmunol.0901404. Epub 2010 May 17. J Immunol. 2010. PMID: 20483748 Free PMC article. - TSLP acts on infiltrating effector T cells to drive allergic skin inflammation.
He R, Oyoshi MK, Garibyan L, Kumar L, Ziegler SF, Geha RS. He R, et al. Proc Natl Acad Sci U S A. 2008 Aug 19;105(33):11875-80. doi: 10.1073/pnas.0801532105. Epub 2008 Aug 18. Proc Natl Acad Sci U S A. 2008. PMID: 18711124 Free PMC article. - Mechanisms of dendritic cell trafficking across the blood-brain barrier.
Sagar D, Foss C, El Baz R, Pomper MG, Khan ZK, Jain P. Sagar D, et al. J Neuroimmune Pharmacol. 2012 Mar;7(1):74-94. doi: 10.1007/s11481-011-9302-7. Epub 2011 Aug 6. J Neuroimmune Pharmacol. 2012. PMID: 21822588 Free PMC article. Review.
References
- Steinman RM. The dendritic cell system and its role in immunogenicity. Annu Rev Immunol. 1991;9:271–296. - PubMed
- Banchereau J, Steinman RM. Dendritic cells and the control of immunity. Nature. 1998;392:245–252. - PubMed
- Hart DN. Dendritic cells: unique leukocyte populations which control the primary immune response. Blood. 1997;90:3245–3287. - PubMed
- Springer TA. Traffic signals on endothelium for lymphocyte recirculation and leukocyte emigration. Annu Rev Physiol. 1995;57:827–872. - PubMed
Publication types
MeSH terms
Substances
LinkOut - more resources
Full Text Sources
Other Literature Sources


