fpdf2 - Charts & Graphs (original) (raw)
Charts
Using Matplotlib
Before running this example, please install the required dependencies using the command below:
pip install fpdf2 matplotlib
Example taken from Matplotlib artist tutorial:
`from fpdf import FPDF from matplotlib.backends.backend_agg import FigureCanvasAgg as FigureCanvas from matplotlib.figure import Figure import numpy as np from PIL import Image
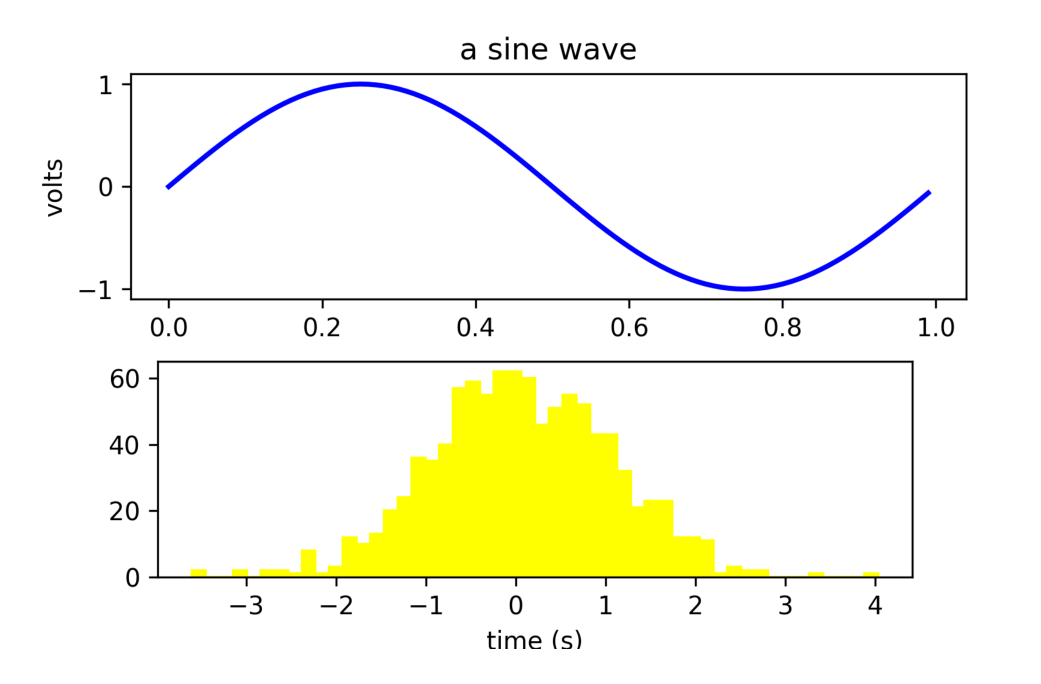
fig = Figure(figsize=(6, 4), dpi=300) fig.subplots_adjust(top=0.8) ax1 = fig.add_subplot(211) ax1.set_ylabel("volts") ax1.set_title("a sine wave")
t = np.arange(0.0, 1.0, 0.01) s = np.sin(2 * np.pi * t) (line,) = ax1.plot(t, s, color="blue", lw=2)
Fixing random state for reproducibility
np.random.seed(19680801)
ax2 = fig.add_axes([0.15, 0.1, 0.7, 0.3]) n, bins, patches = ax2.hist( np.random.randn(1000), 50, facecolor="yellow", edgecolor="yellow" ) ax2.set_xlabel("time (s)")
Converting Figure to an image:
canvas = FigureCanvas(fig) canvas.draw() img = Image.fromarray(np.asarray(canvas.buffer_rgba()))
pdf = FPDF() pdf.add_page() pdf.image(img, w=pdf.epw) # Make the image full width pdf.output("matplotlib.pdf") `
Result:
You can also embed a figure as SVG (but there may be some limitations):
`from fpdf import FPDF import matplotlib.pyplot as plt import numpy as np
plt.figure(figsize=[2, 2]) x = np.arange(0, 10, 0.00001) y = xnp.sin(2 np.pi * x) plt.plot(y) plt.savefig("figure.svg", format="svg")
pdf = FPDF() pdf.add_page() pdf.image("figure.svg") pdf.output("doc-with-figure.pdf") `
Using Pandas
The dependencies required for the following examples can be installed using this command:
pip install fpdf2 matplotlib pandas
Create a plot using pandas.DataFrame.plot:
`from io import BytesIO from fpdf import FPDF import pandas as pd import matplotlib.pyplot as plt import io
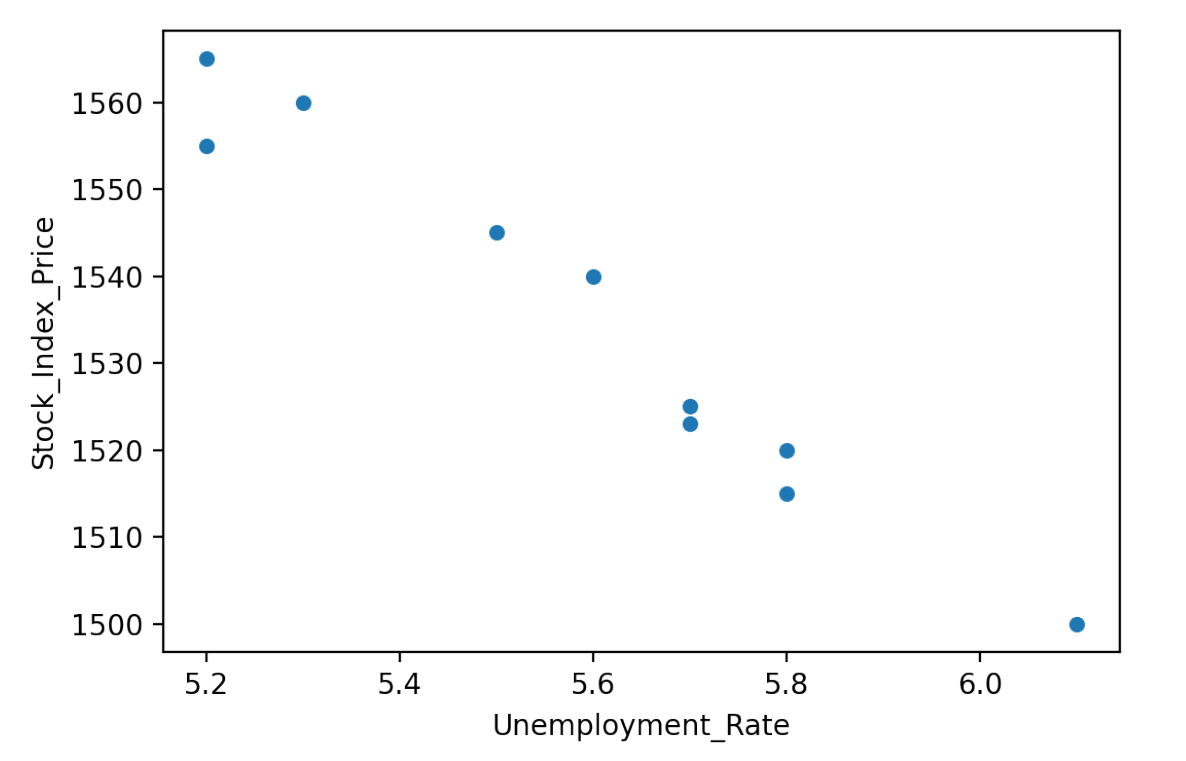
DATA = { "Unemployment_Rate": [6.1, 5.8, 5.7, 5.7, 5.8, 5.6, 5.5, 5.3, 5.2, 5.2], "Stock_Index_Price": [1500, 1520, 1525, 1523, 1515, 1540, 1545, 1560, 1555, 1565], } COLUMNS = tuple(DATA.keys())
plt.figure() # Create a new figure object df = pd.DataFrame(DATA, columns=COLUMNS) df.plot(x=COLUMNS[0], y=COLUMNS[1], kind="scatter")
Converting Figure to an image:
img_buf = BytesIO() # Create image object plt.savefig(img_buf, dpi=200) # Save the image
pdf = FPDF() pdf.add_page() pdf.image(img_buf, w=pdf.epw) # Make the image full width pdf.output("matplotlib_pandas.pdf") img_buf.close() `
Result:
Create a table with pandas DataFrame:
`from fpdf import FPDF import pandas as pd
DF = pd.DataFrame( { "First name": ["Jules", "Mary", "Carlson", "Lucas"], "Last name": ["Smith", "Ramos", "Banks", "Cimon"], "Age": [34, 45, 19, 31], "City": ["San Juan", "Orlando", "Los Angeles", "Saint-Mathurin-sur-Loire"], } # Convert all data inside dataframe into string type: ).applymap(str)
COLUMNS = [list(DF)] # Get list of dataframe columns ROWS = DF.values.tolist() # Get list of dataframe rows DATA = COLUMNS + ROWS # Combine columns and rows in one list
pdf = FPDF() pdf.add_page() pdf.set_font("Times", size=10) with pdf.table( borders_layout="MINIMAL", cell_fill_color=200, # grey cell_fill_mode="ROWS", line_height=pdf.font_size * 2.5, text_align="CENTER", width=160, ) as table: for data_row in DATA: row = table.row() for datum in data_row: row.cell(datum) pdf.output("table_from_pandas.pdf") `
Result: 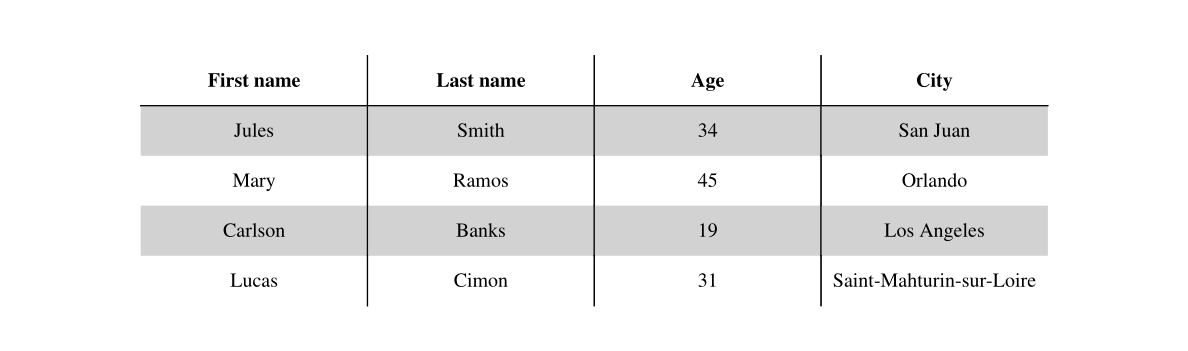
Using Plotly
Before running this example, please install the required dependencies using the command below:
pip install fpdf2 plotly kaleido numpy
kaleido is a cross-platform library for generating static images that is used by plotly.
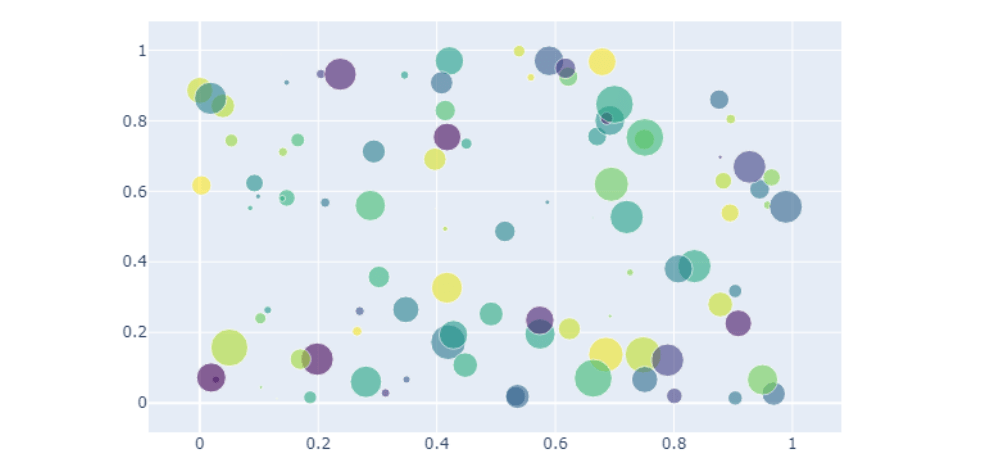
Example taken from Plotly static image export tutorial:
`import io import plotly.graph_objects as go import numpy as np from fpdf import FPDF
np.random.seed(1)
N = 100 x = np.random.rand(N) y = np.random.rand(N) colors = np.random.rand(N) sz = np.random.rand(N) * 30
fig = go.Figure() fig.add_trace( go.Scatter( x=x, y=y, mode="markers", marker=go.scatter.Marker( size=sz, color=colors, opacity=0.6, colorscale="Viridis" ), ) )
Convert the figure to png using kaleido
image_data = fig.to_image(format="png", engine="kaleido")
Create an io.BytesIO object which can be used by FPDF2
image = io.BytesIO(image_data) pdf = FPDF() pdf.add_page() pdf.image(image, w=pdf.epw) # Width of the image is equal to the width of the page pdf.output("plotly_demo.pdf") `
Result:
While you can also embed a figure as SVG, this is not recommended as text data - such as the x and y axis bars - might not be displayed, because plotly places this data in a SVG text tag which is currently not supported by fpdf2.
Before running this example, please install the required dependencies:
pip install fpdf2 plotly kaleido pandas
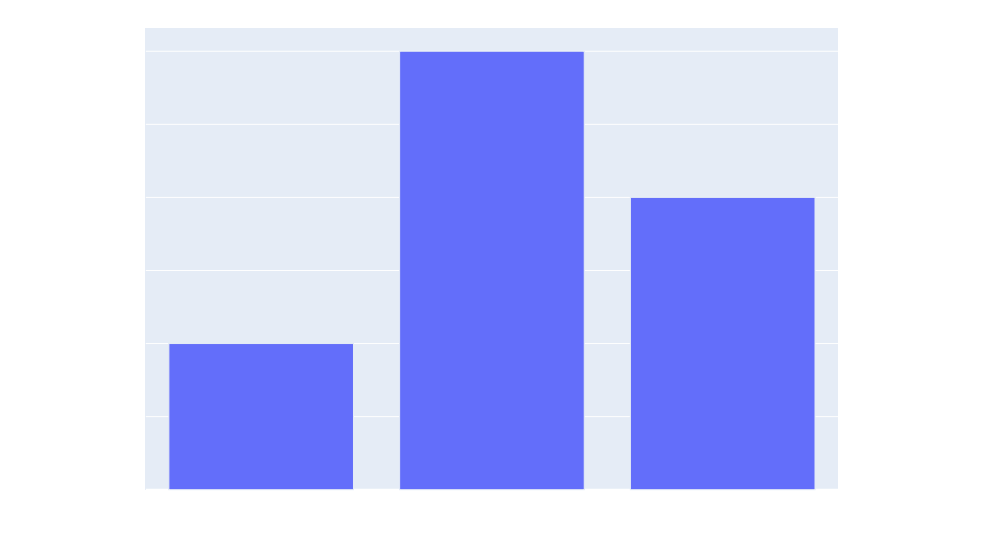
`from fpdf import FPDF import plotly.express as px
fig = px.bar(x=["a", "b", "c"], y=[1, 3, 2]) fig.write_image("figure.svg")
pdf = FPDF() pdf.add_page() pdf.image("figure.svg", w=pdf.epw) pdf.output("plotly.pdf") `
Result:
Using Pygal
Pygal is a Python graph plotting library. You can install it using: pip install pygal
fpdf2 can embed graphs and charts generated using Pygal library. However, they cannot be embedded as SVG directly, because Pygal inserts <style> & <script> tags in the images it produces (cf. pygal/svg.py), which is currently not supported by fpdf2. The full list of supported & unsupported SVG features can be found there: SVG page.
You can find documentation on how to convert vector images (SVG) to raster images (PNG, JPG), with a practical example of embedding PyGal charts, there: SVG page > Converting vector graphics to raster graphics.
Mathematical formulas
fpdf2 can only insert mathematical formula in the form of images. The following sections will explain how to generate and embed such images.
Using Google Charts API
Official documentation: Google Charts Infographics - Mathematical Formulas.
Example:
`from io import BytesIO from urllib.parse import quote from urllib.request import urlopen from fpdf import FPDF
formula = "x^n + y^n = a/b" height = 170 url = f"https://chart.googleapis.com/chart?cht=tx&chs={height}&chl={quote(formula)}" with urlopen(url) as img_file: # nosec B310 img = BytesIO(img_file.read())
pdf = FPDF() pdf.add_page() pdf.image(img, w=30) pdf.output("equation_google_charts.pdf") `
Result:
Using LaTeX & Matplotlib
Matplotlib can render LaTeX: Text rendering With LaTeX.
Example:
`from io import BytesIO from fpdf import FPDF from matplotlib.figure import Figure
fig = Figure(figsize=(6, 2)) gca = fig.gca() gca.text(0, 0.5, r"$x^n + y^n = \frac{a}{b}$", fontsize=60) gca.axis("off")
Converting Figure to a SVG image:
img = BytesIO() fig.savefig(img, format="svg")
pdf = FPDF() pdf.add_page() pdf.image(img, w=100) pdf.output("equation_matplotlib.pdf") `
Result:
If you have trouble with the SVG export, you can also render the matplotlib figure as pixels:
`from fpdf import FPDF from matplotlib.backends.backend_agg import FigureCanvasAgg as FigureCanvas from matplotlib.figure import Figure import numpy as np from PIL import Image
fig = Figure(figsize=(6, 2), dpi=300) gca = fig.gca() gca.text(0, 0.5, r"$x^n + y^n = \frac{a}{b}$", fontsize=60) gca.axis("off")
canvas = FigureCanvas(fig) canvas.draw() img = Image.fromarray(np.asarray(canvas.buffer_rgba()))
pdf = FPDF() pdf.add_page() pdf.image(img, w=100) pdf.output("equation_matplotlib_raster.pdf") `