arviz.plot_autocorr — ArviZ dev documentation (original) (raw)
arviz.plot_autocorr(data, var_names=None, filter_vars=None, max_lag=None, combined=False, coords=None, grid=None, figsize=None, textsize=None, labeller=None, ax=None, backend=None, backend_config=None, backend_kwargs=None, show=None)[source]#
Bar plot of the autocorrelation function (ACF) for a sequence of data.
The ACF plots are helpful as a convergence diagnostic for posteriors from MCMC samples which display autocorrelation.
Parameters:
dataInferenceData
Any object that can be converted to an arviz.InferenceData object refer to documentation of arviz.convert_to_dataset() for details
var_nameslist of str, optional
Variables to be plotted. Prefix the variables by ~ when you want to exclude them from the plot. See this section for usage examples.
filter_vars{None, “like”, “regex”}, default None
If None (default), interpret var_names as the real variables names. If “like”, interpret var_names as substrings of the real variables names. If “regex”, interpret var_names as regular expressions on the real variables names. Seethis section for usage examples.
coords: mapping, optional
Coordinates of var_names to be plotted. Passed to xarray.Dataset.sel()
max_lagint, optional
Maximum lag to calculate autocorrelation. By Default, the plot displays the first 100 lag or the total number of draws, whichever is smaller.
Flag for combining multiple chains into a single chain. If False, chains will be plotted separately.
gridtuple, optional
Number of rows and columns. Defaults to None, the rows and columns are automatically inferred. See this section for usage examples.
figsize(float, float), optional
Figure size. If None it will be defined automatically. Note this is not used if ax is supplied.
textsizefloat, optional
Text size scaling factor for labels, titles and lines. If None it will be autoscaled based on figsize.
labellerLabeller, optional
Class providing the method make_label_vert to generate the labels in the plot titles. Read the Label guide for more details and usage examples.
ax2D array_like of matplotlib Axes or Bokeh Figure, optional
A 2D array of locations into which to plot the densities. If not supplied, ArviZ will create its own array of plot areas (and return it).
backend{“matplotlib”, “bokeh”}, default “matplotlib”
Select plotting backend.
backend_configdict, optional
Currently specifies the bounds to use for bokeh axes. Defaults to value set in rcParams.
backend_kwargsdict, optional
These are kwargs specific to the backend being used, passed tomatplotlib.pyplot.subplots() or bokeh.plotting.figure. For additional documentation check the plotting method of the backend.
showbool, optional
Call backend show function.
Returns:
axesmatplotlib Axes or bokeh_figures
See also
Compute autocovariance estimates for every lag for the input array.
Compute autocorrelation using FFT for every lag for the input array.
Examples
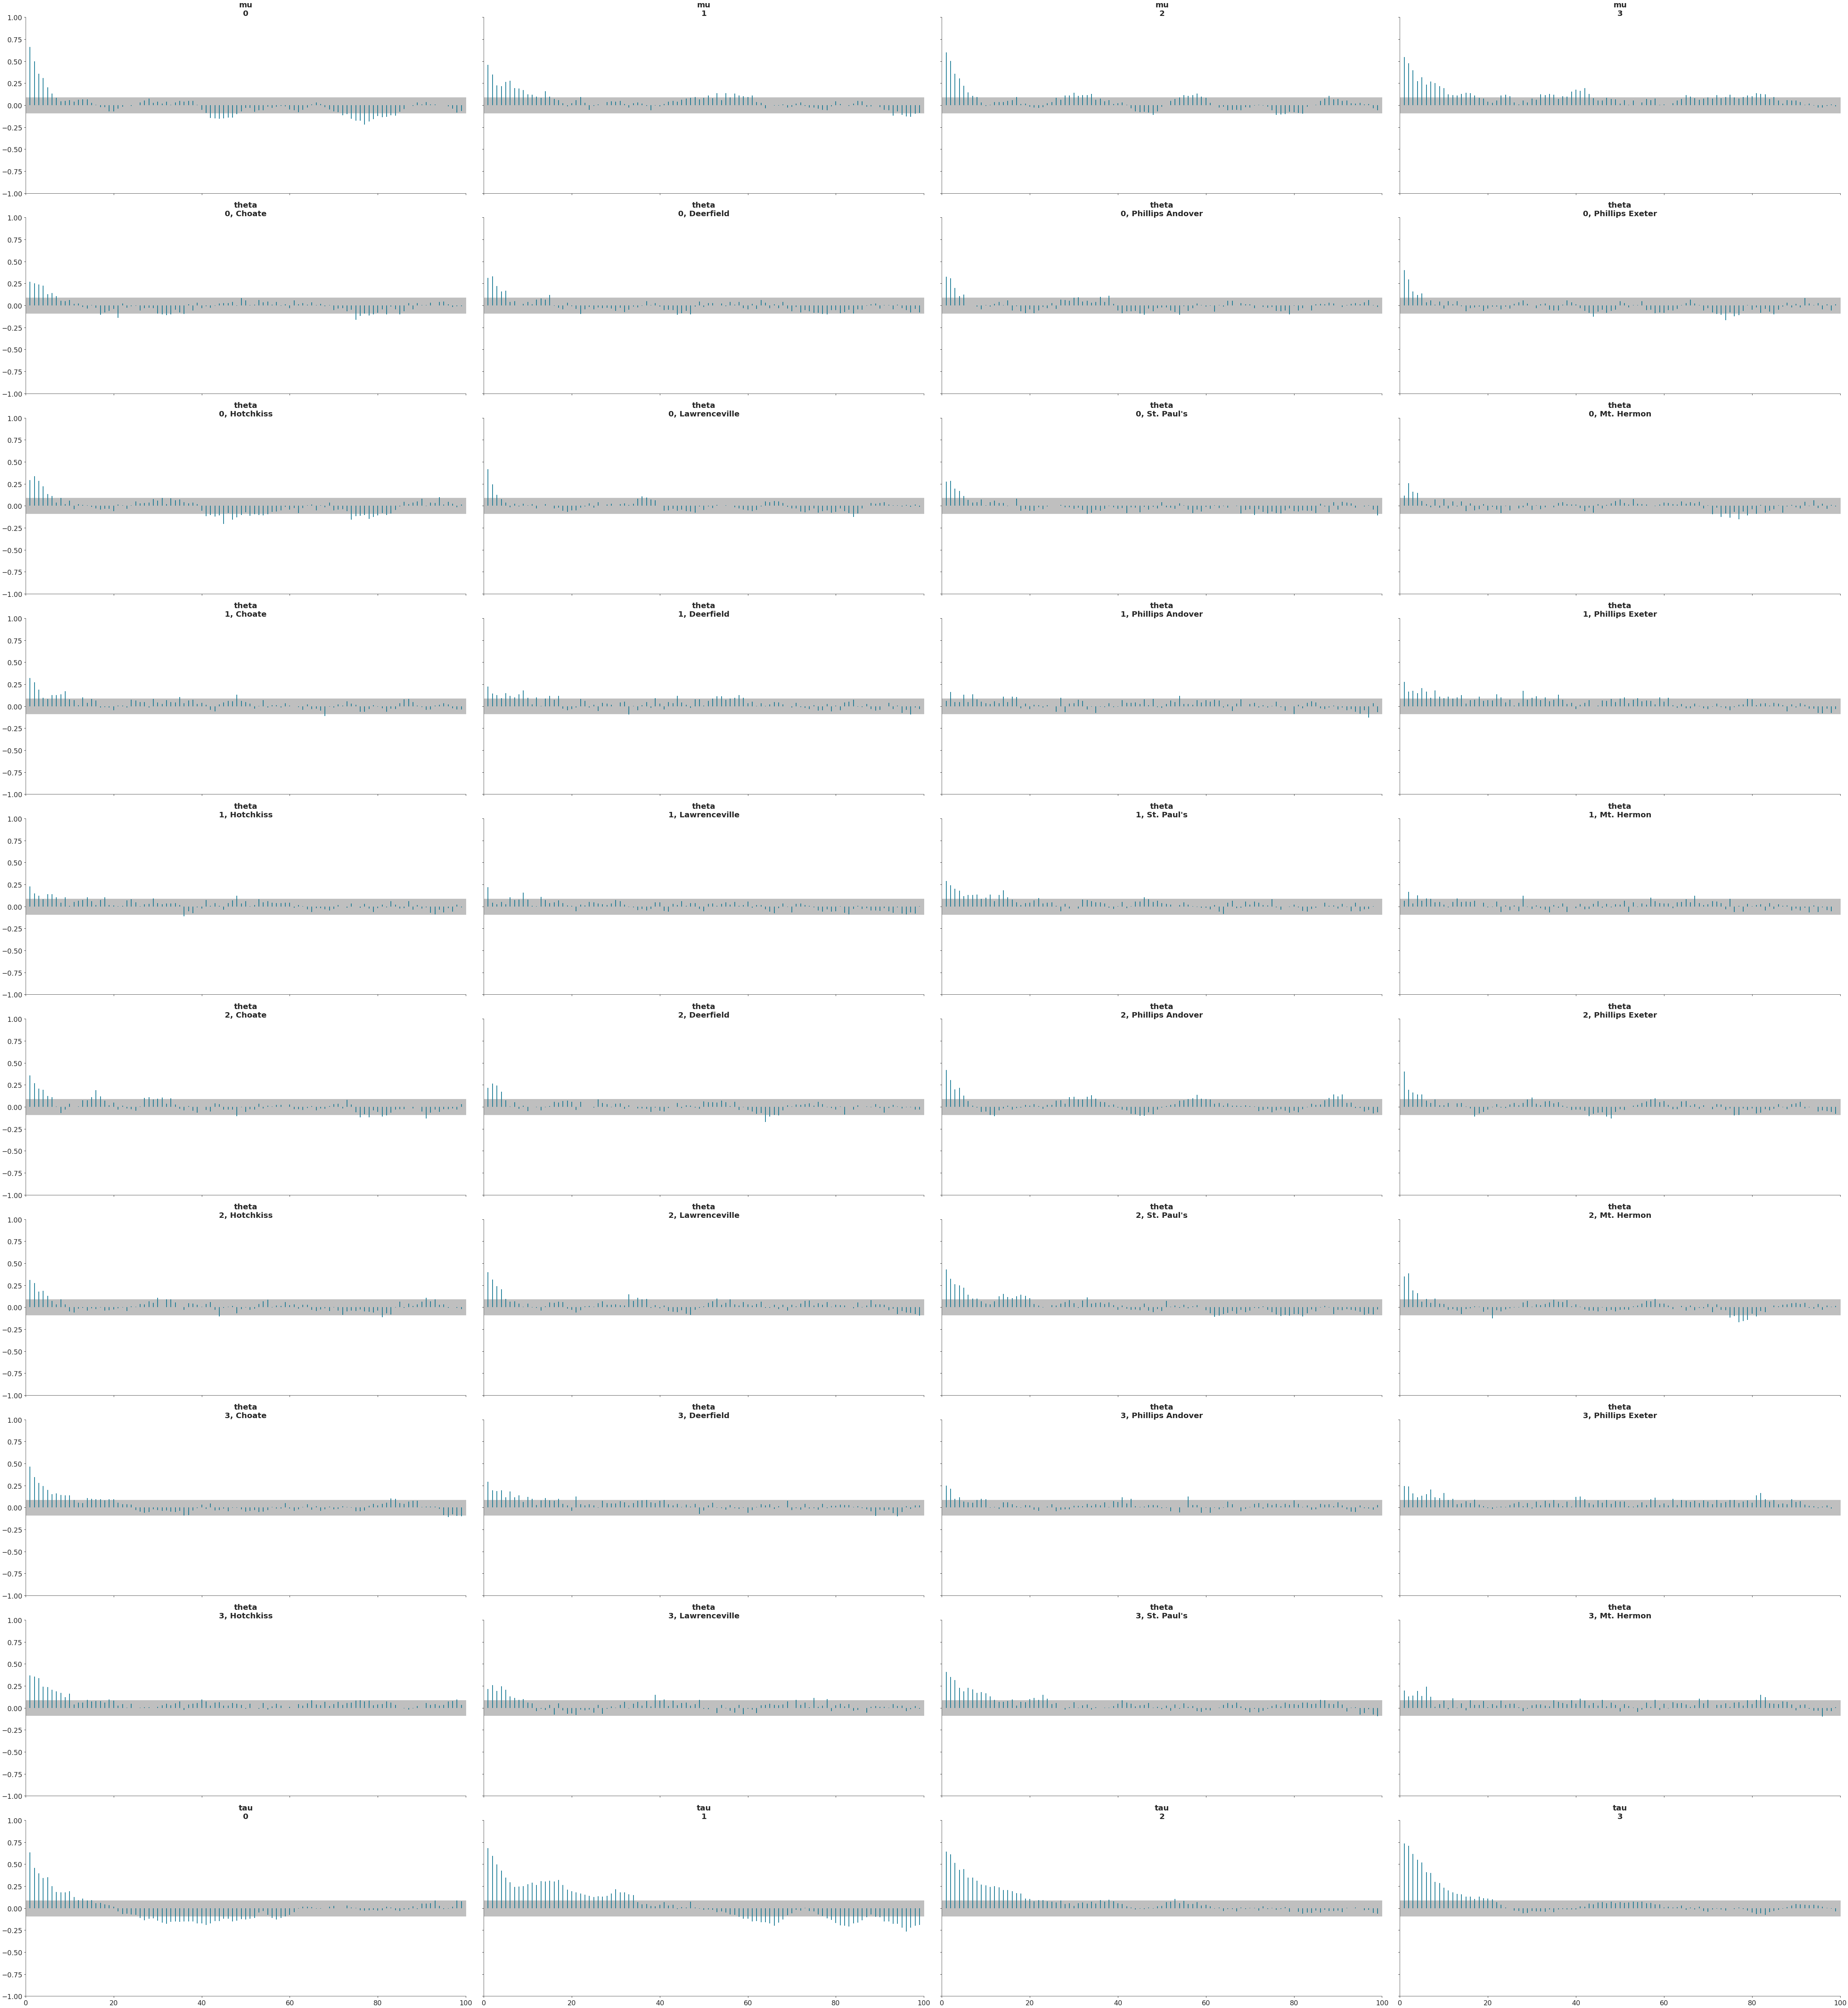
Plot default autocorrelation
import arviz as az data = az.load_arviz_data('centered_eight') az.plot_autocorr(data)
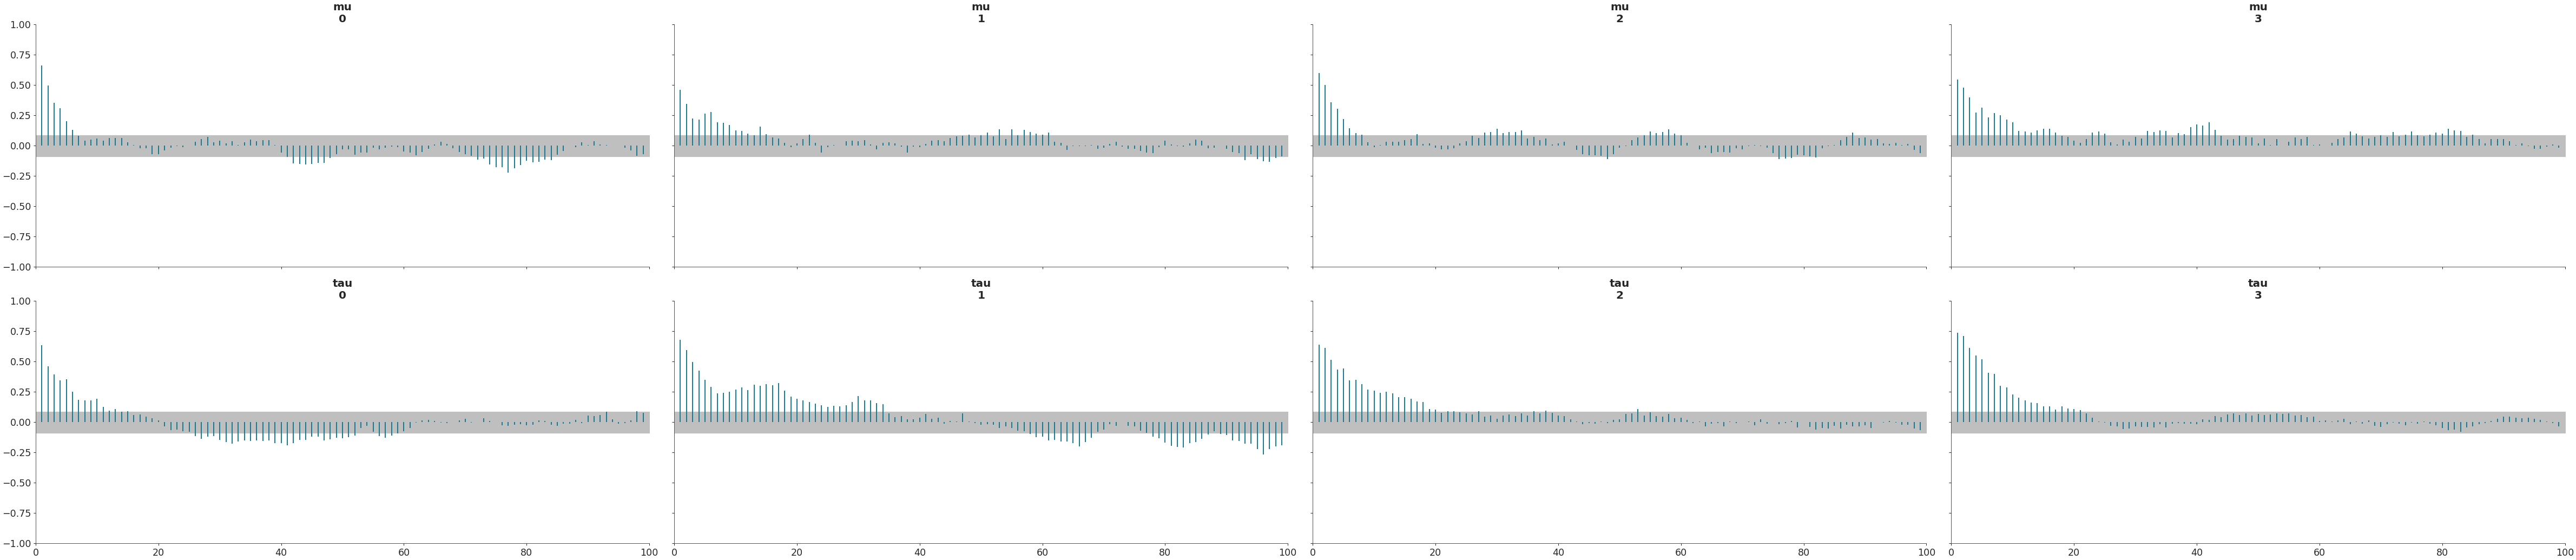
Plot subset variables by specifying variable name exactly
az.plot_autocorr(data, var_names=['mu', 'tau'] )
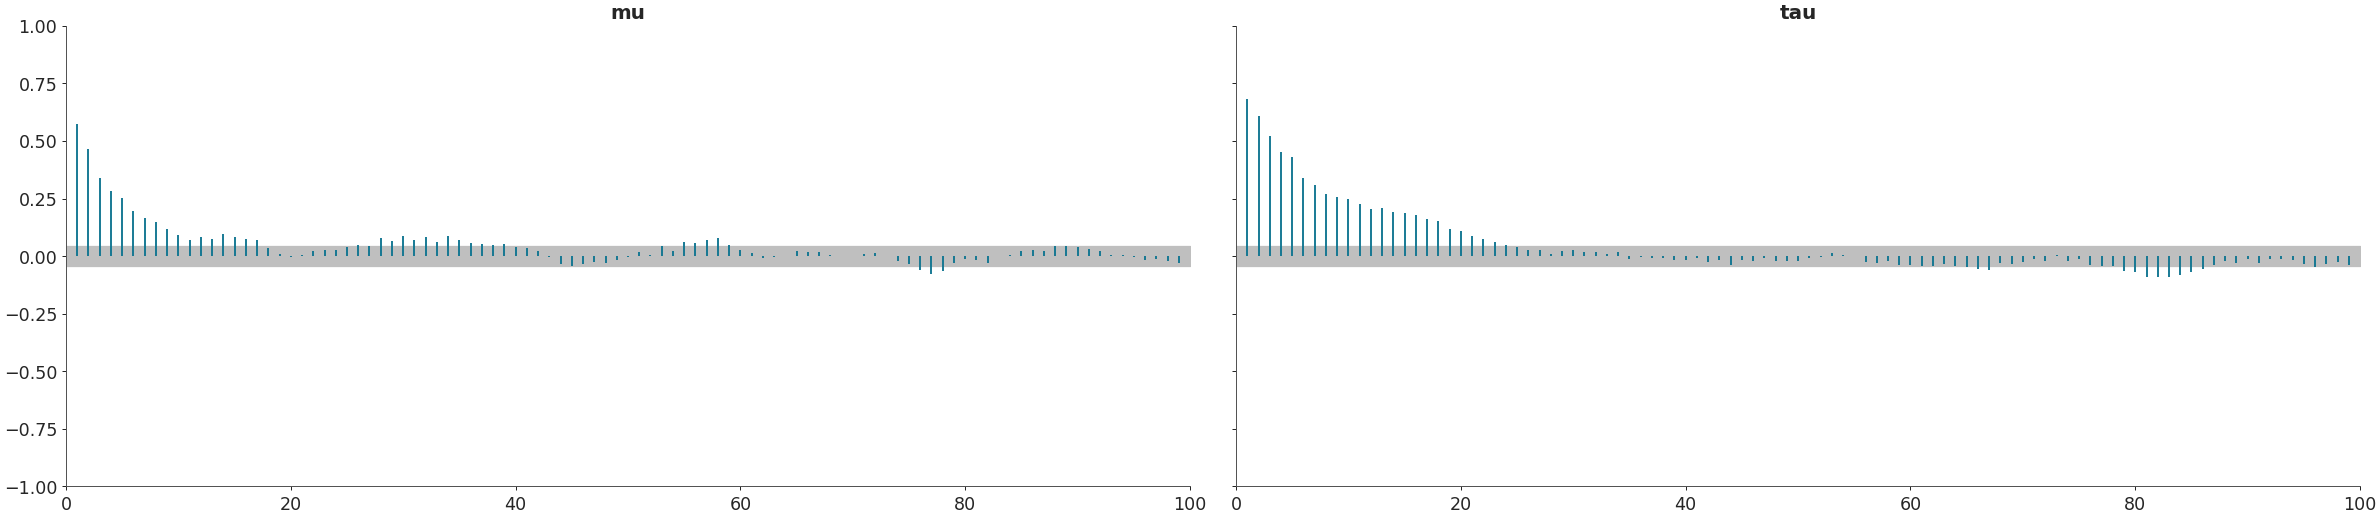
Combine chains by variable and select variables by excluding some with partial naming
az.plot_autocorr(data, var_names=['~thet'], filter_vars="like", combined=True)
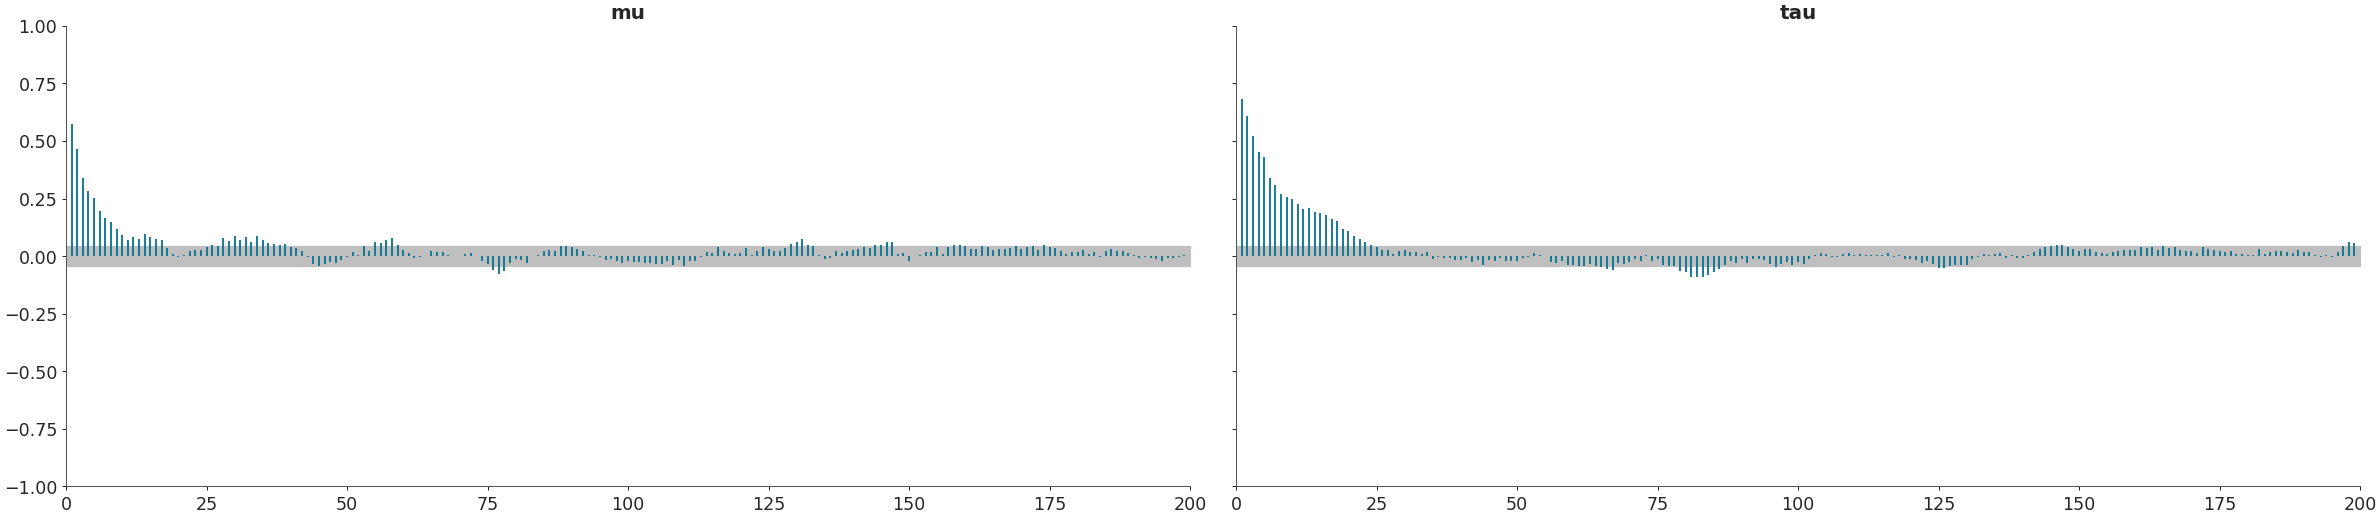
Specify maximum lag (x axis bound)
az.plot_autocorr(data, var_names=['mu', 'tau'], max_lag=200, combined=True)