Torchserve Performance Tuning, Animated Drawings Case-Study – PyTorch (original) (raw)
In this post we discuss performance tuning of Torchserve for serving your models in production. One of the biggest challenges in the life cycle of a ML project is deploying models in production. This requires a reliable serving solution along with solutions that address the MLOps needs. A robust serving solution needs to provide support for multi model serving, model versioning, metric logging, monitoring and scaling to serve the peak traffic. In this post, we will have an overview of Torchserve and how to tune its performance for production use-cases. We discuss the Animated Drawings app from Meta that can turn your human figure sketches to animations and how it could serve the peak traffic with Torchserve. The Animated Drawing’s workflow is below.

https://ai.facebook.com/blog/using-ai-to-bring-childrens-drawings-to-life
Many AI systems and tools are designed to handle realistic images of humans, children’s drawings add a level of complexity and unpredictability as they are often constructed in abstract, fanciful ways. These types of morphological and stylistic variations can confuse even state-of-the-art AI systems that excel at spotting objects in photorealistic images and drawings. Meta AI researchers are working to overcome this challenge so that AI systems will be better able to recognize drawings of human figures in the wildly varied ways that children create them. This great blog post provides more details about the Animated Drawings and the approach taken.
Torchserve
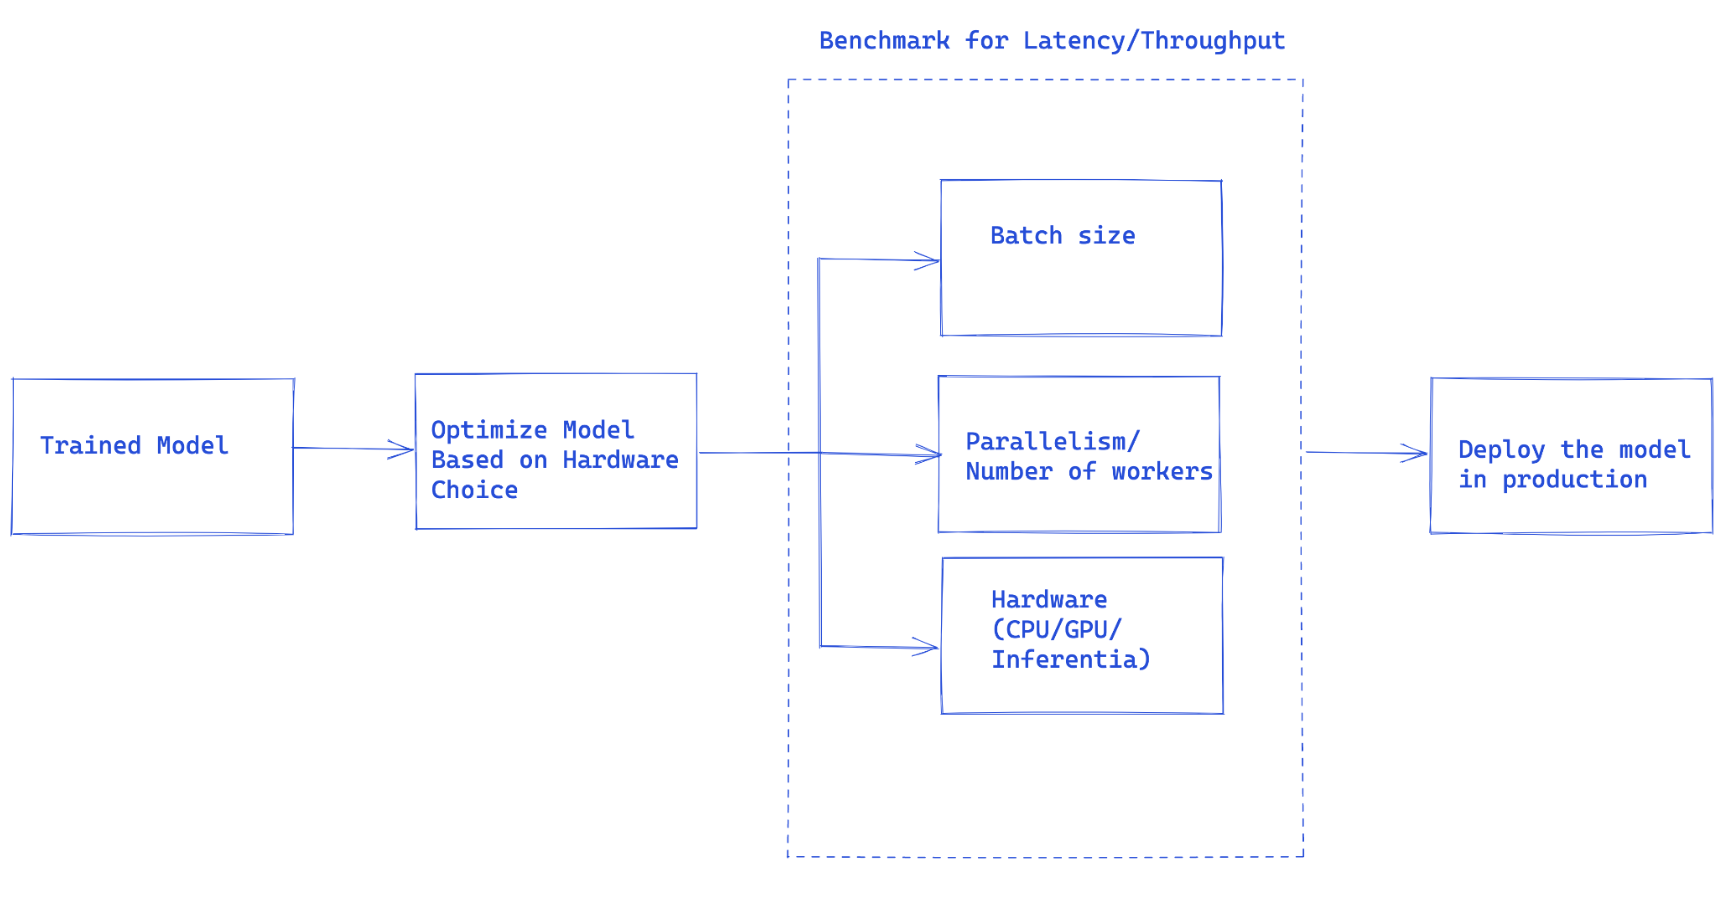
Fig1. Overall flow of Torchserve performance tuning
Once you have trained your model, it needs to be integrated into a larger system to have a full-fledged application, we use the term “model serving” to refer to this integration. Basically model serving is making your trained model available to run inferences and subsequent use of the model.
Torchserve is the Pytorch preferred solution for serving models in production. It is a performant and scalable tool that wraps your model in a HTTP or HTTPS API. It has a frontend implemented in Java that handles multiple tasks from assigning workers for serving models to handling the connection between client and server. Torchserve has a Python backend that is responsible for handling the inference service.
Torchserve supports multi model serving and versioning for AB test, dynamic batching, logging and metrics. It exposes four APIs for inference, explanations, management and metrics.
Inference API is listening on port 8080 and accessible through localhost by default, this can be configured in Torchserve configuration and enable getting predictions from the model.
Explanation API uses Captum under the hood to provide explanations of the model that is being served and listens to the port 8080 as well.
Management API allows to register or unregister and describe a model. It also enables users to scale up or down the number of workers that serve the model.
Metric API by default listens to port 8082 and enables us to monitor the model that is being served.
Torchserve let you scale your model serving and handle the peak traffic by supporting batch inference and multiple workers that serve your model. Scaling can be done through management API and settings through a configuration file. Also, metric API helps you to monitor your model serving through default and customizable metrics.
Other advanced settings such as the length of the queue for the received requests, maximum wait time for a batch of inputs and many other properties are configurable through a config file that can be passed to Torchserve when it is started.
Steps to serve your model with Torchserve
- Install Torchserve, model archiver and its requirements.
- Choose a default handler that fits your task (e.g image classification, etc) or author a custom handler.
- Package your model artifacts (trained model checkpoint and all other necessary files for loading and running your model) and the handler into a “.mar” file using Torcharchive and place it in the model store.
- Start serving your model.
- Run inference. We will discuss model handlers and metrics in more detail here.
Model handlers
Torchserve uses a handler in the backend to load the models, preprocess the received data, run inference and post-process the response. Handler in torchserve is a python script that all the model initialization, preprocessing, inference and post processing logic goes into.
Torchserve provides an out of the box handler for a number of applications like image classification, segmentation, object detection and text classification. It also supports custom handlers, in case your use case is not supported in default handlers.
It provides a great flexibility in custom handlers, this potentially make Torchserve as multi-framework serving tool. Custom handlers let you define your custom logic to initialize a model that can be used also to load models from other frameworks such as ONNX.
Torchserve handler is made of four main functions, initialize, preprocess, inference and postprocess that each return a list. The code snippet below shows an example of a custom handler.Custom handlers inherit from BaseHandler in Torchserve and can overwrite any of the main functions. Here is an example of the handler used for loading the Detectron2 model for figure detection, this model has been exported to Torchscript and uses model.half() to run the inference with FP16, details are explained in another section in this post.
class MyModelHandler(BaseHandler):
    def initialize(self, context):
        self.manifest = ctx.manifest
        properties = ctx.system_properties
        model_dir = properties.get("model_dir")
        serialized_file = self.manifest["model"]["serializedFile"]
        model_pt_path = os.path.join(model_dir, serialized_file)

        self.device = torch.device(
        "cuda:" + str(properties.get("gpu_id"))
        if torch.cuda.is_available() and properties.get("gpu_id") is not None
        else "cpu"
        )
        self.model = torch.jit.load(model_pt_path, map_location=self.device)

        self.model = self.model.half()

    def preprocess(self, data):

        inputs = []
        for request in batch:

            request_body = request.get("body")

            input_ = io.BytesIO(request_body)
            image = cv2.imdecode(np.fromstring(input_.read(), np.uint8), 1)
            input = torch.Tensor(image).permute(2, 0, 1)
            input = input.to(self.device)
            input = input.half()
            inputs.append({"image": input})

        return inputs

    def inference(self,inputs):
        predictions = self.model(**inputs)
        return predictions

    def postprocess(self, output):
        responses = []
        for inference_output in inference_outputs:
            responses_json = {
            'classes': inference_output['pred_classes'].tolist(),
            'scores': inference_output['scores'].tolist(),
            "boxes": inference_output['pred_boxes'].tolist()
            }
            responses.append(json.dumps(responses_json))

        return responses
Metrics
An essential component in serving models in production is the ability to monitor them. Torchserve collects system level metrics regularly and allows adding custom metrics as well.
System level metrics consist of CPU utilization, available and used disk space and memory on the host machine along with number of requests with different response codes (e.g 200-300, 400-500 and above 500). Custom metrics can be added to the metrics as explained here. TorchServe logs these two sets of metrics to different log files. Metrics are collected by default at:
- System metrics – log_directory/ts_metrics.log
- Custom metrics – log directory/model_metrics.log
As mentioned before, Torchserve also exposes metric API, that by default listens to port 8082 and enables users to query and monitor the collected metrics. The default metrics endpoint returns Prometheus formatted metrics. You can query metrics using curl requests or point a Prometheus Server to the endpoint and use Grafana for dashboards.
While serving a model you can query metrics using curl request as follows:
curl http://127.0.0.1:8082/metrics
In case you are looking into exporting the logged metrics, please refer to this example that uses mtail to export metrics to Prometheus. Tracking these metrics in a dashboard allows you to monitor performance regressions that may have been sporadic or hard to spot during an offline benchmark run.
What to consider for tuning performance of a model in production
The workflow suggested in Fig 1, is the general idea on how to approach model deployment in production with Torchserve.
In many cases serving models in production is optimized based on throughput or latency service level agreement (SLA)s. Usually real-time applications are more concerned about latency whereas off-line applications may care more about higher throughput.
There are a number of main factors contributing to the performance of a serving model in production. In particular, we are focusing on serving Pytorch models with Torchserve here, however most of these factors generalize to all models from other frameworks as well.
- Model optimizations: this is a pre-step for deploying models into production. This is a very broad discussion that we will get into in a series of future blogs. This includes techniques like quantization, pruning to decrease the size of the model, using Intermediate representations (IR graphs) such as Torchscript in Pytorch, fusing kernels and many others. Currently torchprep provides many of these techniques as a CLI tool.
- Batch inference: it refers to feeding multiple inputs into a model, while it is essential during training, it can be very helpful to manage the cost at inference time as well. Hardware accelerators are optimized for parallelism and batching helps to saturate the compute capacity and often leads to higher throughput. The main difference in inference is you can’t wait too long to get a batch filled from clients, something we call dynamic batching
- Number of Workers : Torchserve uses workers to serve models. Torchserve workers are Python processes that hold a copy of the model weights for running inference. Too few workers means you’re not benefitting from enough parallelism but too many can cause worker contention and degrade end to end performance.
- Hardware : choosing the appropriate hardware based on the model, application and latency, throughput budget. This could be one of the supported hardwares in Torchserve, CPU, GPU, AWS Inferentia. Some hardware configurations are intended for best in class performance and others are better suited for cost effective inference. From our experiments we’ve found that GPUs shine best at larger batch sizes whereas the right CPUs and AWS Inferentia can be far more cost effective for lower batch sizes and low latency.
Best Practices for Performance tuning on Torchserve
To get the best performance out of your model while serving it with Torchserve, we are sharing some of the best practices here. Torchserve provides a benchmark suite that provides helpful insight to make informed decisions on different choices as detailed below.
- Optimize your model as the first step, Pytorch model optimization tutorials. Model optimization choices are also closely tied to the hardware of choice. We will discuss it in more detail in another blog post.
- Deciding the hardware for model deployment can be closely related to the latency and throughput budget and cost per inference. Depending on the size of model and application it can vary, for some models like computer vision models it has been historically not affordable to run in production on CPU. However, by having optimizations such IPEX as recently added to Torchserve this has been much more affordable and cost beneficial and you can learn more in this investigative case study
- Workers in Torchserve are Python processes that provide parallelism, setting the number of workers should be done carefully. By default Torchserve launch number of workers equal to VCPUs or available GPUs on the host, this can add a considerable amount of time to the Torchserve start.Torchserve exposes a config property to set the number of workers. To provide an efficient parallelism through multiple workers and avoiding them to compete over resources, as a baseline we recommend following setting on CPU and GPU:CPU : In the handler,
torch.set_num_threads(1)then set the number of workers tonum physical cores / 2.But the the best threading configurations can be achieved by leveraging the Intel CPU launcher script.GPU: number of available GPUs can be set through number_gpus in config.properties. Torchserve uses round robin to assign workers to GPUs. We recommend setting the number of workers as follows.Number of worker = (Number of available GPUs) / (Number of Unique Models).Note that GPUs that are pre-Ampere do not provide any resource isolation with Multi Instance GPUs. - Batch size can directly affect the latency and the throughput. To better utilize the compute resources batch size needs to be increased. However, there is a tradeoff between latency and throughput. Larger batch sizes can increase the throughput but results in a higher latency as well. Batch size can be set in Torchserve in two ways, either through model config in config.properties or while registering the model using Management API.
In the next section, we are going to use Torchserve benchmark suite to decide the best combination of model optimization, hardware, workers, and batch size.
Animated Drawings Performance Tuning
To use the Torchserve benchmark suite, first we need to have an archived file, “.mar” file as discussed above, that contains the model, handler and all other artifacts to load and run inference. Animated Drawings uses Detectron2’s implementation of Mask-RCNN for an object detection model.
How to run benchmark suite
The Automated benchmark suite in Torchserve let you benchmark multiple models with different setting including batch size and number of worker and finally generate a report for you. To get started:
git clone https://github.com/pytorch/serve.git

cd serve/benchmarks

pip install -r requirements-ab.txt

apt-get install apache2-utils
Model level settings can be configured in a yaml file similar to
Model_name:
    eager_mode:
        benchmark_engine: "ab"
        url: "Path to .mar file"
        workers:
            - 1
            - 4
        batch_delay: 100
        batch_size:
            - 1
            - 2
            - 4
            - 8
        requests: 10000
        concurrency: 10
        input: "Path to model input"
        backend_profiling: False
        exec_env: "local"
        processors:
            - "cpu"
            - "gpus": "all"
This yaml file will be referenced in the benchmark_config_template.yaml file that includes other settings for generating reports, this can optionally work with AWS cloud watch for logs as well.
python benchmarks/auto_benchmark.py --input benchmark_config_template.yaml
Running the benchmarks, results will be written in “csv” file that can be found in “_ /tmp/benchmark/ab_report.csv_” and full report “/tmp/ts_benchmark/report.md”. It will include items such as Torchserve average latency, model P99 latency, throughput, number of concurrency, number of requests, handler time, and some other metrics. Here we focus on some of the important ones that we track to tune the performance which are, concurrency, model P99 latency, throughput. We look at these numbers specifically in combination with batch size, the used device, number of workers and if any model optimization has been done.
The latency SLA for this model has been set to 100 ms, this is real-time application and as we discussed earlier, latency is more of a concern and throughput ideally should be as high as possible while it does not violate the latency SLA.
Through searching the space, over different batch sizes (1-32), number of workers (1-16) and devices (CPU,GPU), we have run a set of experiments that summarized the best ones in the table below.
| Device | Concurrency | # Requests | #workers | Batch size | Payload/image | Optimization | Throughput | Latency P99 |
|---|---|---|---|---|---|---|---|---|
| CPU | 10 | 1000 | 1 | 1 | small | N/A | 3.45 | 305.3 ms |
| CPU | 1 | 1000 | 1 | 1 | small | N/A | 3.45 | 291.8 ms |
| GPU | 10 | 1000 | 1 | 1 | small | N/A | 41.05 | 25.48 ms |
| GPU | 1 | 1000 | 1 | 1 | small | N/A | 42.21 | 23.6 ms |
| GPU | 10 | 1000 | 1 | 4 | small | N/A | 54.78 | 73.62 ms |
| GPU | 10 | 1000 | 1 | 4 | small | model.half() | 78.62 | 50.69 ms |
| GPU | 10 | 1000 | 1 | 8 | small | model.half() | 85.29 | 94.4 ms |
The latency of this model on CPU with all of the tried settings in terms of batch size, concurrency and number of workers did not meet the SLA, in fact ~13x higher.
Moving the model serving to GPU, immediately could improve the latency ~**13x **from 305 ms down to 23.6 ms.
One of the simplest optimizations that we could do for the model was lowering its precision to fp16, it is one liner (model.half()) and could reduce the model P99 latency **by **32% and increase the throughput by almost the same amount.
There could be other optimization done by Torchscripting the model and using optimize_for_inference or other tricks including onnx or tensorrt runtime optimizations which leverage aggressive fusions are out of the scope of this post. We will discuss model optimizations in a separate post.
We found both on CPU and GPU , setting **number of workers=1 **worked the best in this case.
- Moving the model to GPU, using number of workers = 1, and batch size = 1 increased the Throughput ~12x compared to CPU and latency ~13x.
- Moving the model to GPU, using model.half(), number of workers = 1, and batch size = 8 yielded best results in terms of Throughput and tolerable latency. Throughput increased ~25x compared to CPU with latency still meeting the SLA (94.4ms).
Note: if you are running the benchmark suite, make sure you are setting a proper batchdelay and set the concurrency of the request to a number proportional to your batch size. Concurrency here means the number of concurrent requests being sent to the server.
Conclusion
In this post, we have discussed the considerations and knobs that Torchserve expose to tune the performance in production. We have discussed the Torchserve benchmark suite as a means to tune the performance and get insights on possible choices for model optimizations, hardware choice and cost in general. We used Animated Drawings app which uses Detectron2’s Mask-RCNN model as a case-study to showcase the performance tuning with benchmark suite.
For more details on Performance tuning in Torchserve please refer to our documentation here. Also feel free to open a ticket on Torchserve repo for any further questions and feedback.
Acknowledgement
We would like to thank Somya Jain (Meta), Christopher Gustave (Meta) for their great support and guidance throughout many steps of this blog and providing insights to Sketch Animator workflow. Also, special thanks to Li Ning from AWS for the great efforts to make performance tuning much easier on Torchserve with automated benchmark suite.