pandas for Data Science (Learning Path) – Real Python (original) (raw)
Learning Path ⋅ Skills: pandas, Data Science, Data Visualization

In this learning path, you’ll get started with pandas and get to know the ins and outs of how you can use it to analyze data with Python.
pandas is a game-changer for data science and analytics, particularly if you came to Python because you were searching for something more powerful than Excel and VBA. pandas uses fast, flexible, and expressive data structures designed to make working with relational or labeled data both easy and intuitive.
pandas for Data Science
Learning Path ⋅ 13 Resources

Course
Explore Your Dataset With pandas
Learn how to start exploring a dataset with pandas and Python. You'll learn how to access specific rows and columns to answer questions about your data. You'll also see how to handle missing values and prepare to visualize your dataset in a Jupyter Notebook.

Course
The pandas DataFrame: Working With Data Efficiently
In this course, you'll get started with pandas DataFrames, which are powerful and widely used two-dimensional data structures. You'll learn how to perform basic operations with data, handle missing values, work with time-series data, and visualize data from a pandas DataFrame.
Course
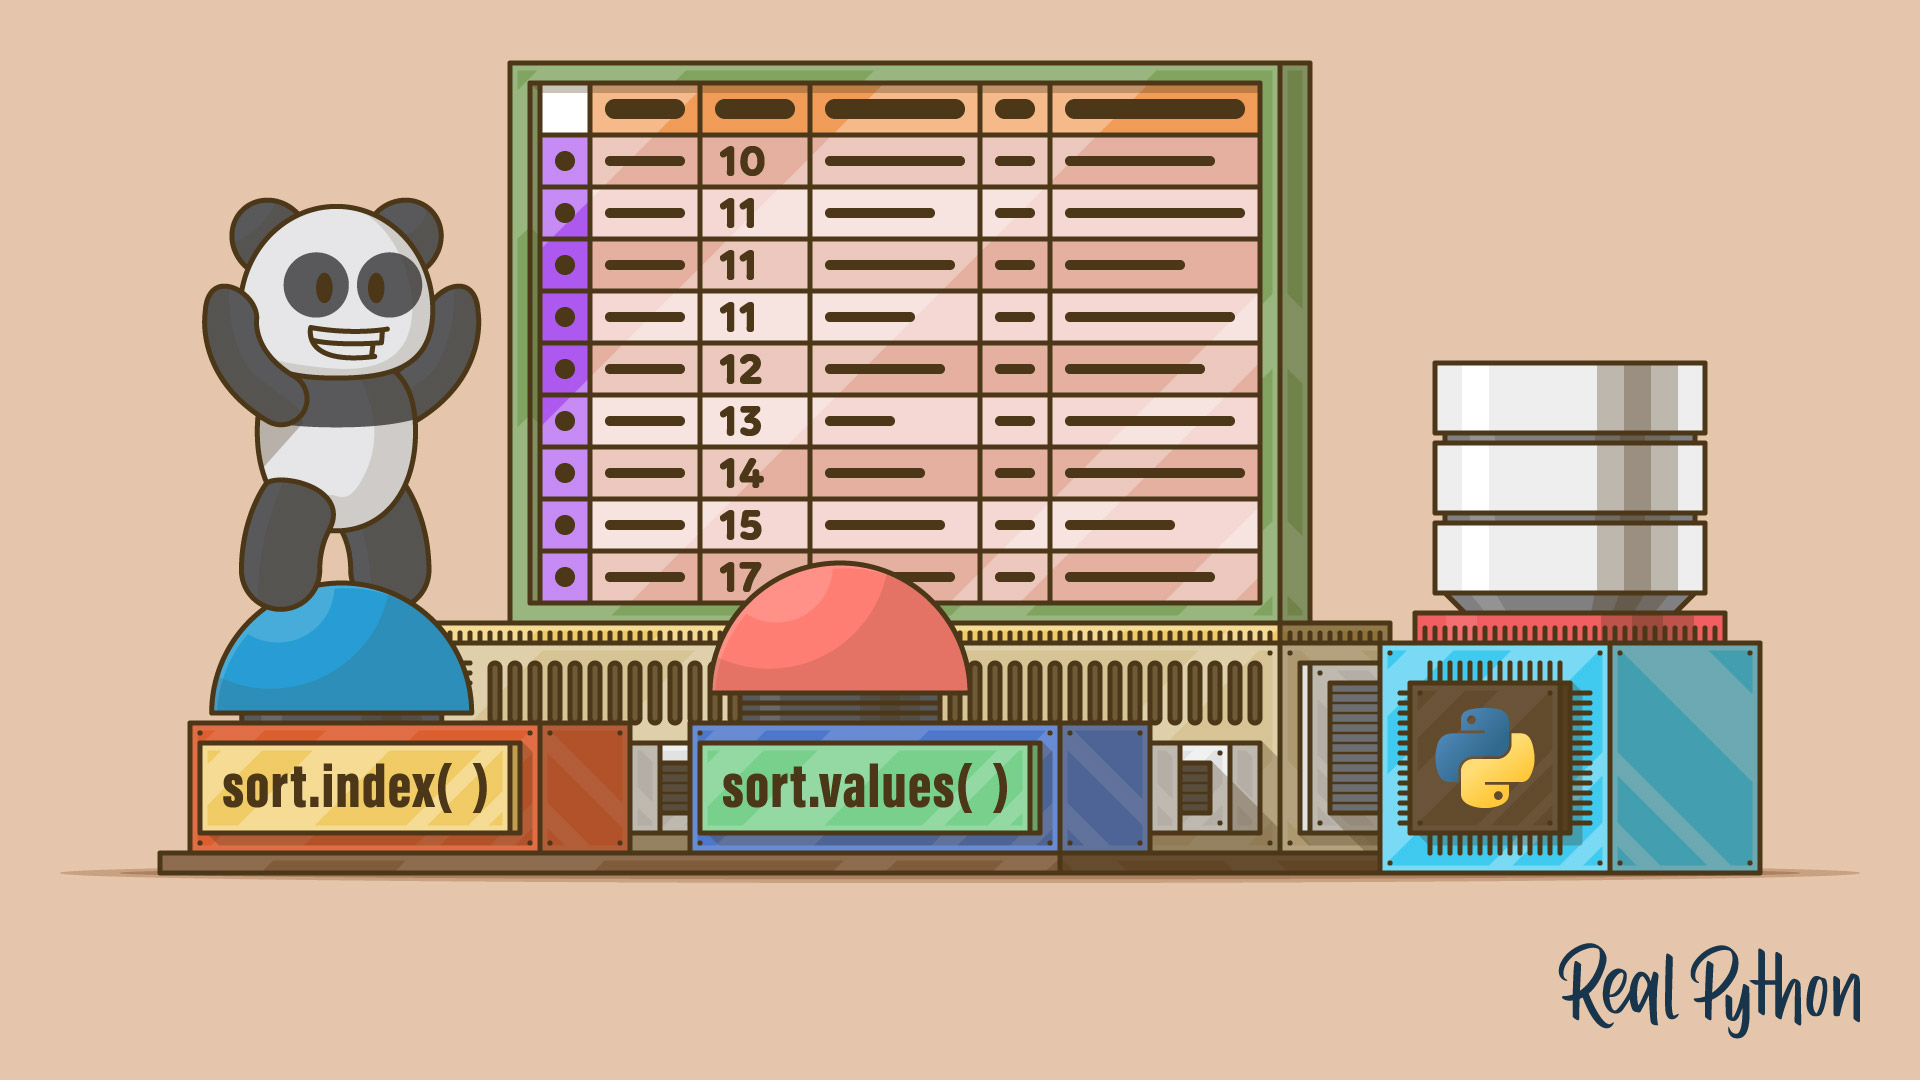
Sorting Data in Python With pandas
Learn how to sort data in a pandas DataFrame using the pandas sort functions sort_values() and sort_index(). You'll learn how to sort by one or more columns and by index in ascending or descending order.

Course
Data Cleaning With pandas and NumPy
Learn how to clean up messy data using pandas and NumPy. You'll become equipped to deal with a range of problems, such as missing values, inconsistent formatting, malformed records, and nonsensical outliers.
Course
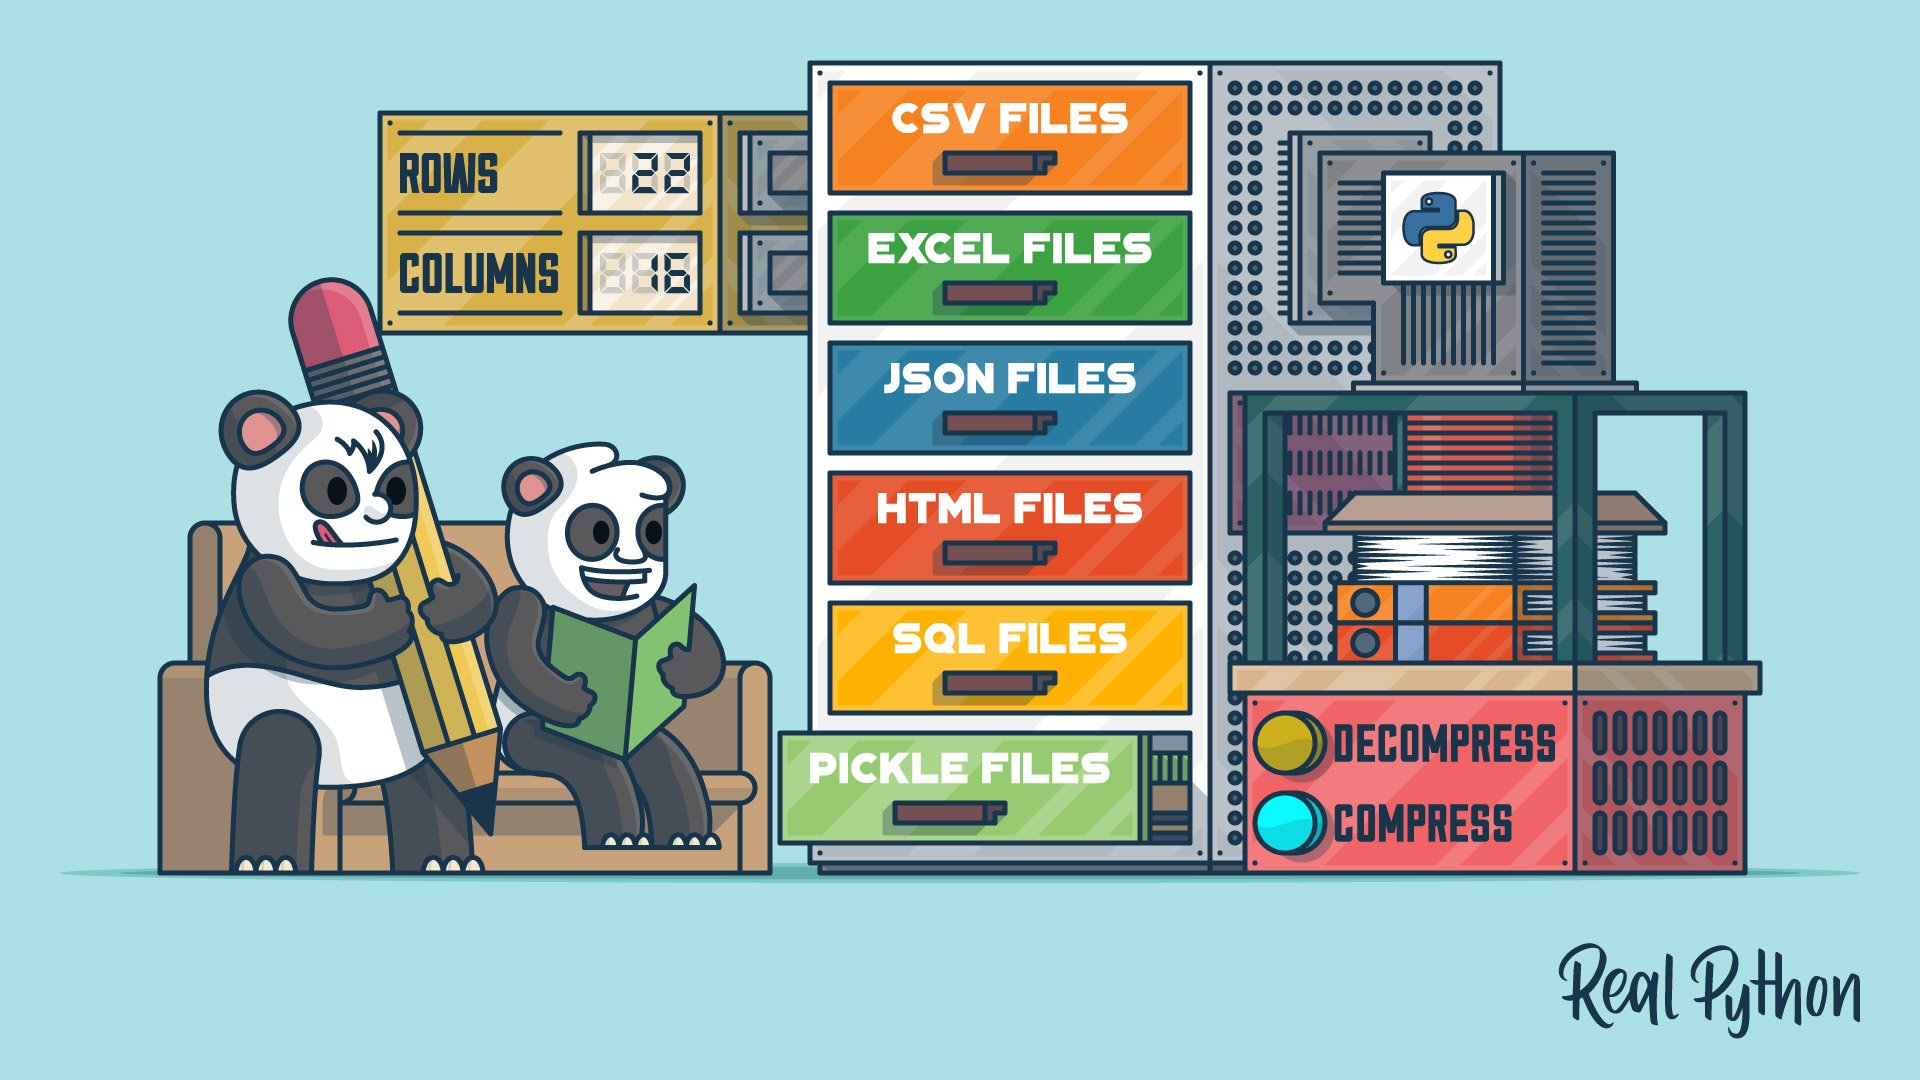
Reading and Writing Files With pandas
Learn about the pandas IO tools API and how you can use it to read and write files. You'll use the pandas read_csv() function to work with CSV files. You'll also cover similar methods for efficiently working with Excel, CSV, JSON, HTML, SQL, pickle, and big data files.


Course
Plot With pandas: Python Data Visualization Basics
In this course, you'll get to know the basic plotting possibilities that Python provides in the popular data analysis library pandas. You'll learn about the different kinds of plots that pandas offers, how to use them for data exploration, and which types of plots are best for certain use cases.


Course
pandas GroupBy: Grouping Real World Data in Python
Learn how to work adeptly with the pandas GroupBy while mastering ways to manipulate, transform, and summarize data. You'll work with real-world datasets and chain GroupBy methods together to get data into an output that suits your needs.

Tutorial
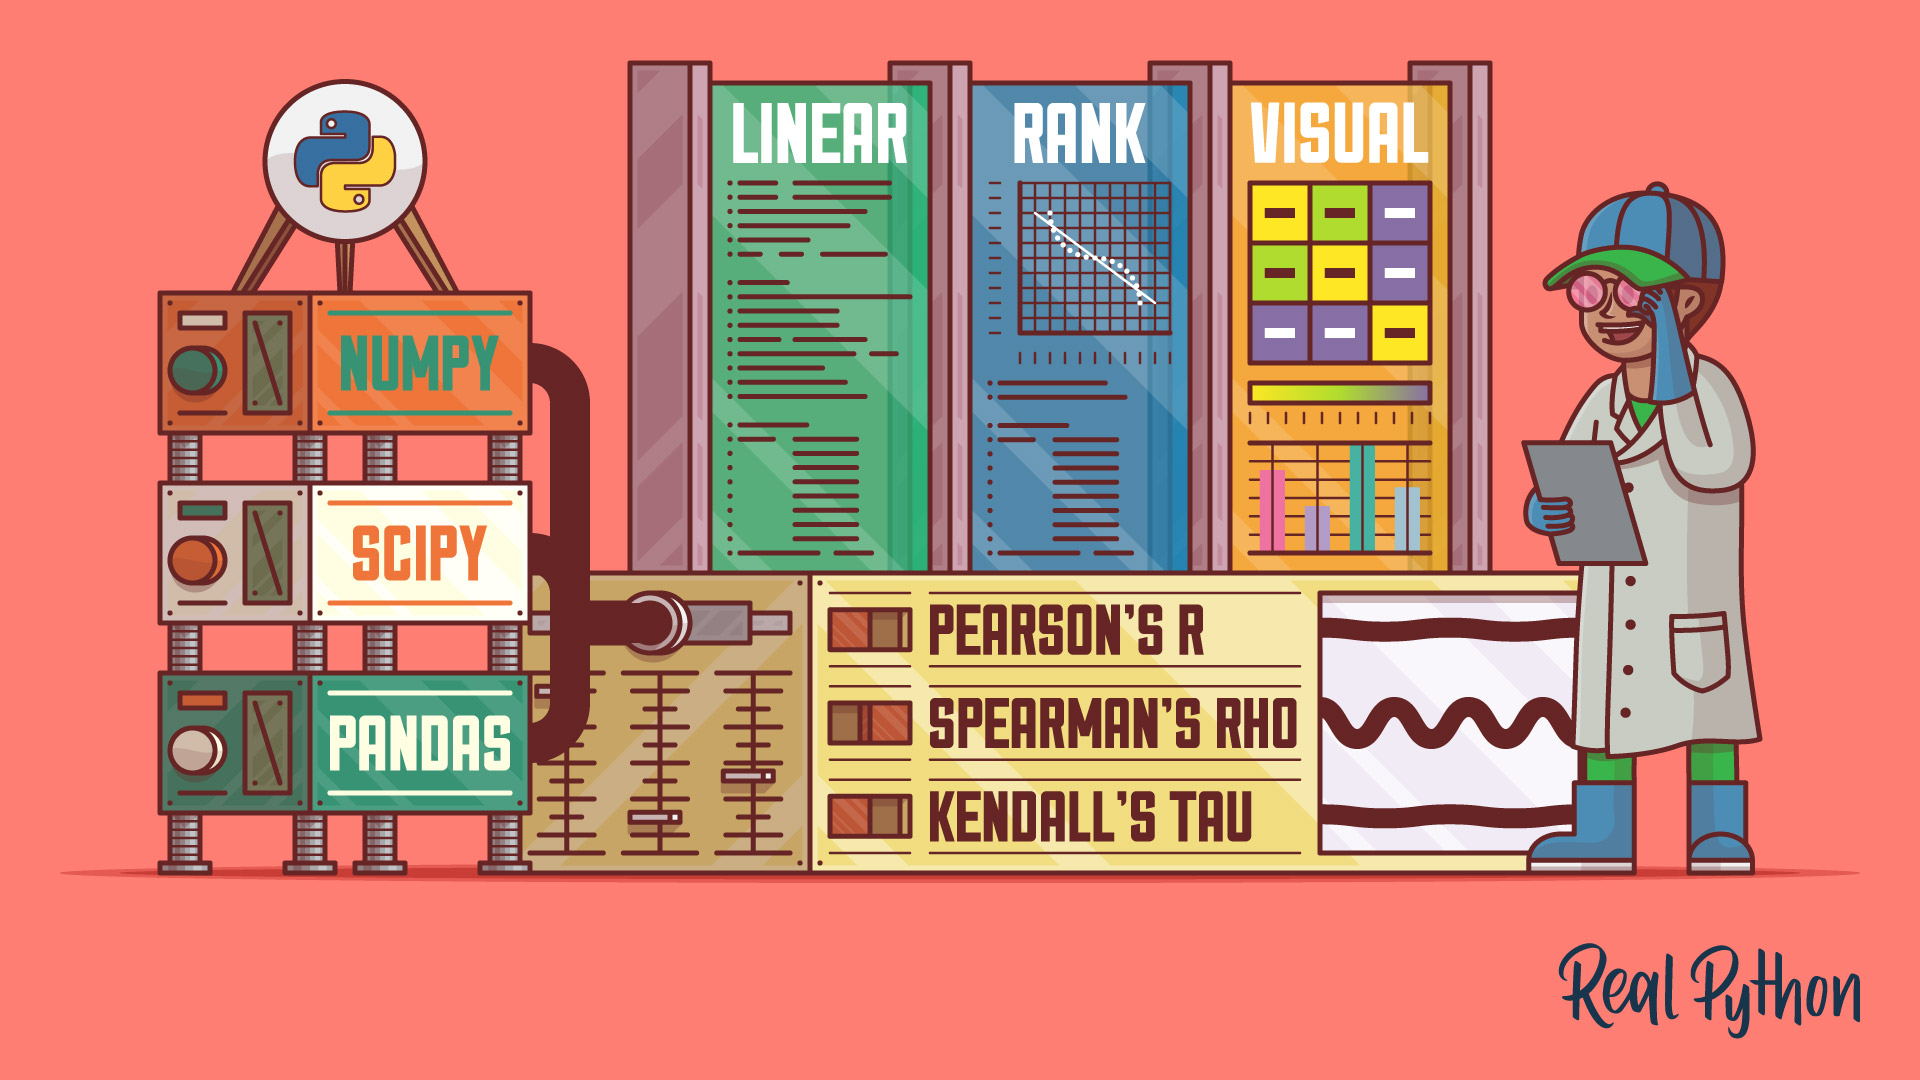
NumPy, SciPy, and pandas: Correlation With Python
Learn what correlation is and how you can calculate it with Python. You'll use SciPy, NumPy, and pandas correlation methods to calculate three different correlation coefficients. You'll also see how to visualize data, regression lines, and correlation matrices with Matplotlib.


Course
Using pandas to Make a Gradebook in Python
With this course and Python project, you'll build a script to calculate grades for a class using pandas. The script will quickly and accurately calculate grades from a variety of data sources. You'll see examples of loading, merging, and saving data with pandas, as well as plotting some summary statistics.