Galleries of images produced with ROOT (original) (raw)
Higgs Plots
This gallery shows some of the plots (produced using ROOT) presented when the Higgs boson discovery was announced at CERN.
 Atlas CLs Exclusion Atlas CLs Exclusion |
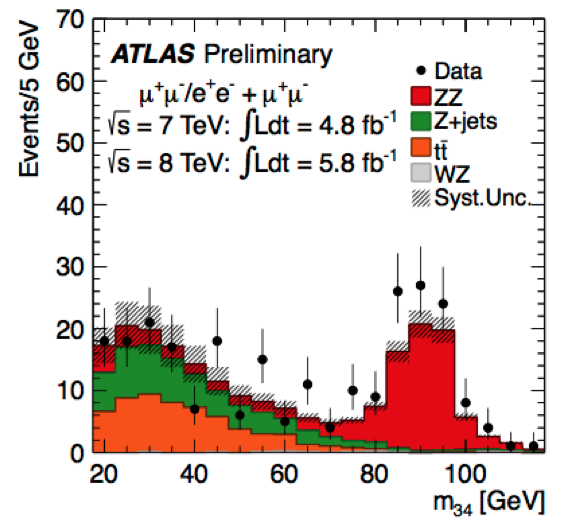 Atlas Data MC Comparison Atlas Data MC Comparison |
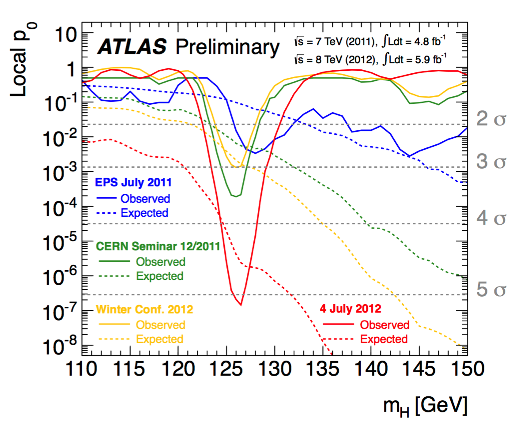 Atlas P0 Trends Atlas P0 Trends |
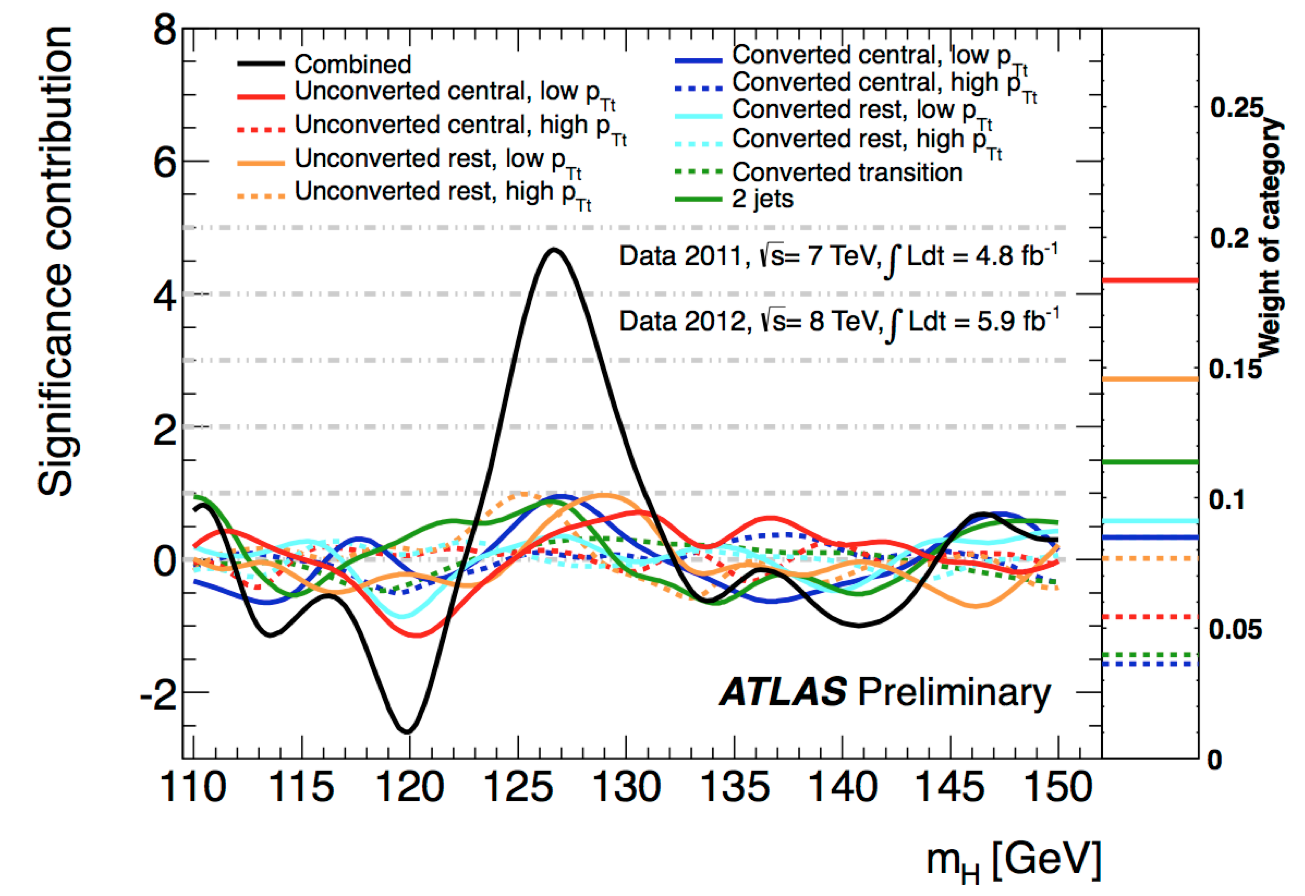 Atlas Signifiance Channel by Channel Atlas Signifiance Channel by Channel |
 CMS 2D Cf-Cv Likelihood Profile CMS 2D Cf-Cv Likelihood Profile |
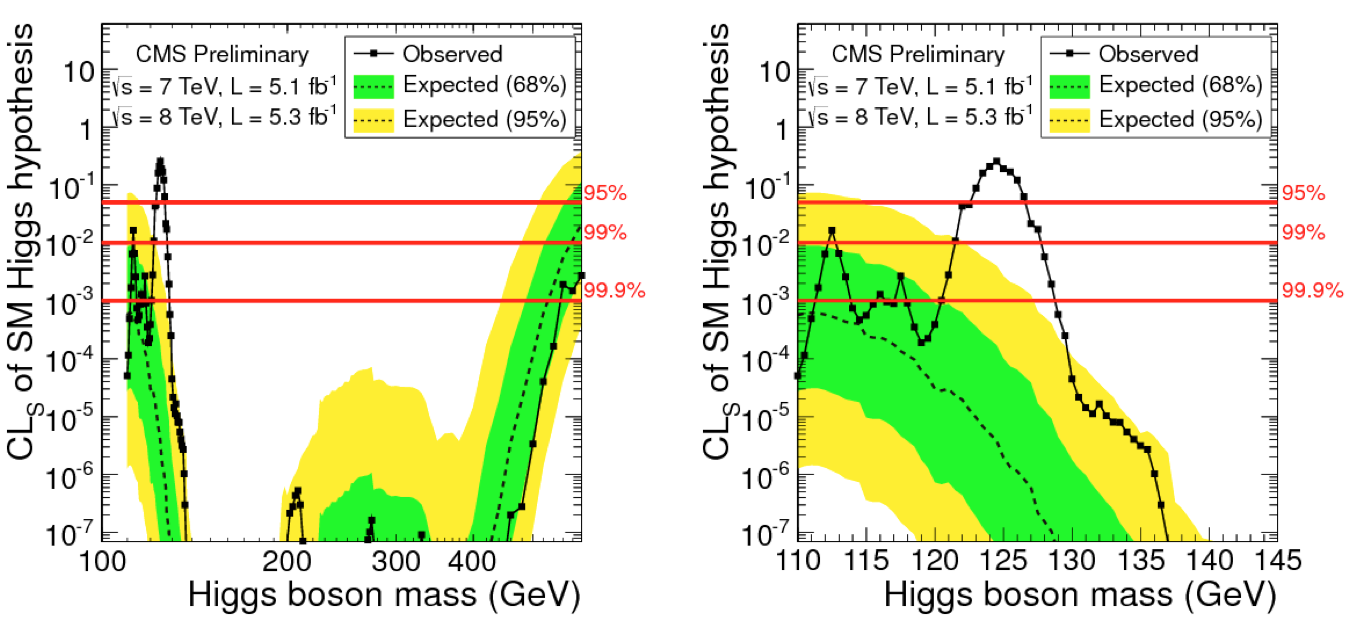 CMS CLs Exclusion Plot CMS CLs Exclusion Plot |
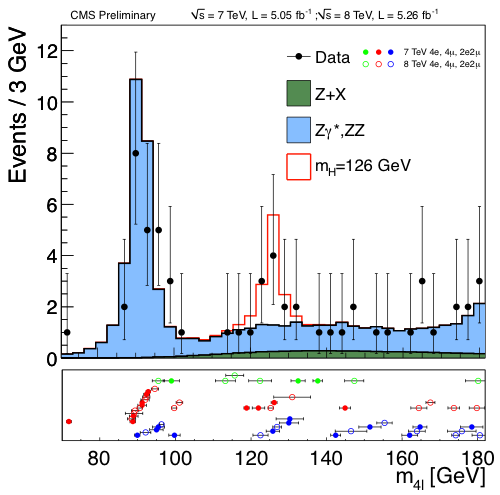 CMS Data MC Ratio Plot CMS Data MC Ratio Plot |
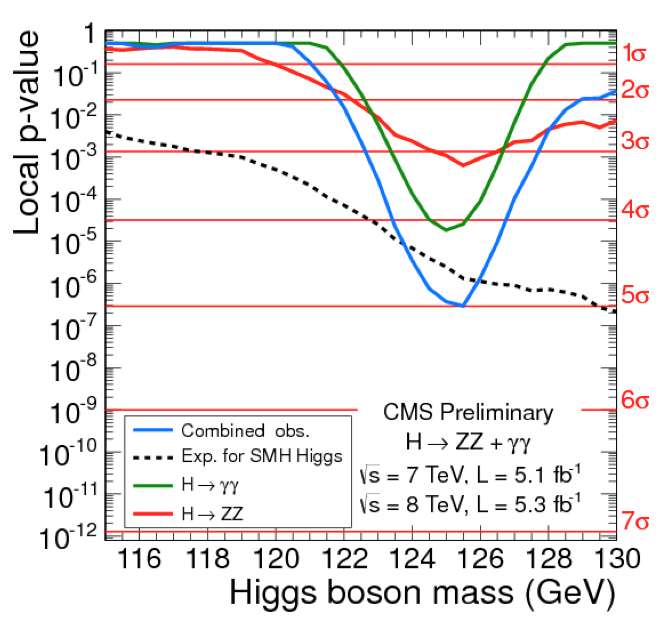 CMS P-Value trends CMS P-Value trends |
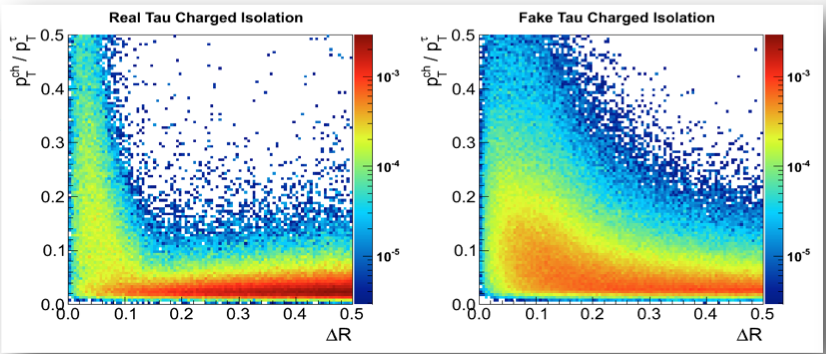 CMS Tau Discrimination CMS Tau Discrimination |
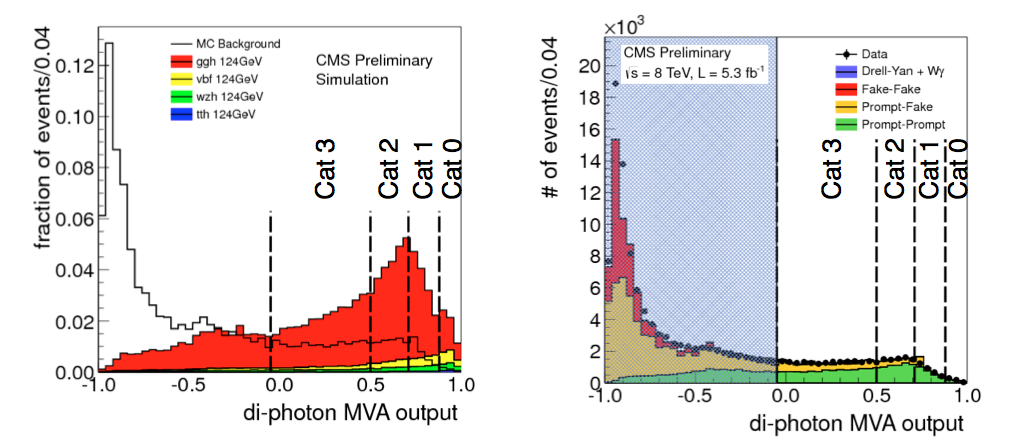 CMS y MVA Discrimination CMS y MVA Discrimination |
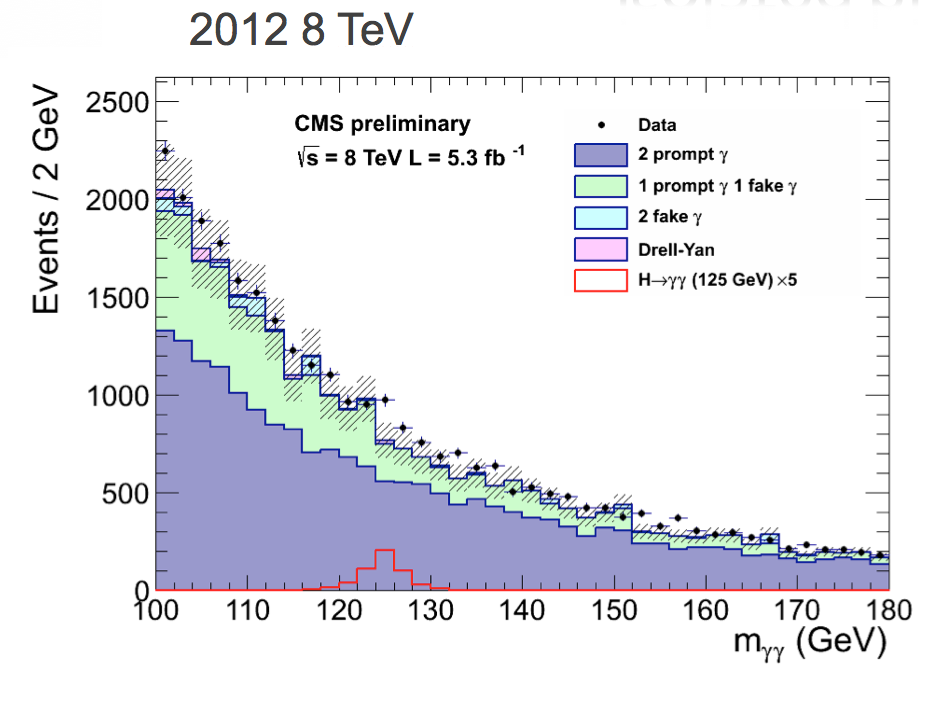 CMS γγ Inv. Mass Data MC comparison CMS γγ Inv. Mass Data MC comparison |
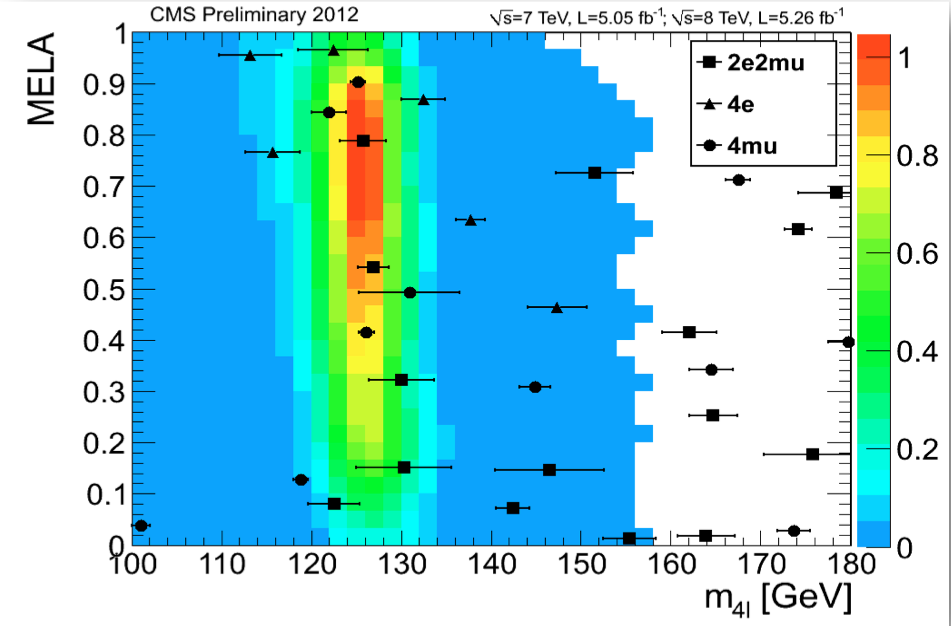 MELA Dilepton Channels MELA Dilepton Channels |
Detectors
This gallery shows some detector’s geometries produced using ROOT.
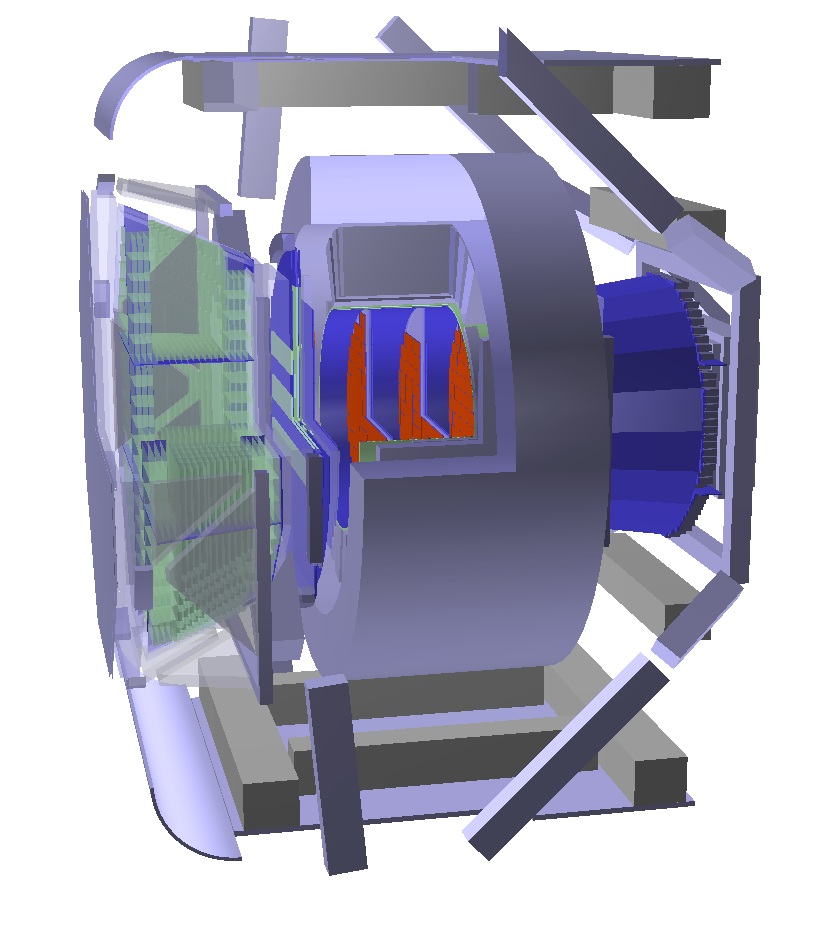 AMS detector AMS detector |
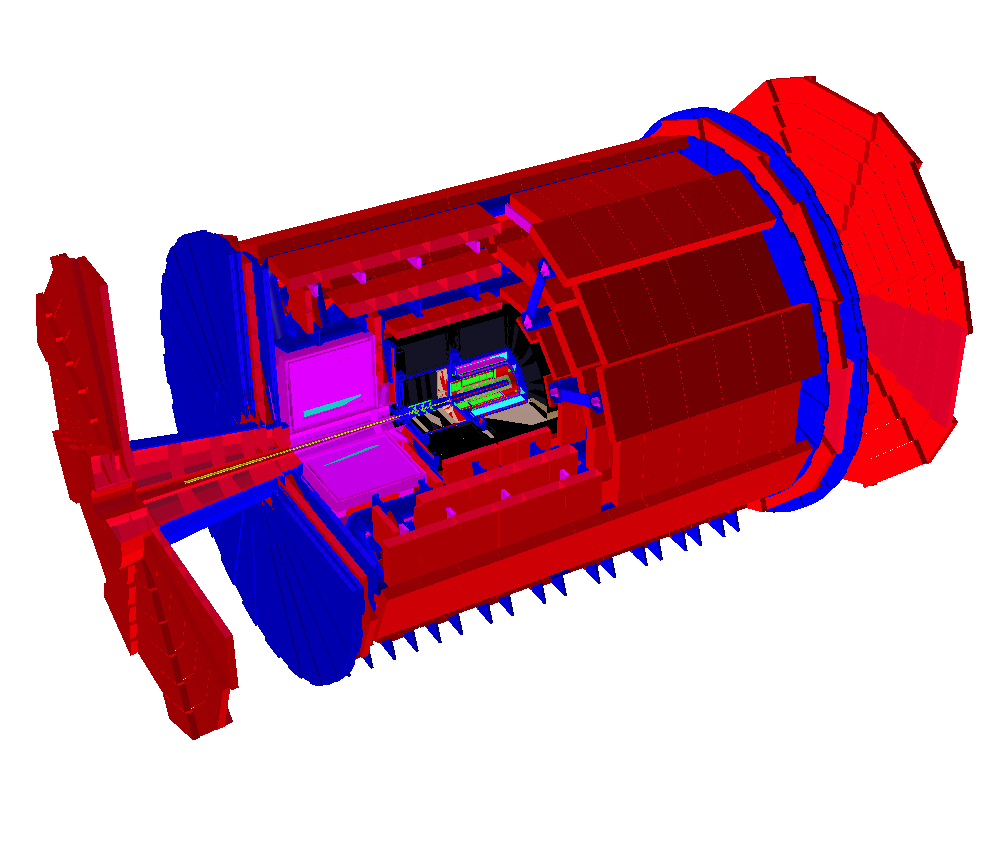 ATLAS detector ATLAS detector |
 Aleph detector Aleph detector |
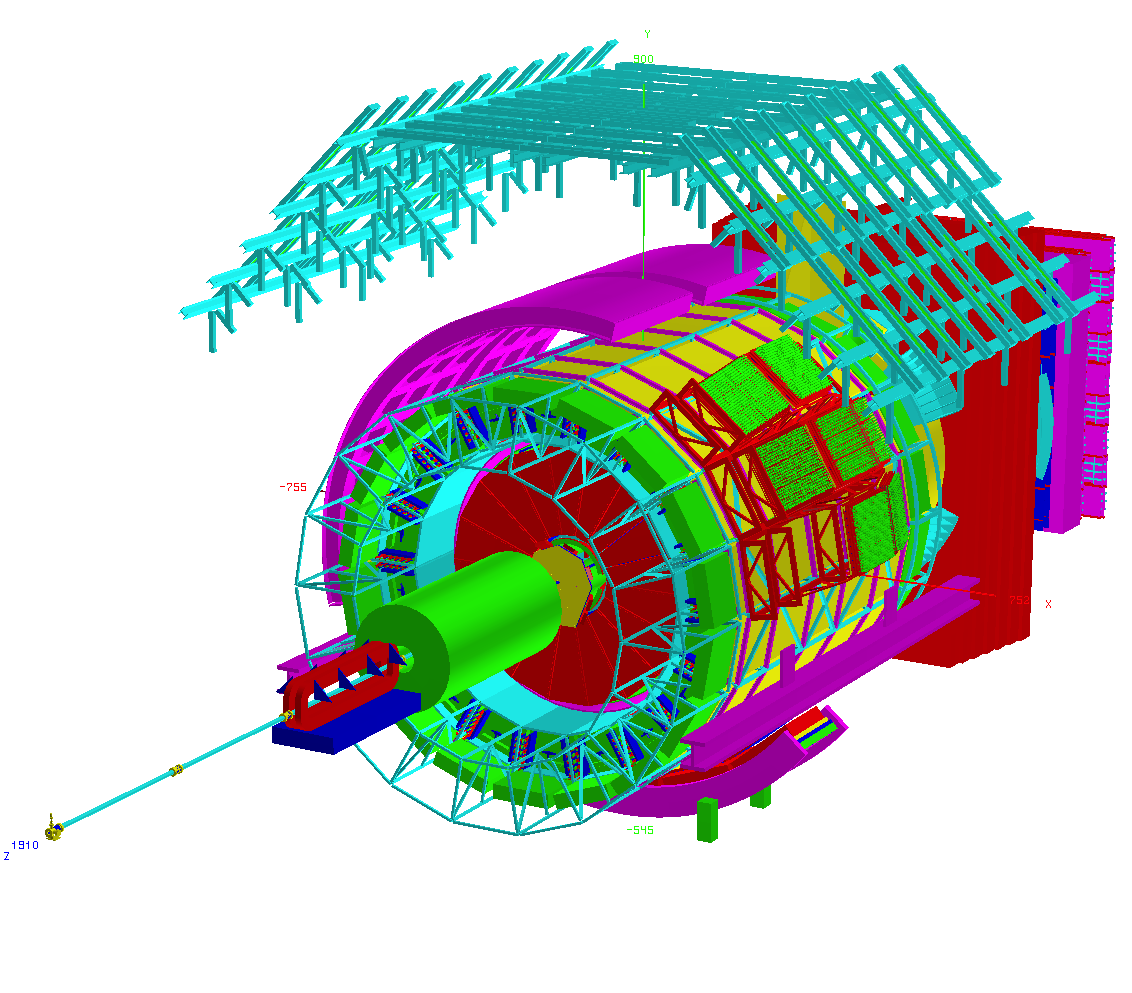 Alice detector Alice detector |
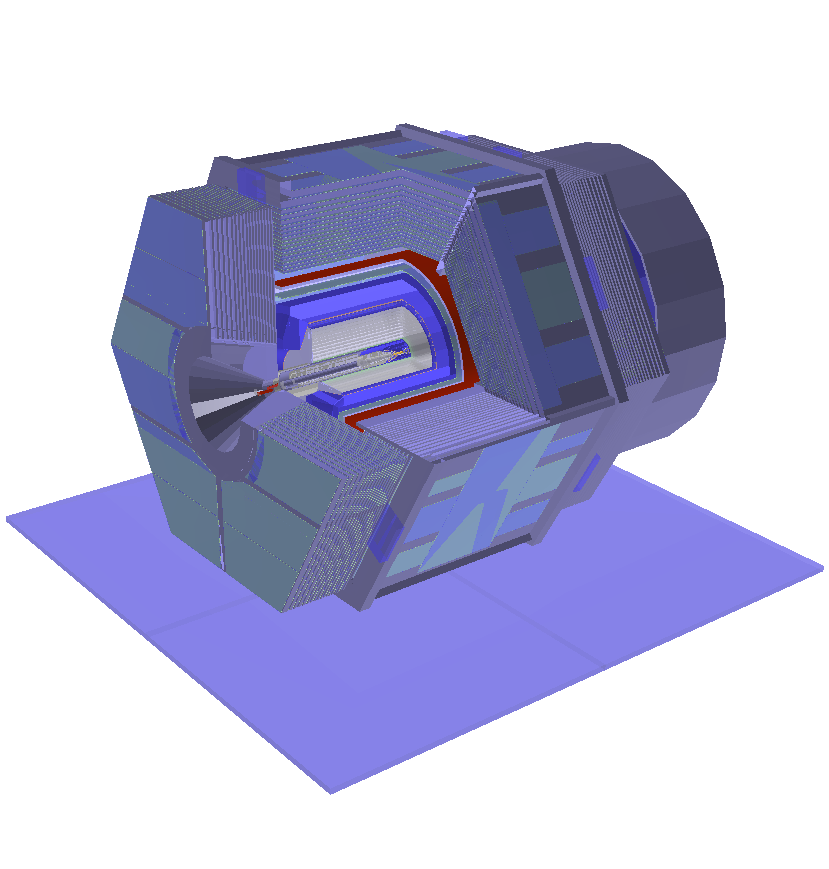 BABAR detector BABAR detector |
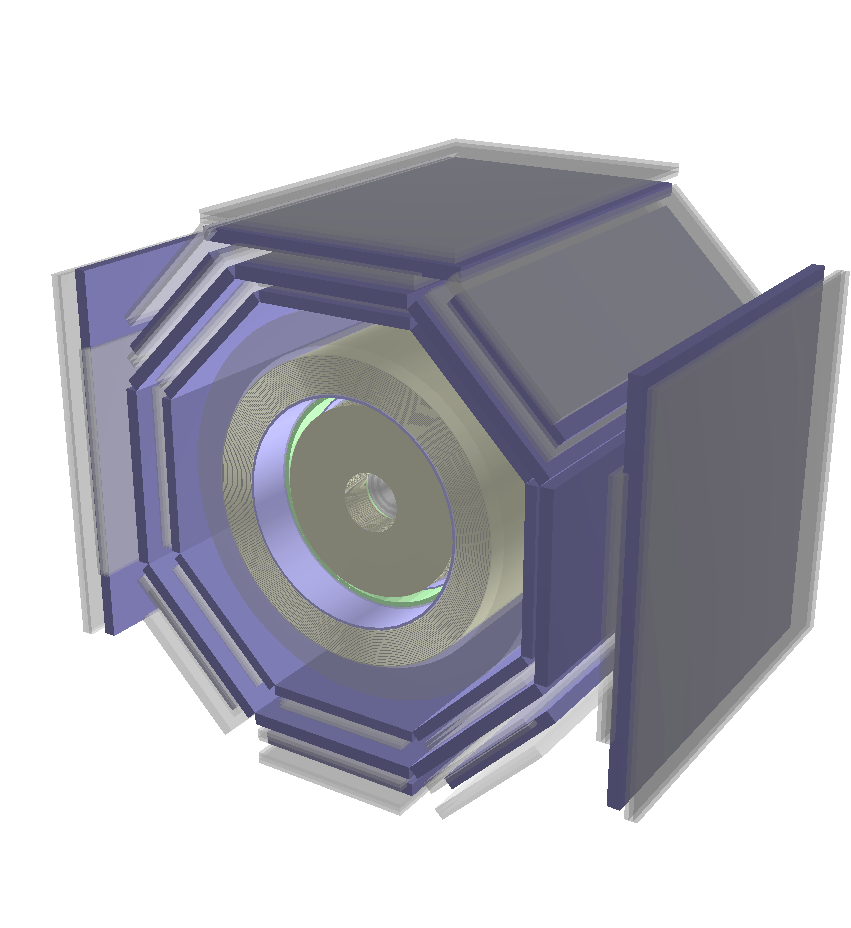 BES detector BES detector |
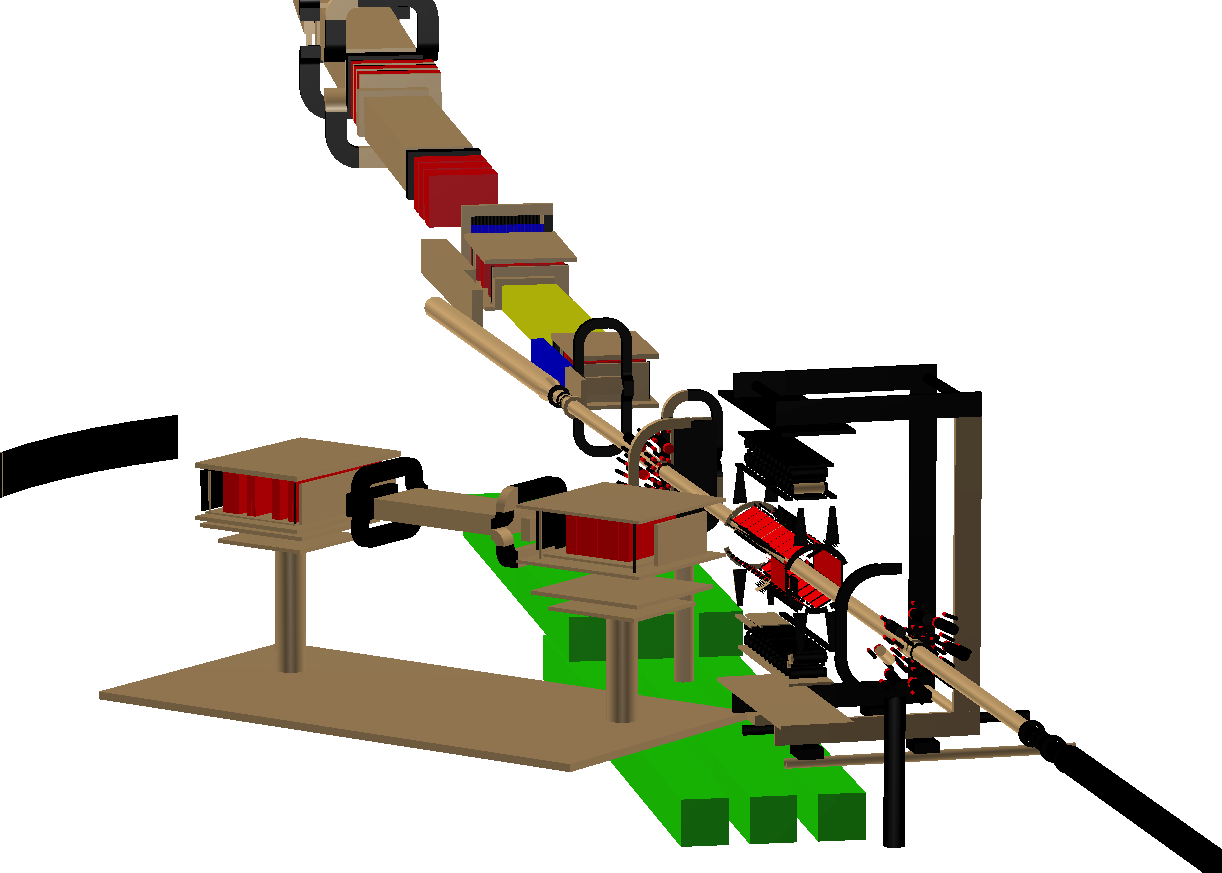 BRAHMS detector BRAHMS detector |
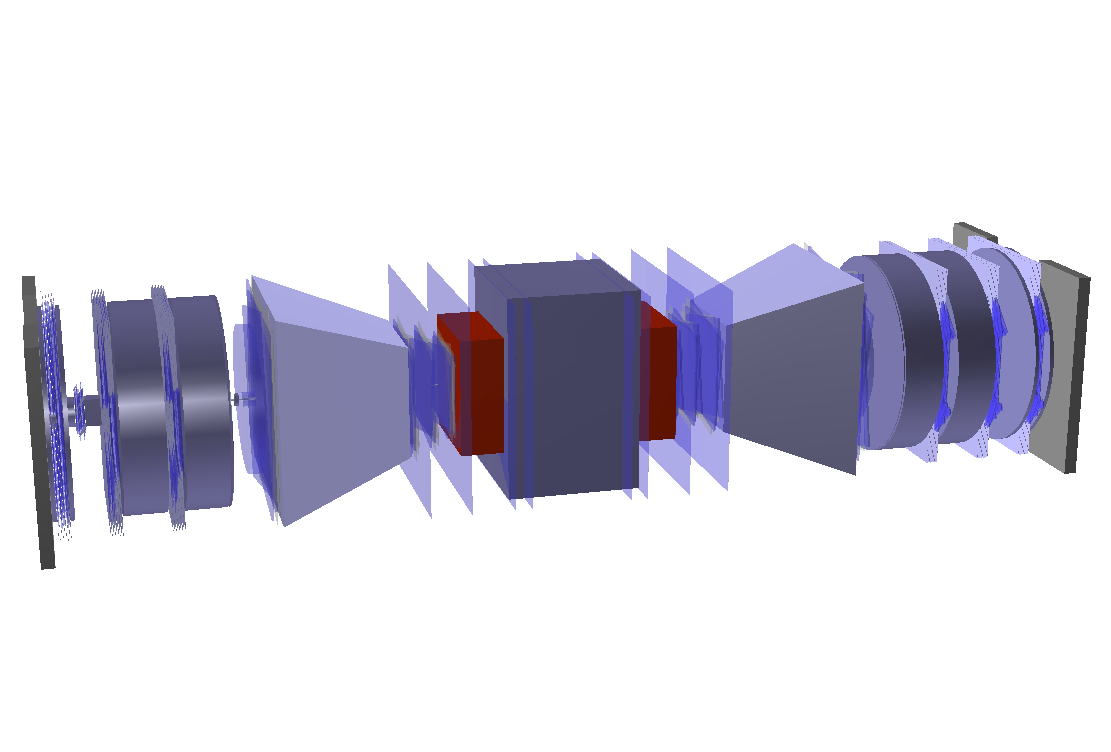 BTEV detector BTEV detector |
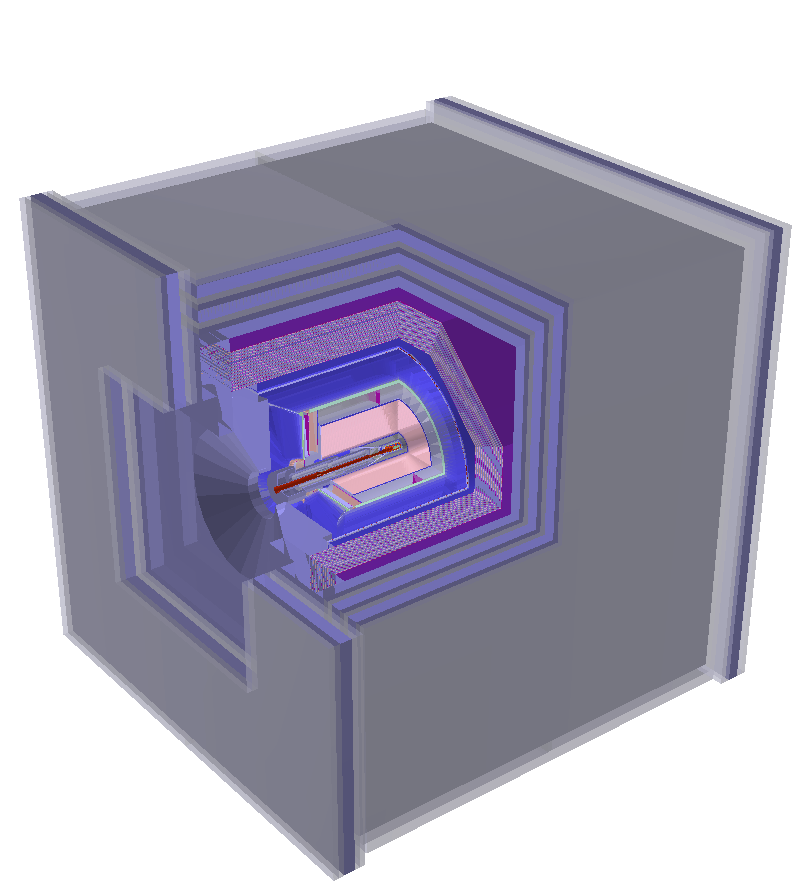 Belle detector Belle detector |
 CDF detector CDF detector |
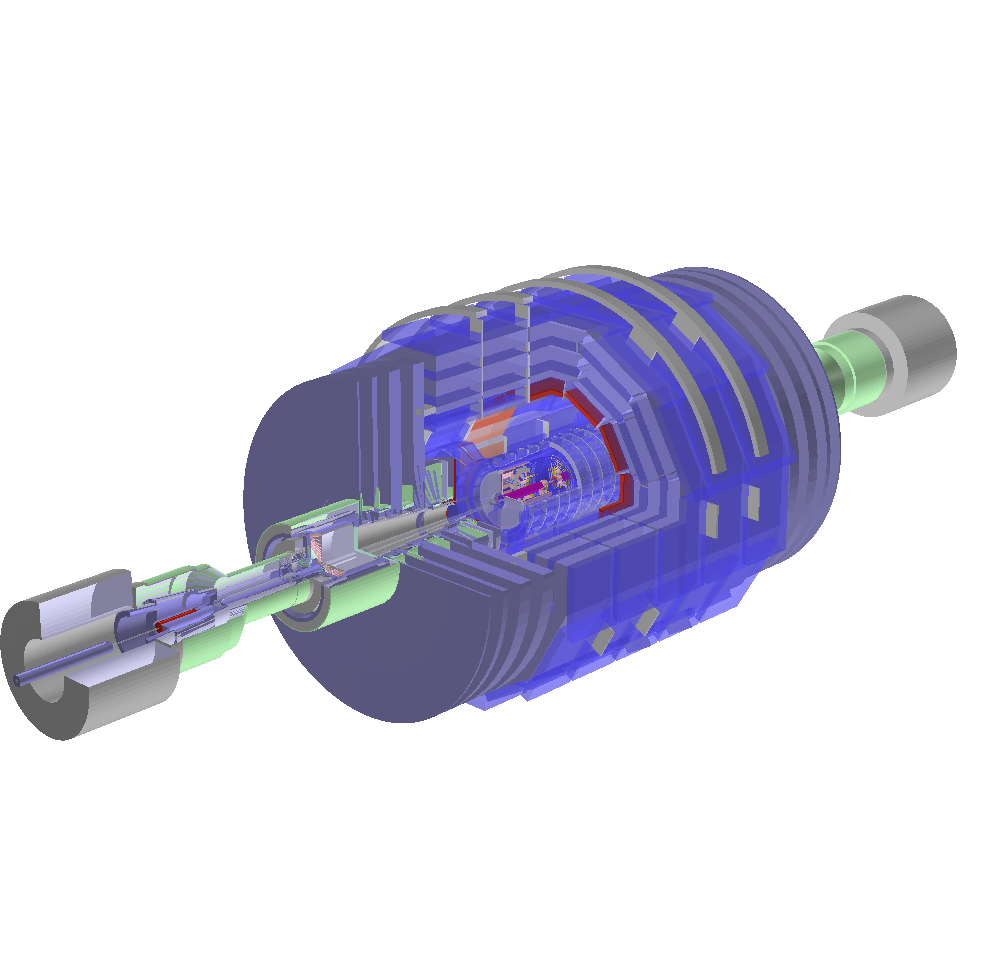 CMS detector CMS detector |
 D0 detector D0 detector |
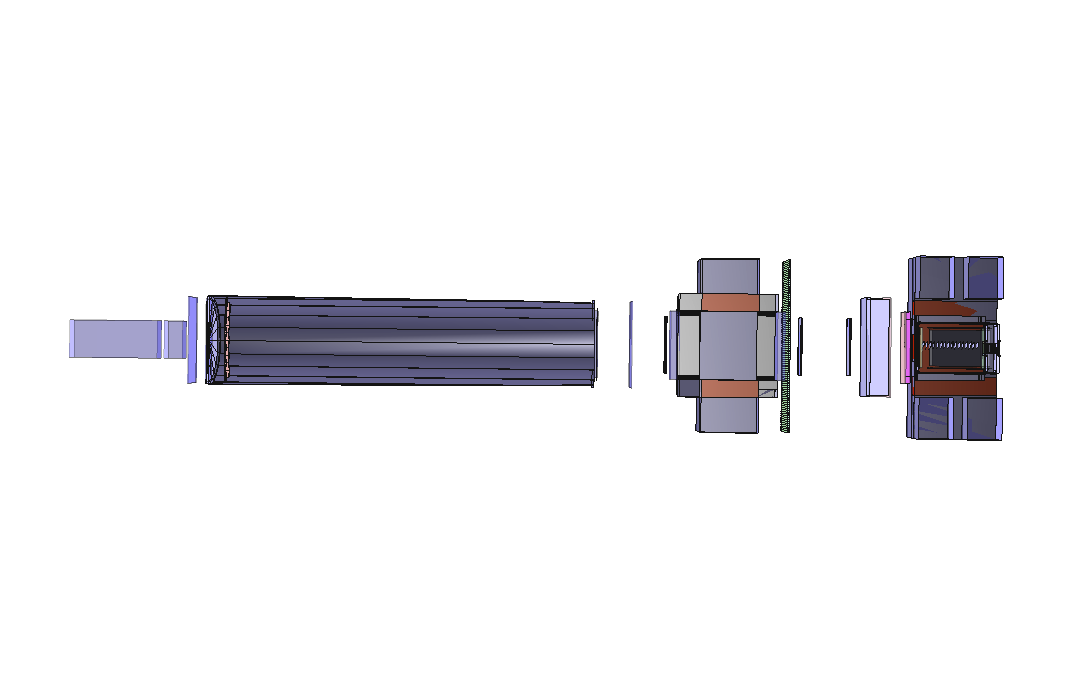 E907 detector E907 detector |
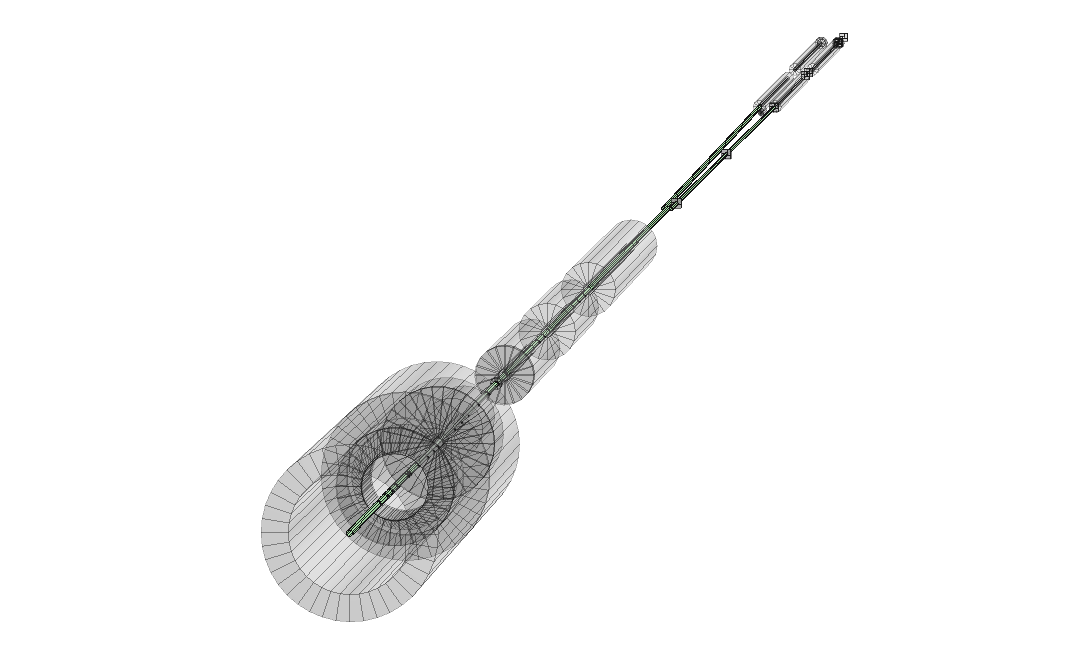 Felix detector Felix detector |
 GANIL detector GANIL detector |
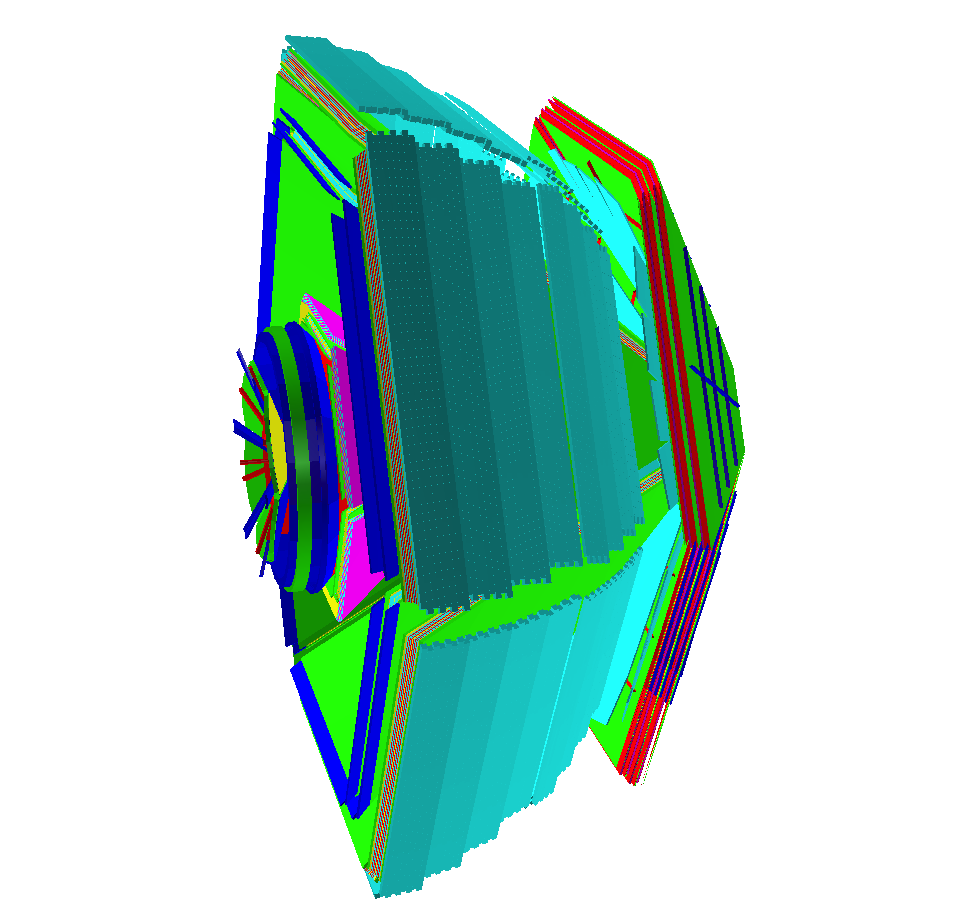 Hades detector Hades detector |
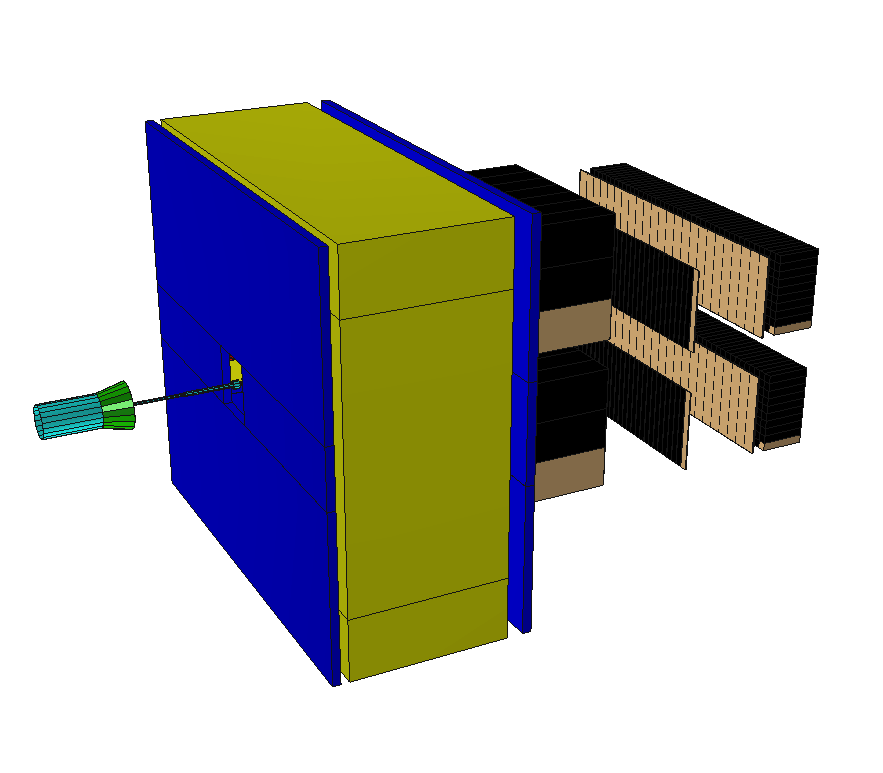 Hermes detector Hermes detector |
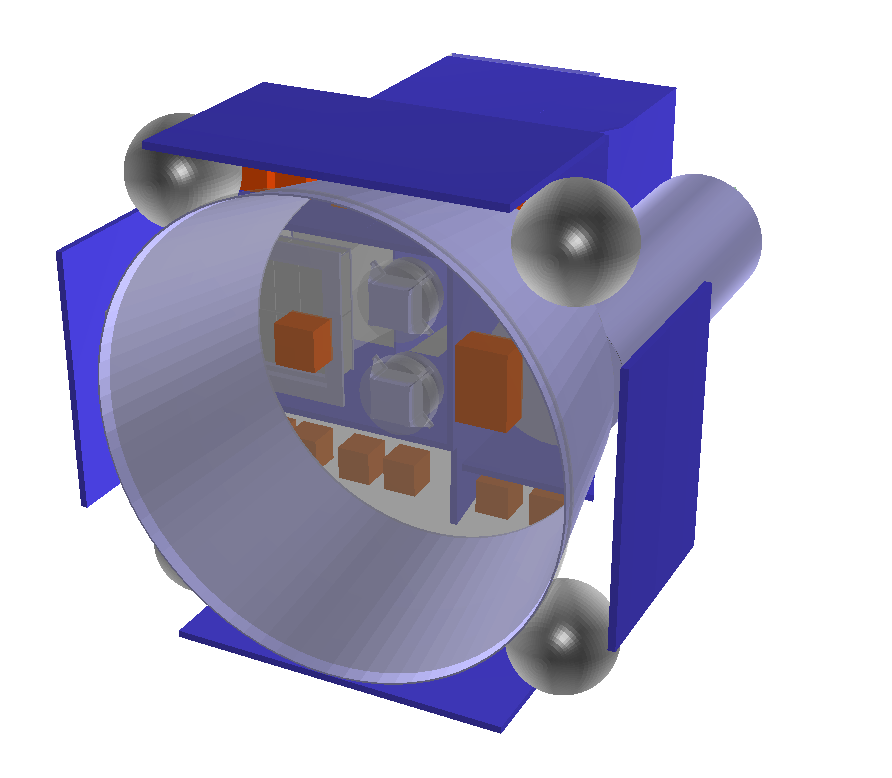 Integral detector Integral detector |
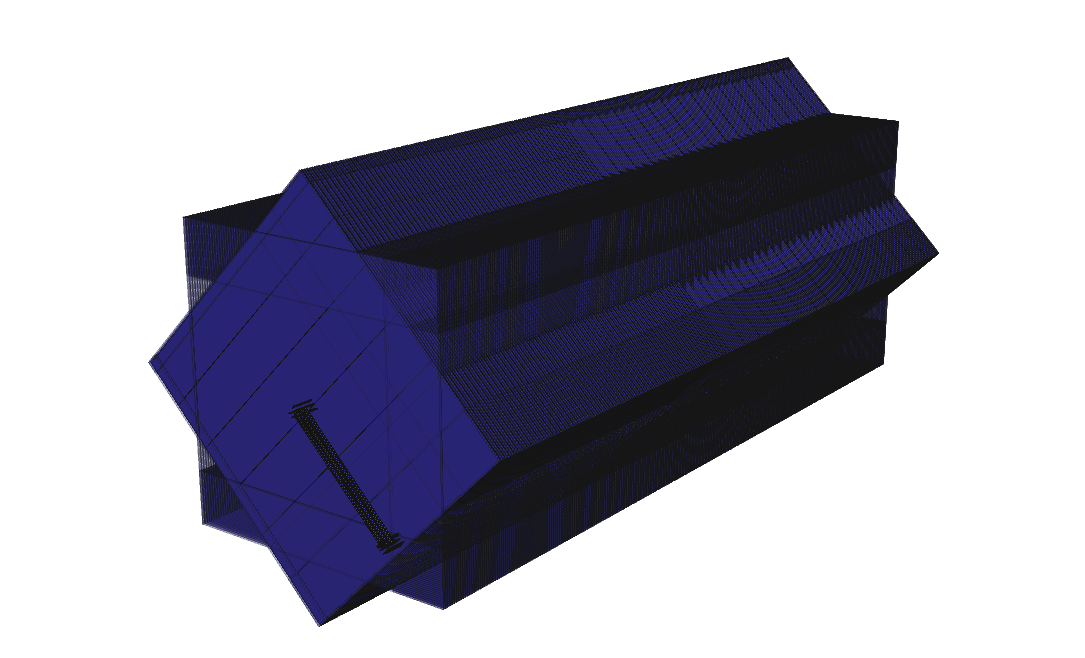 MINOS detector MINOS detector |
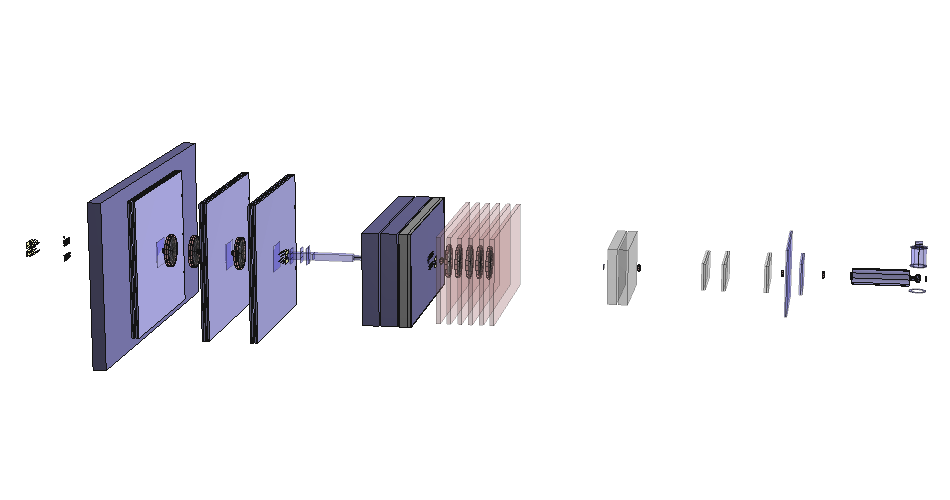 NA47 detector NA47 detector |
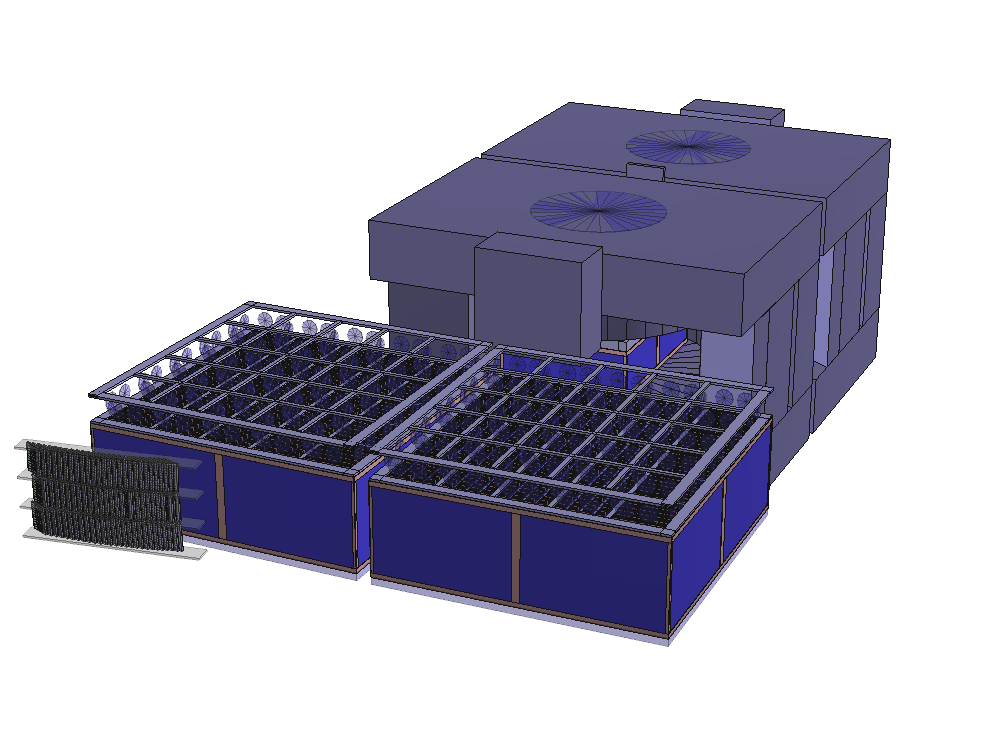 NA49 detector NA49 detector |
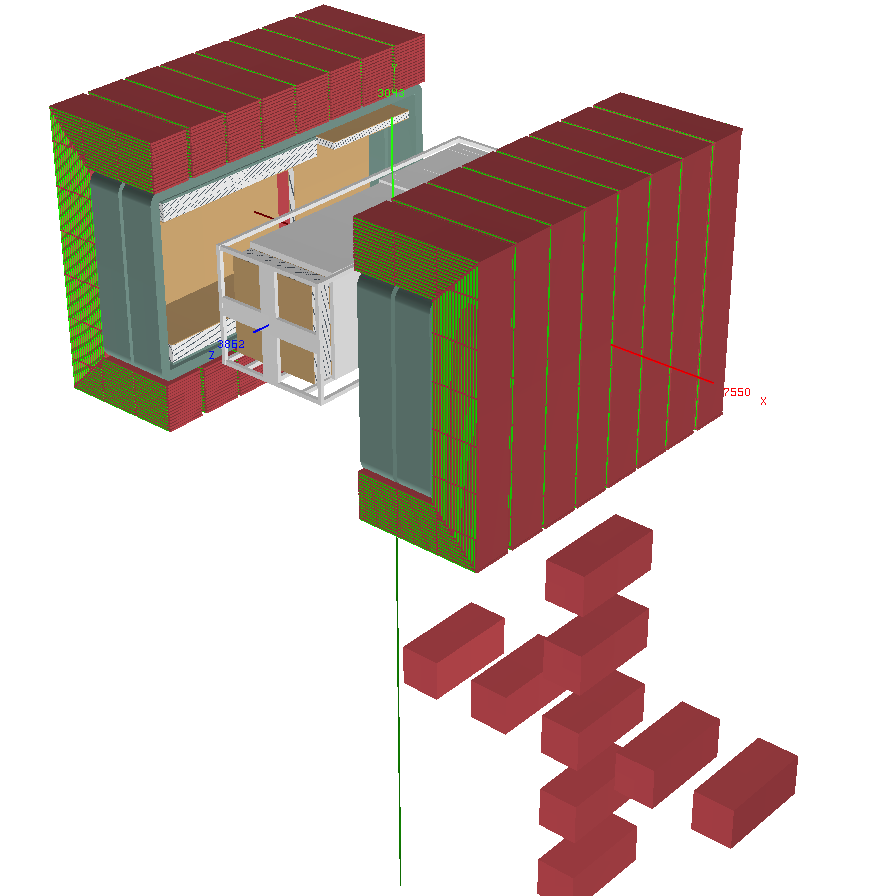 ND280 detector ND280 detector |
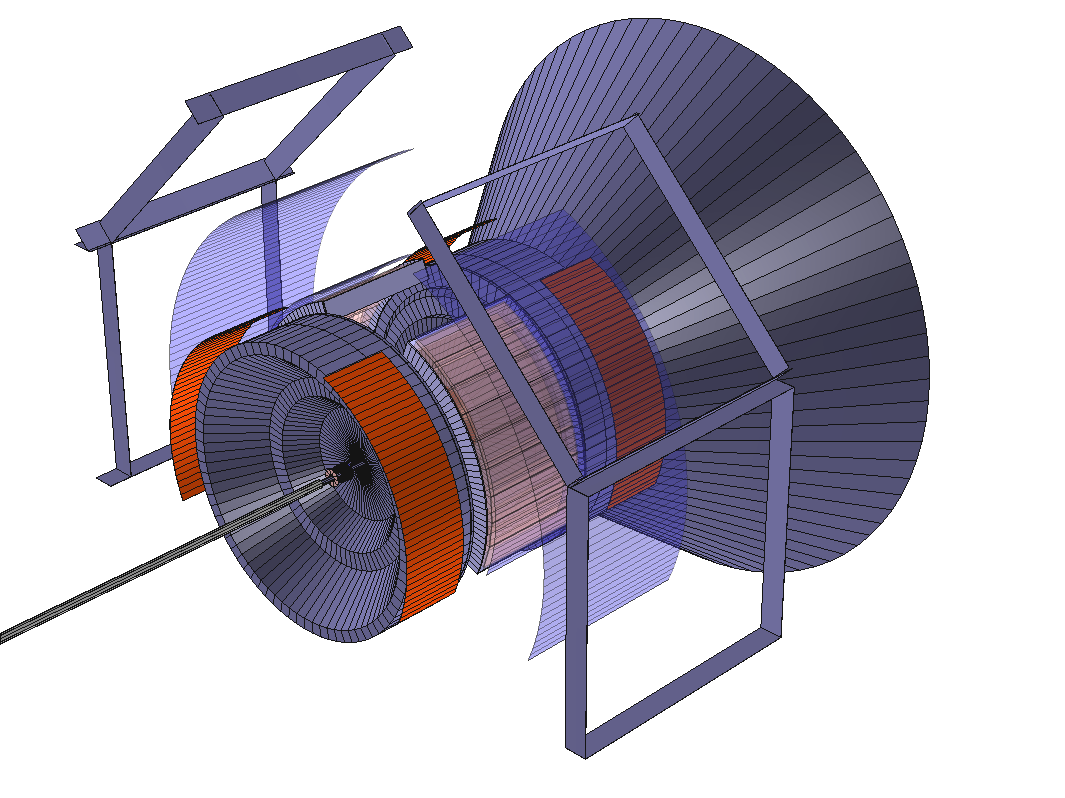 Phenix detector Phenix detector |
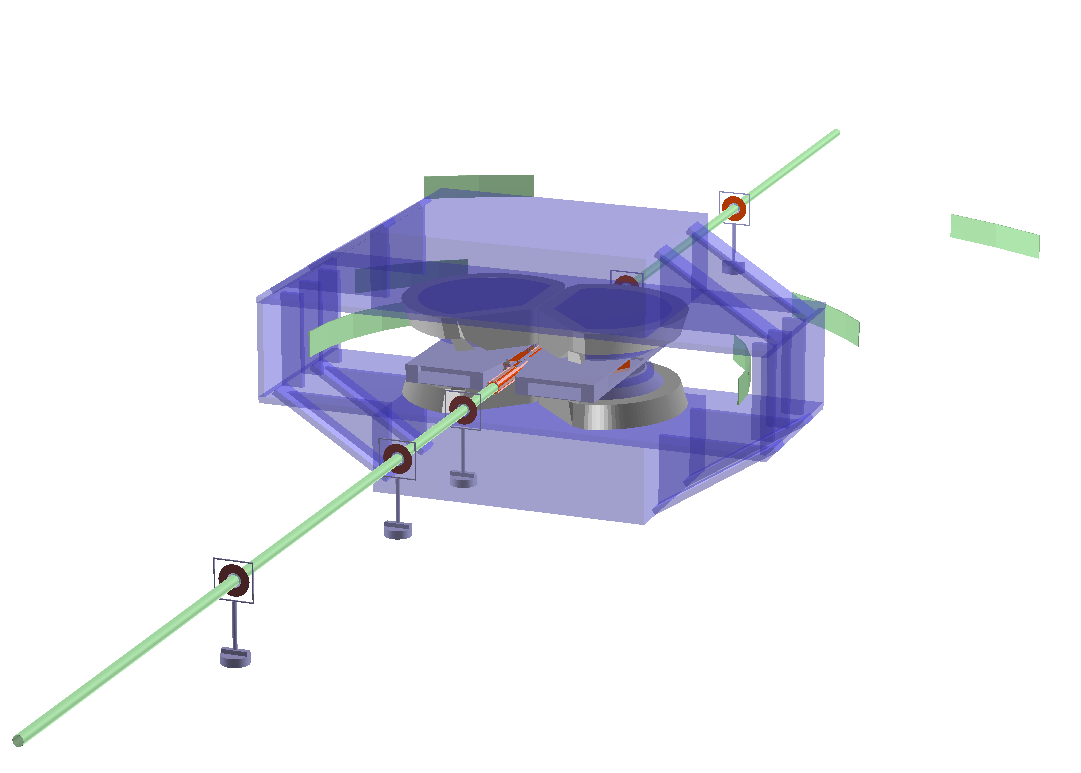 Phobos detector Phobos detector |
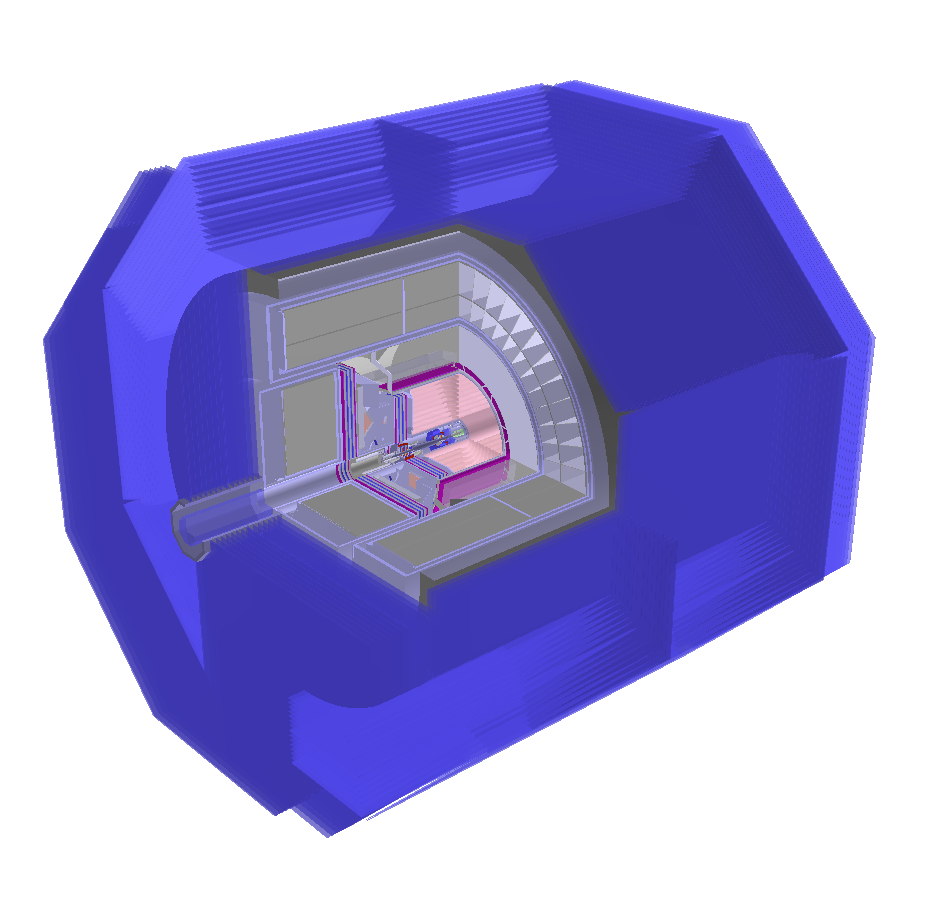 SLD detector SLD detector |
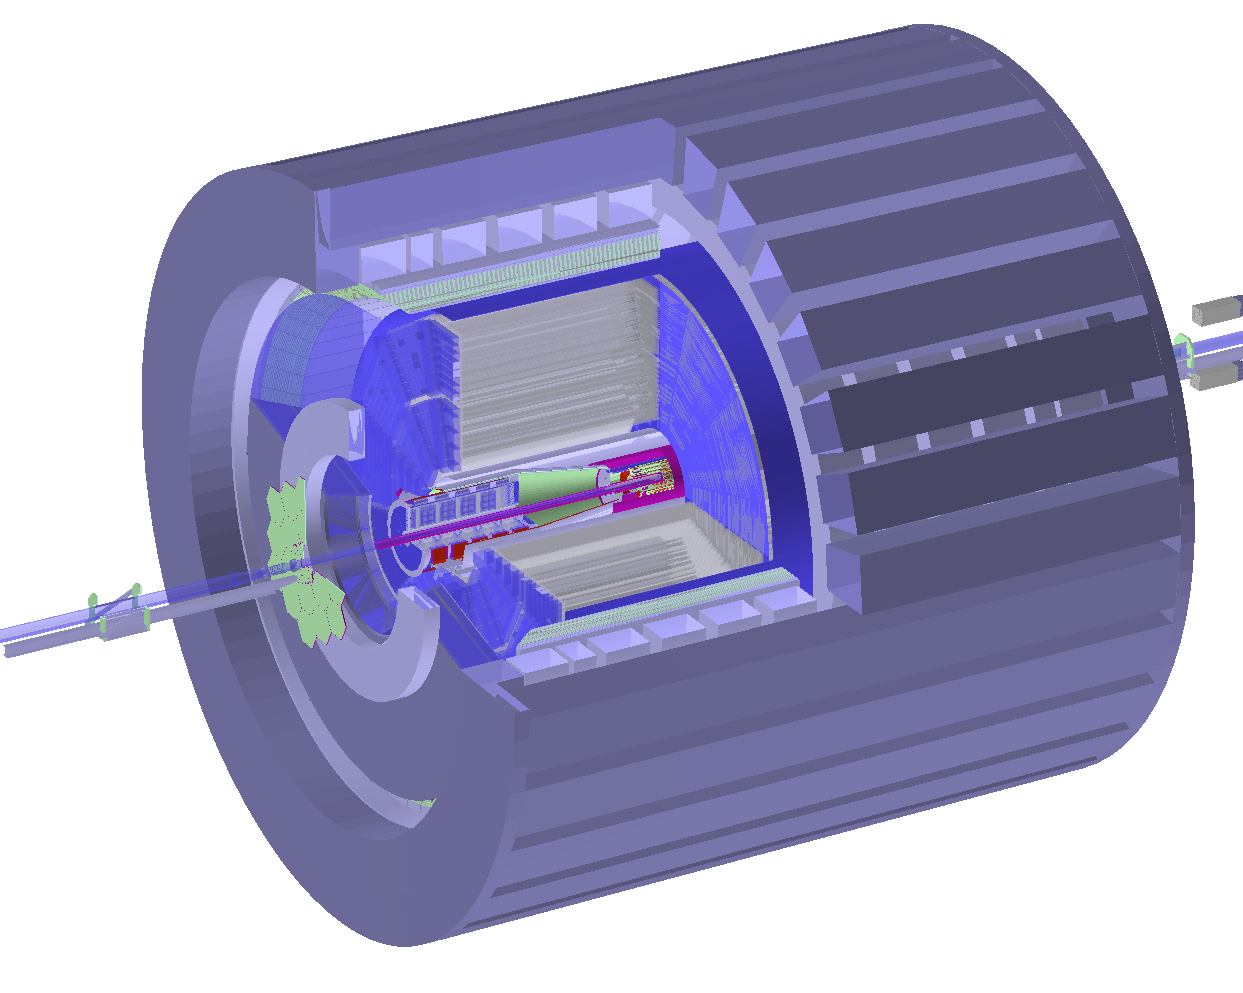 STAR detector STAR detector |
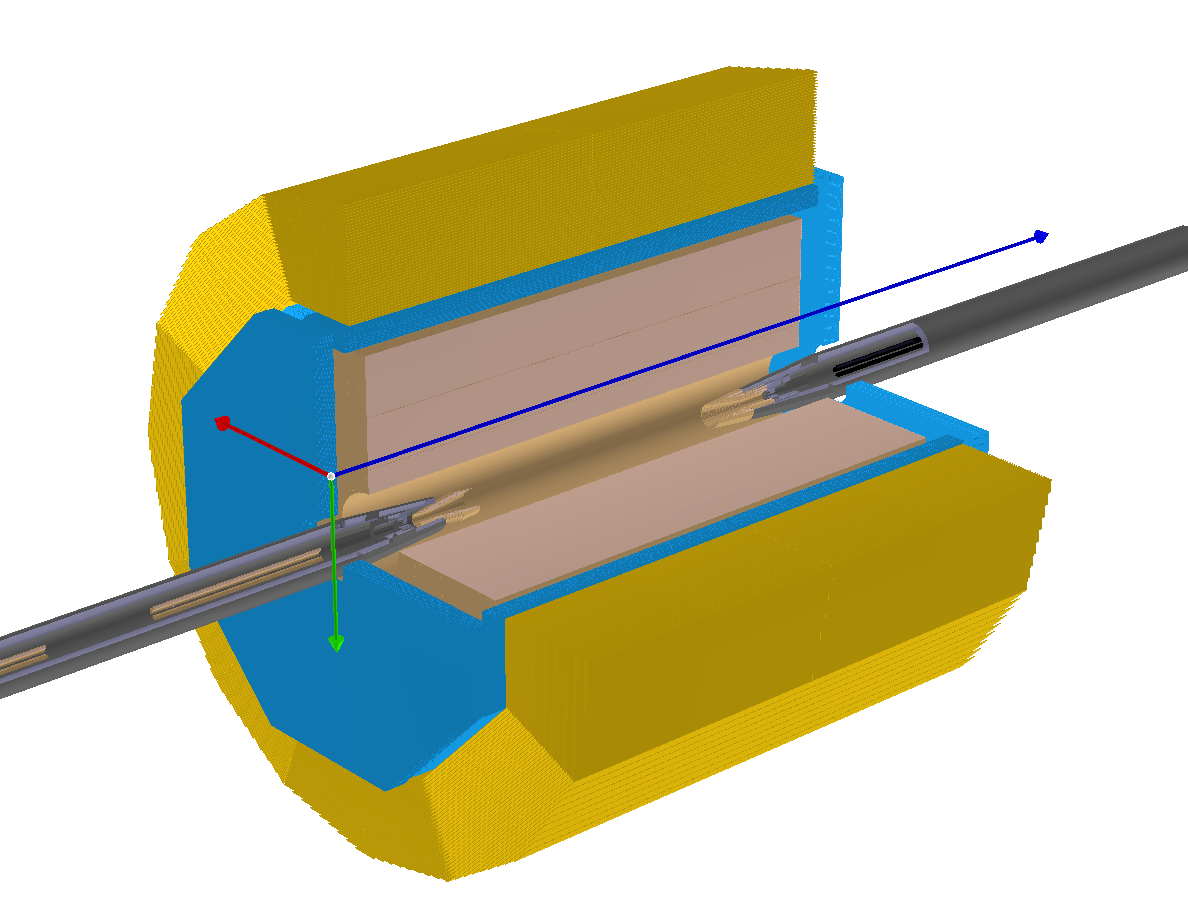 Tesla detector Tesla detector |
 WA91 detector WA91 detector |
|
|
Data Analysis and Visualization
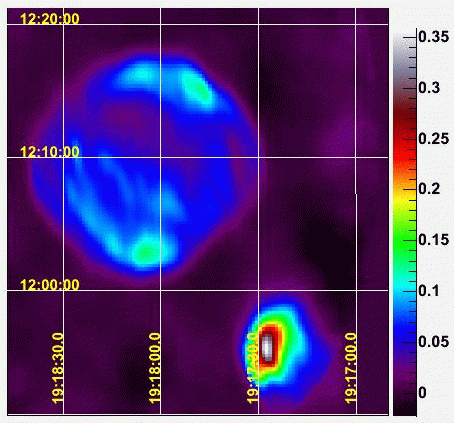 Astro Physics example 1 Astro Physics example 1 |
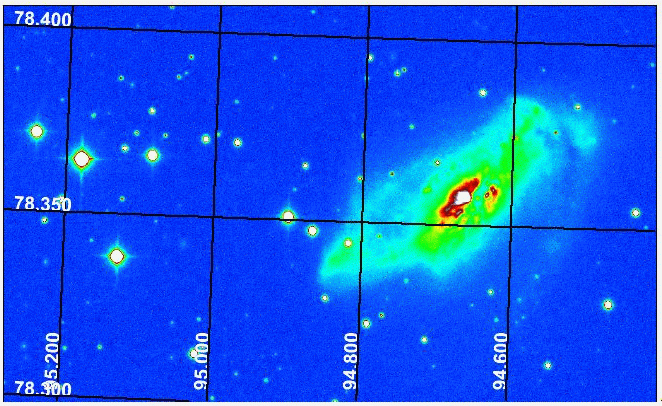 Astro Physics example 2 Astro Physics example 2 |
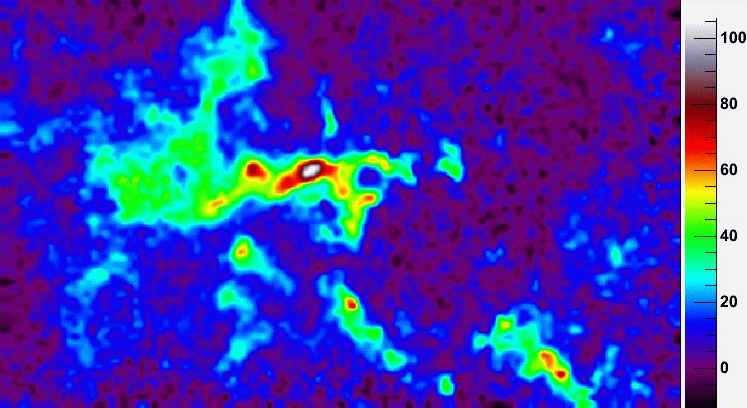 Astro Physics example 3 Astro Physics example 3 |
 Astro Physics example 4 Astro Physics example 4 |
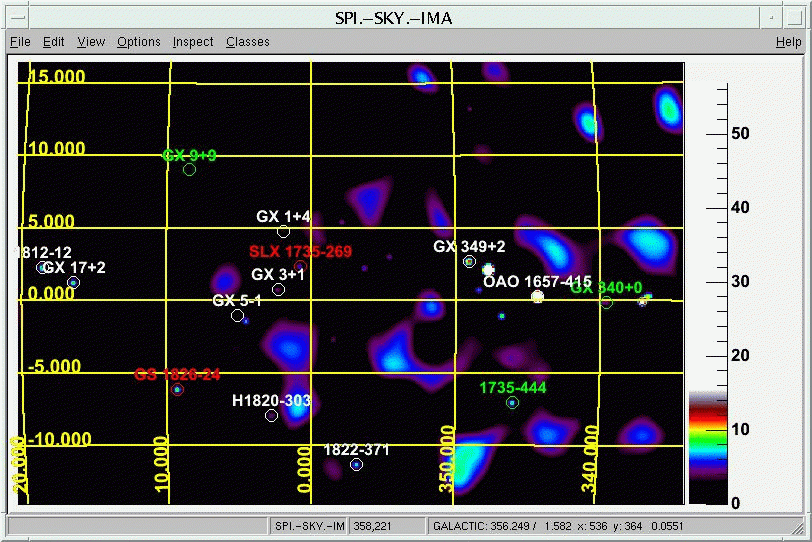 Astro Physics example 5 Astro Physics example 5 |
 CMS physics simulation at HIP18 Discovery reach CMS physics simulation at HIP18 Discovery reach |
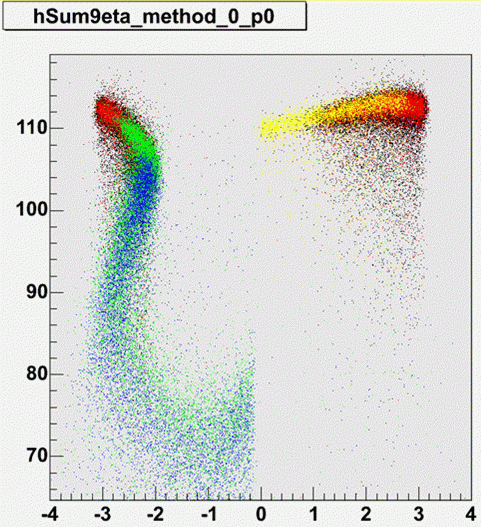 Coloured scatter plot Coloured scatter plot |
 Cross-sections vs. centre-of-mass energy for proton-proton interactions Cross-sections vs. centre-of-mass energy for proton-proton interactions |
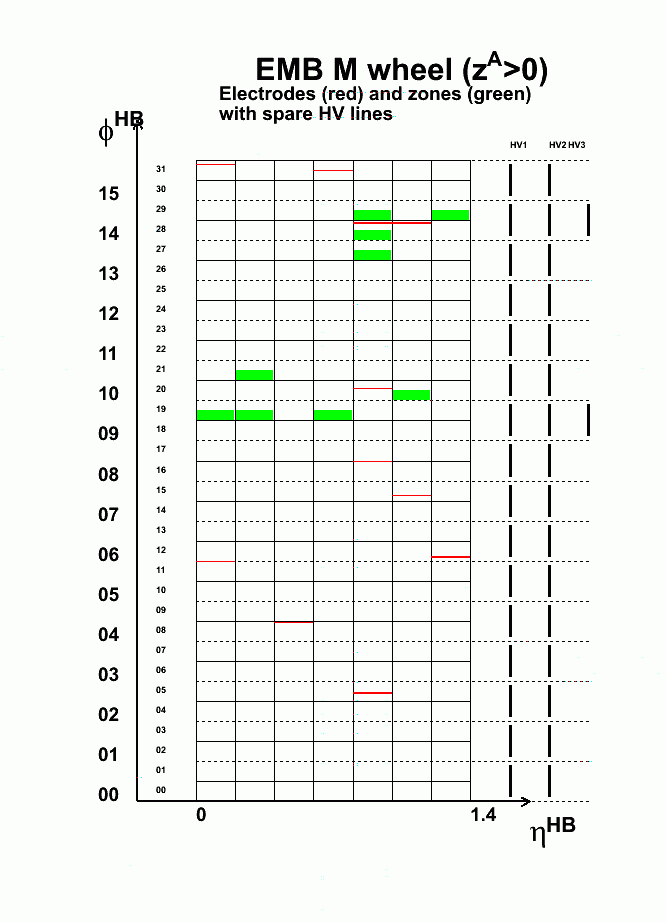 EMB M Wheel EMB M Wheel |
 EM response profile EM response profile |
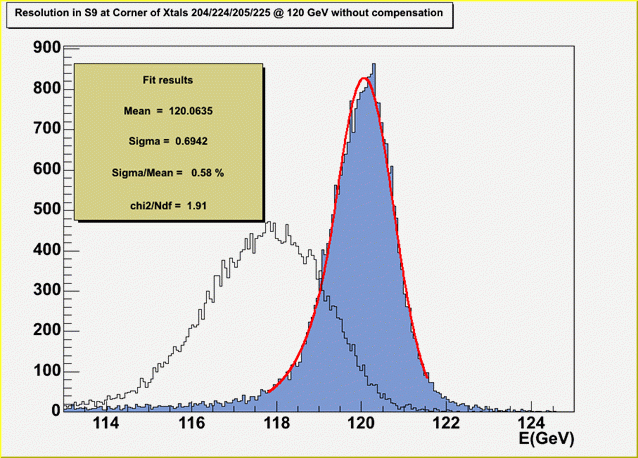 Example of fit Example of fit |
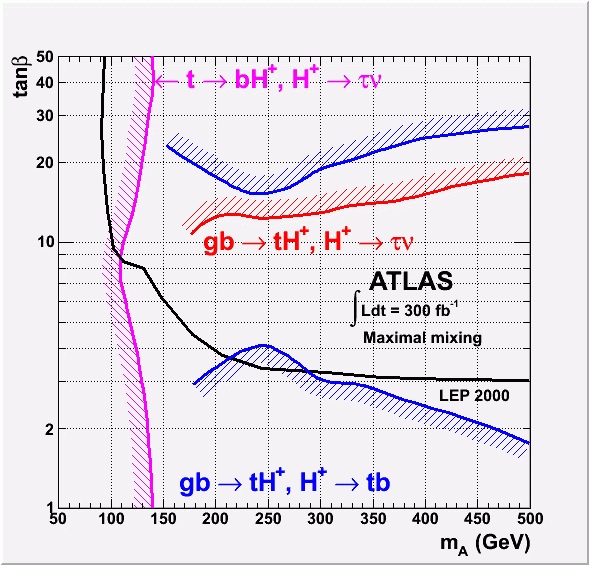 Exclusion graphs Exclusion graphs |
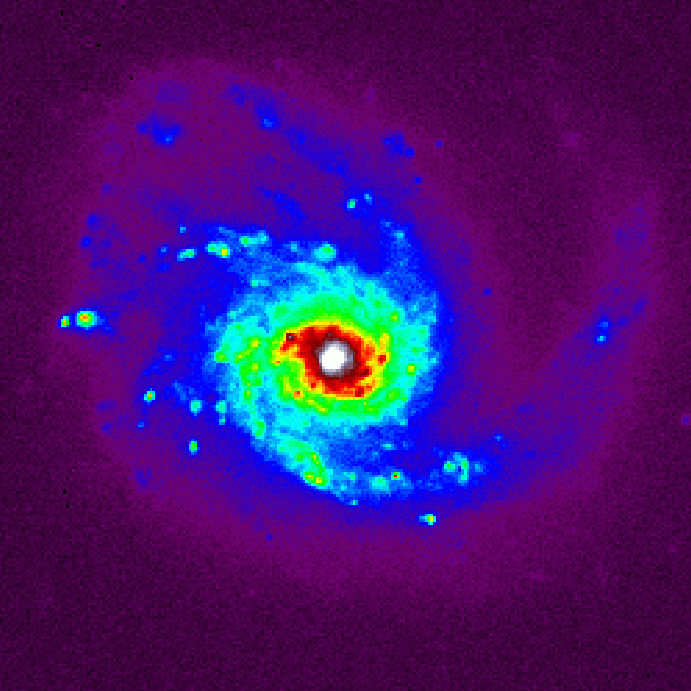 Galaxy view 1 Galaxy view 1 |
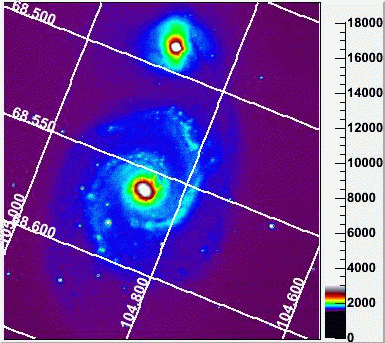 Galaxy view 2 Galaxy view 2 |
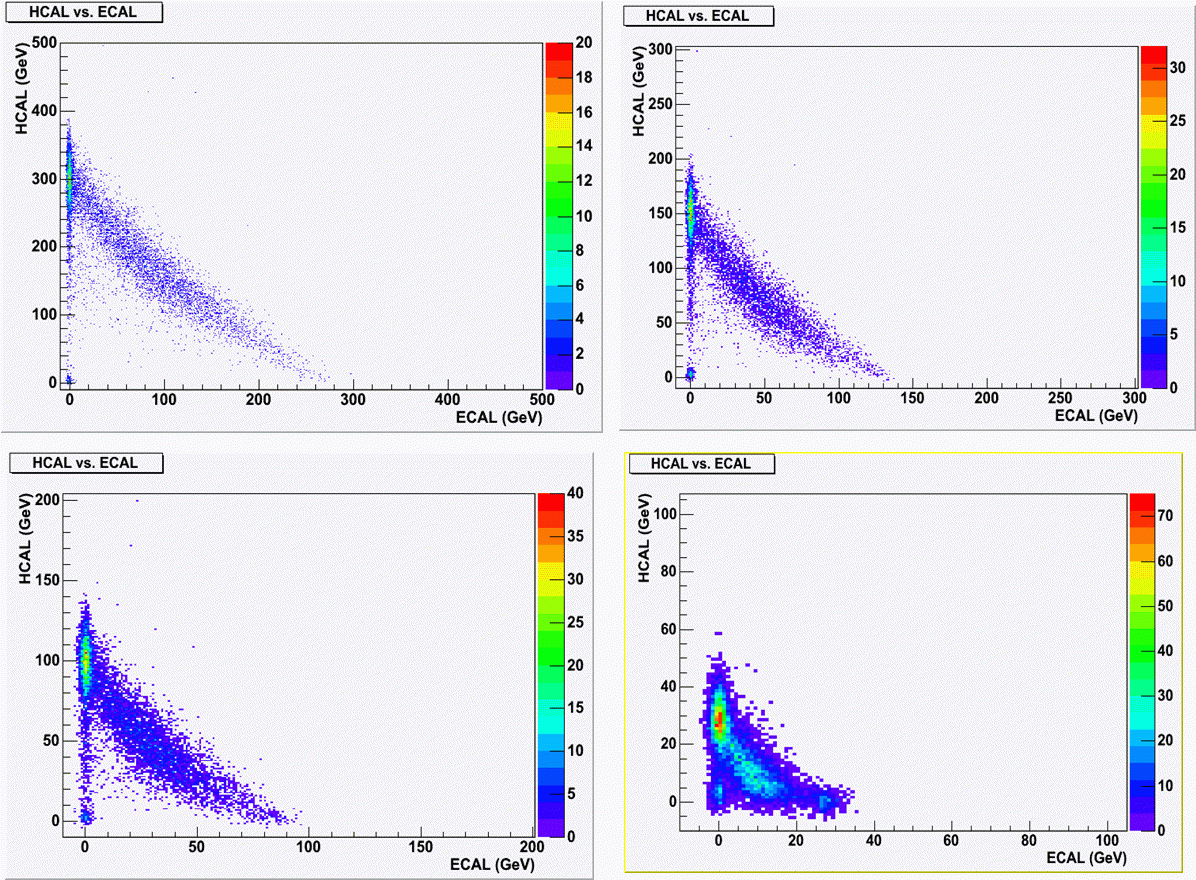 HCAL vs ECAL HCAL vs ECAL |
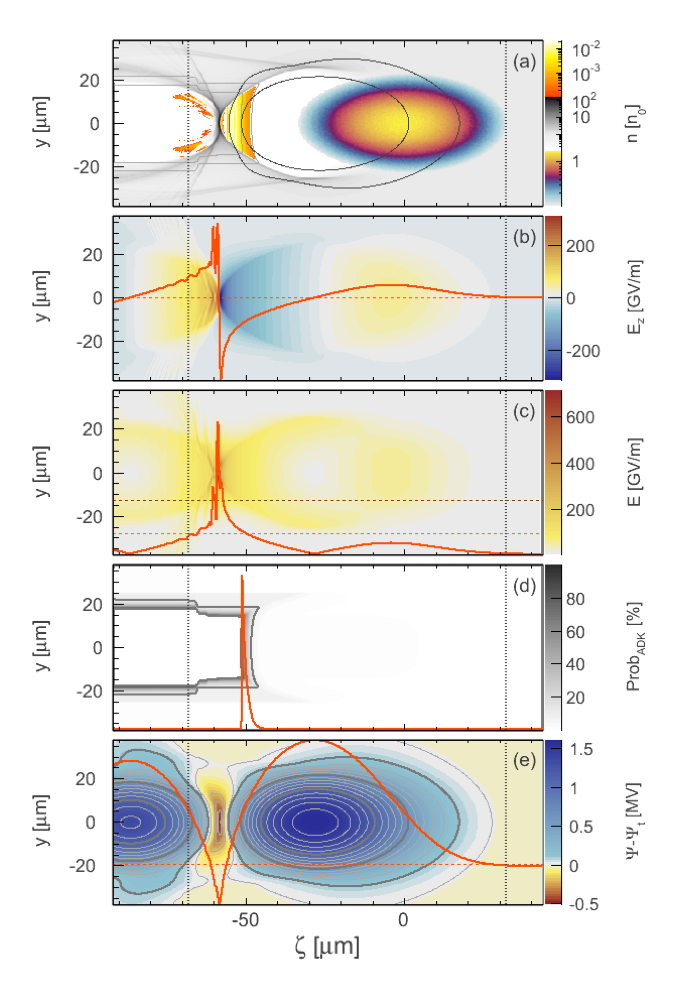 High quality plot High quality plot |
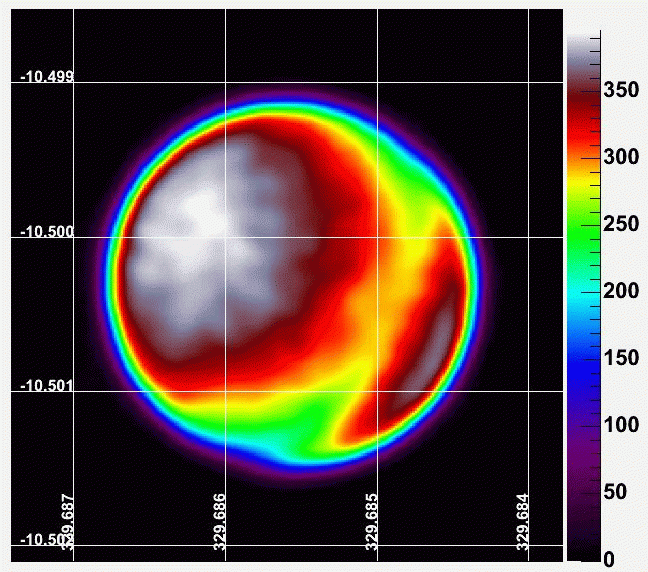 Mercury at 14.149 MHz Mercury at 14.149 MHz |
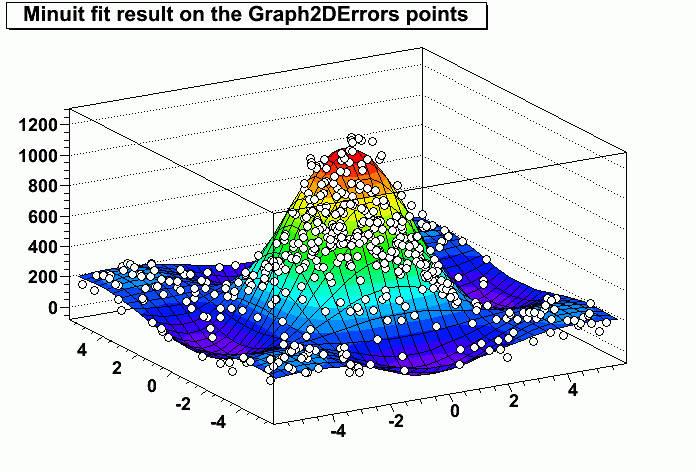 Minuit fit result on the Graph2DErrors points Minuit fit result on the Graph2DErrors points |
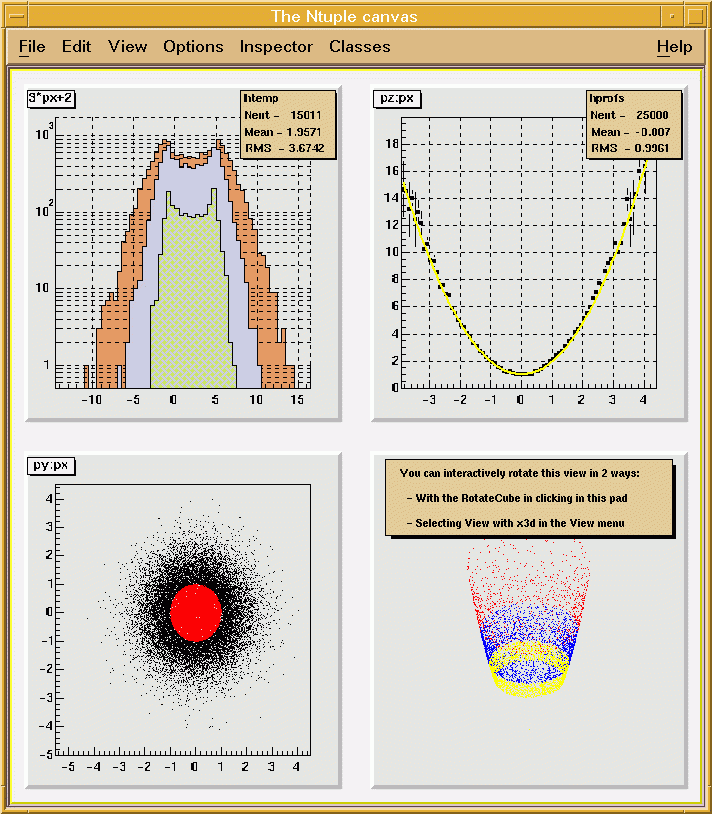 Simple tree analysis Simple tree analysis |
 Sun view Sun view |
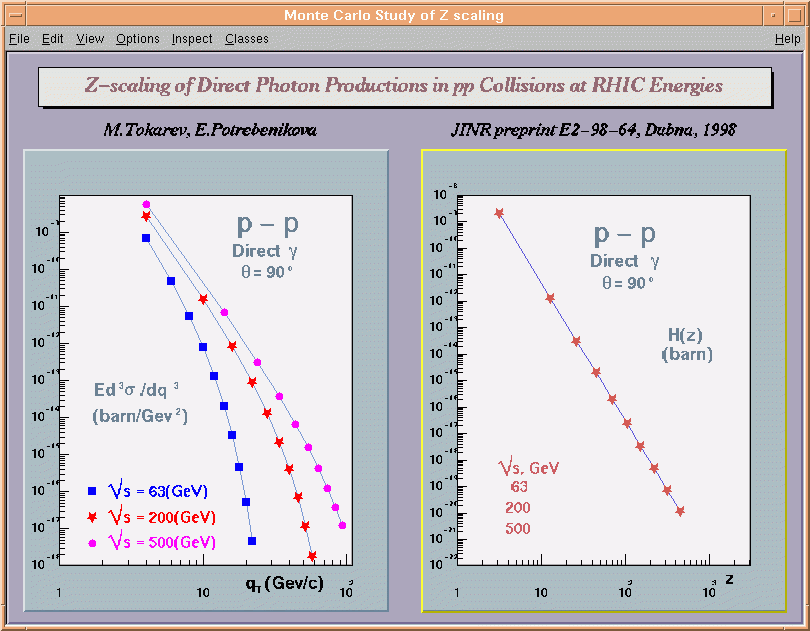 Z-scaling of Direct Photon Productions in pp Collisions at RHIC Energies Z-scaling of Direct Photon Productions in pp Collisions at RHIC Energies |
Advanced GUI
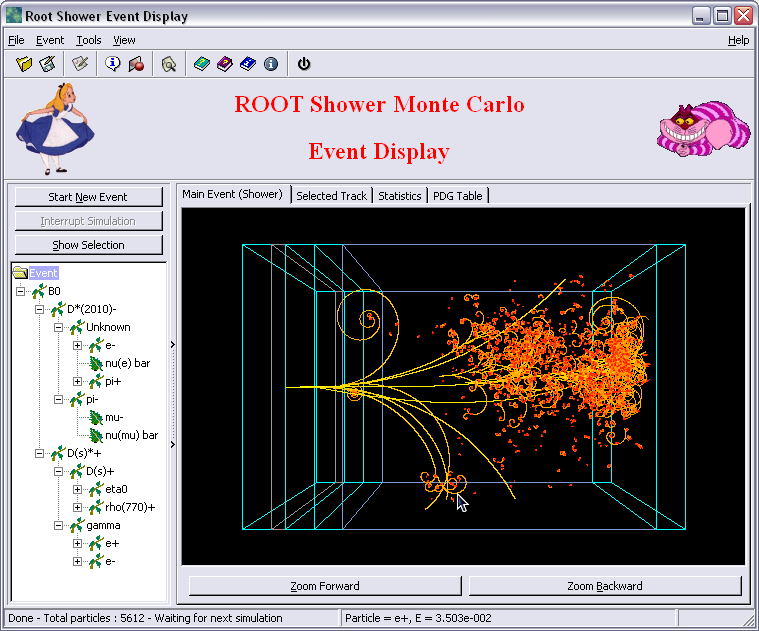 An event display based on ROOT GUI An event display based on ROOT GUI |
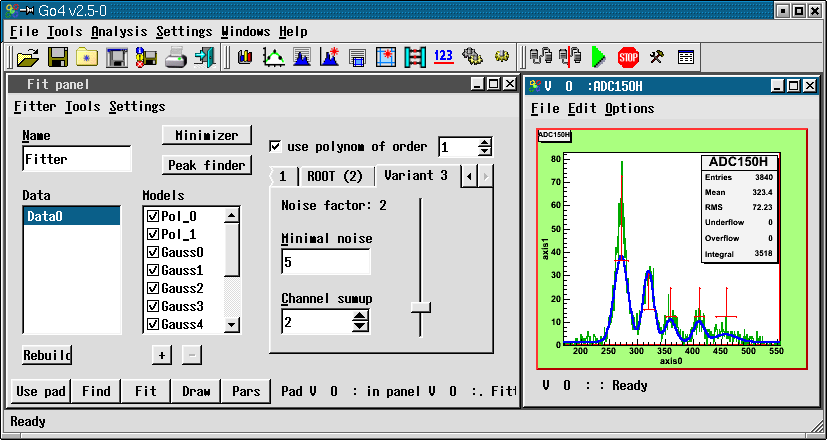 GUI tools to build applications GUI tools to build applications |
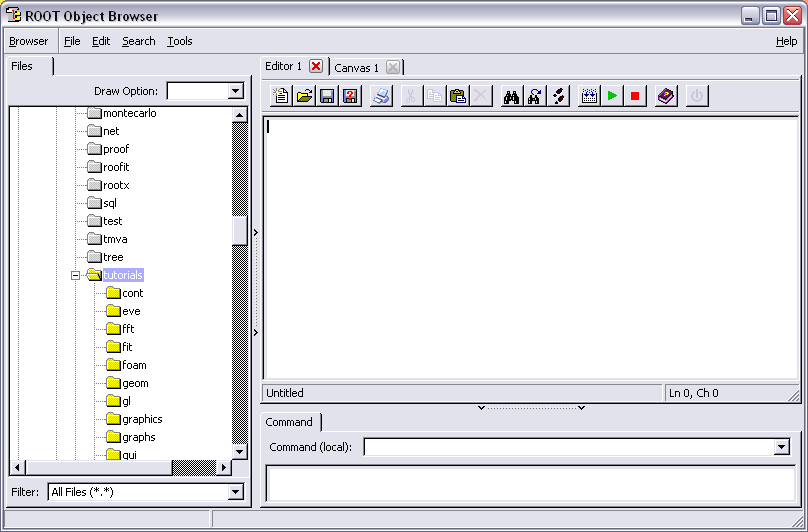 ROOT object browser ROOT object browser |
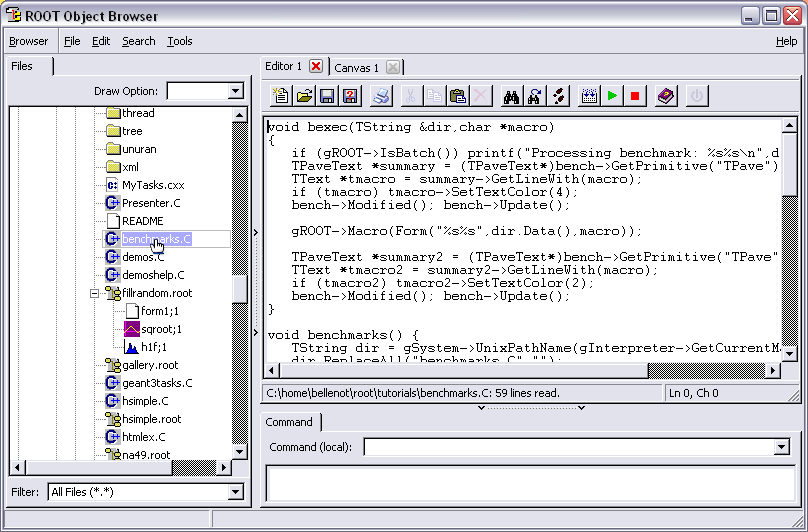 TBrowser as a code editor TBrowser as a code editor |
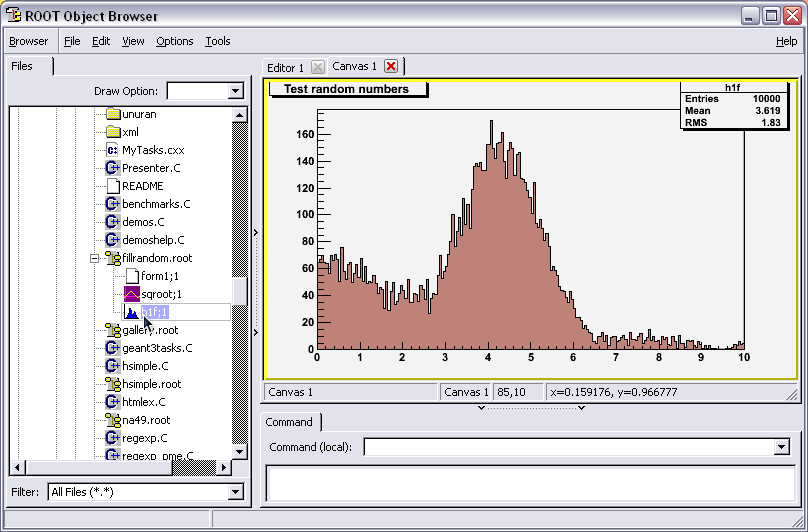 TBrowser to draw histograms TBrowser to draw histograms |
|
Visualisation techniques and basic graphics
This gallery shows the basic graphics tools and some of the visualisation techniques ROOT provides.
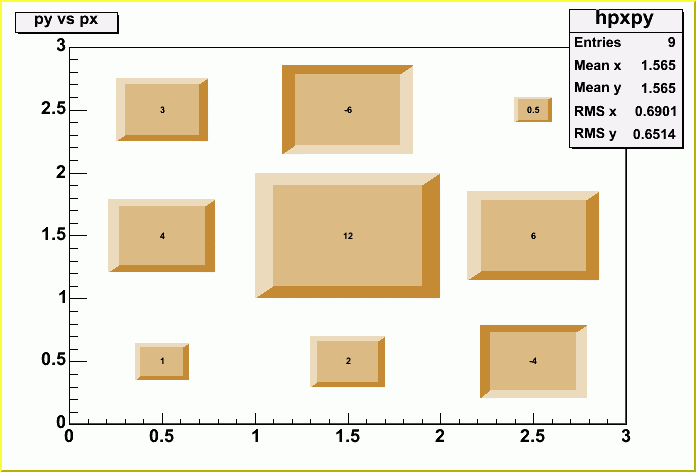 2D histogram rendered with boxes 2D histogram rendered with boxes |
 3D histogram drawn with option BOX 3D histogram drawn with option BOX |
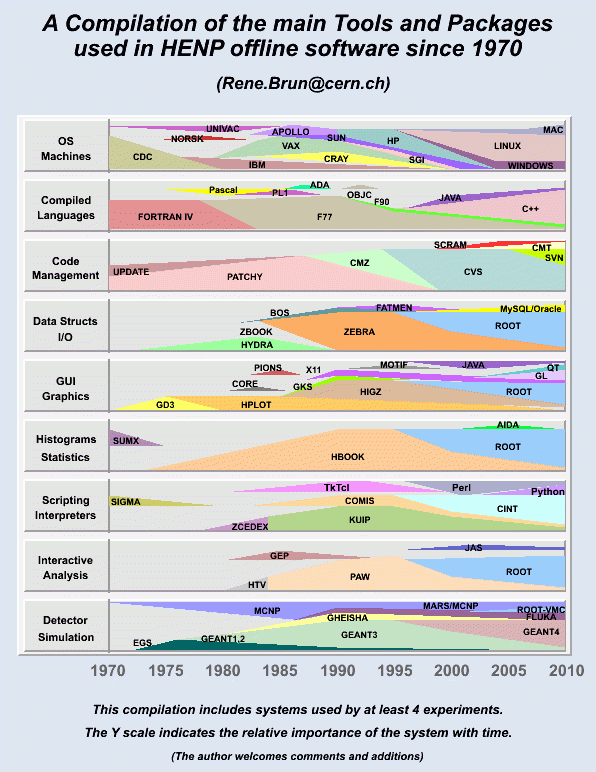 A Compilation of the main Tools and Packages used in HENP offline software between 1970 and 2010 A Compilation of the main Tools and Packages used in HENP offline software between 1970 and 2010 |
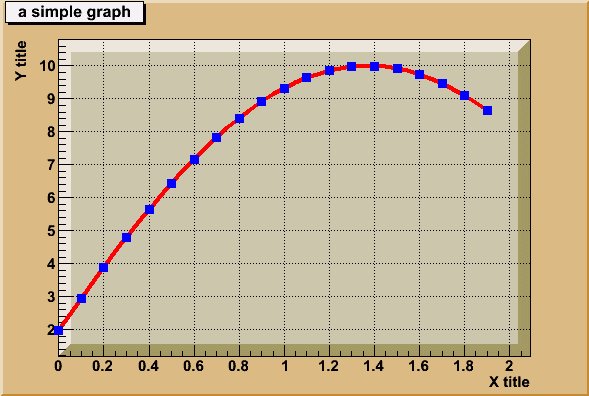 A simple graph A simple graph |
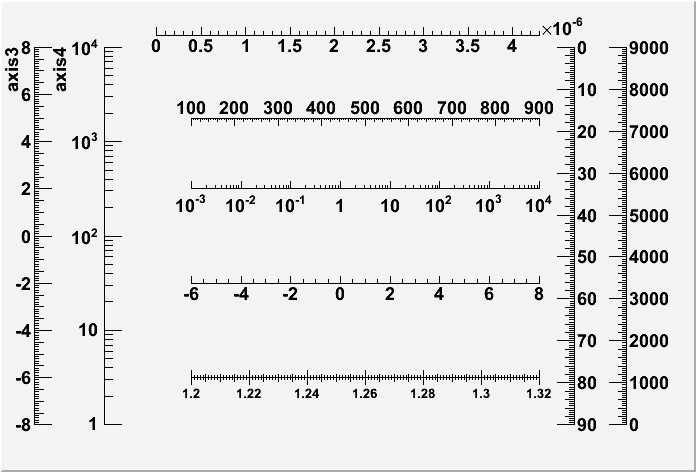 All kind of axis All kind of axis |
 All kind of boxes All kind of boxes |
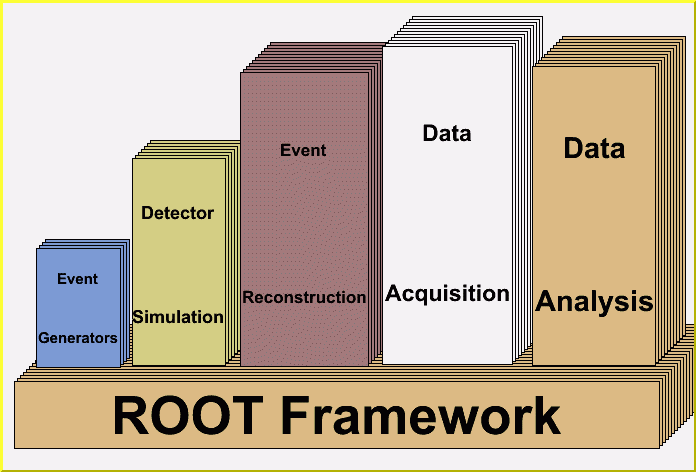 Application Domains Application Domains |
 Arrows drawing Arrows drawing |
 Basic 3D shapes Basic 3D shapes |
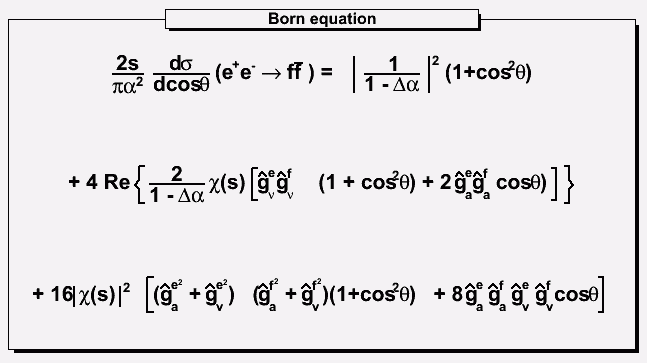 Born equation produced with TLatex Born equation produced with TLatex |
 Candle plots Candle plots |
 Coloured scatter plot Coloured scatter plot |
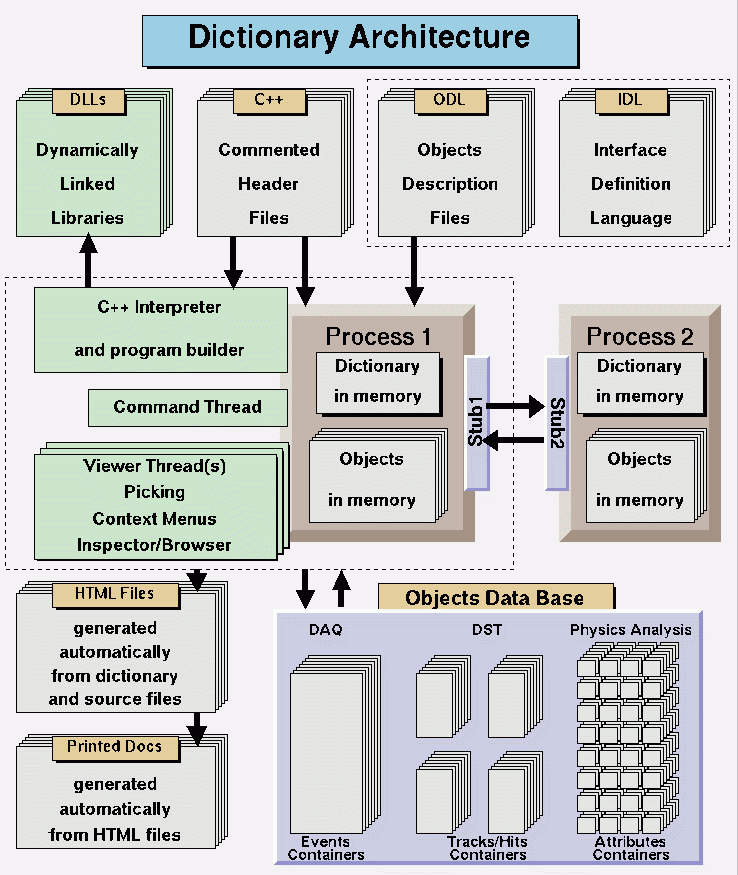 Directory architecture Directory architecture |
 Drawing option- TEXT Drawing option- TEXT |
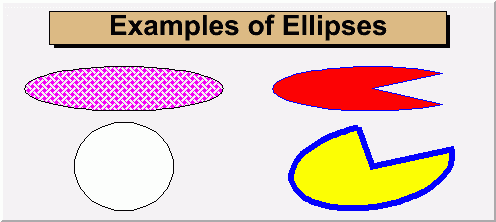 Ellipse drawing Ellipse drawing |
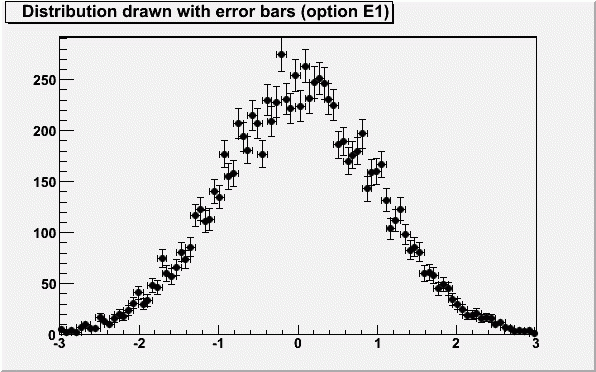 Error bars plot Error bars plot |
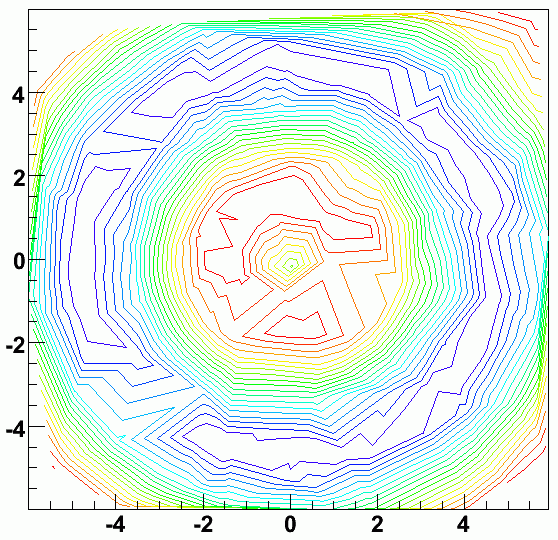 Example of contours plot Example of contours plot |
 Example of formulae produced with TLatex Example of formulae produced with TLatex |
 Example of pie chart drawing Example of pie chart drawing |
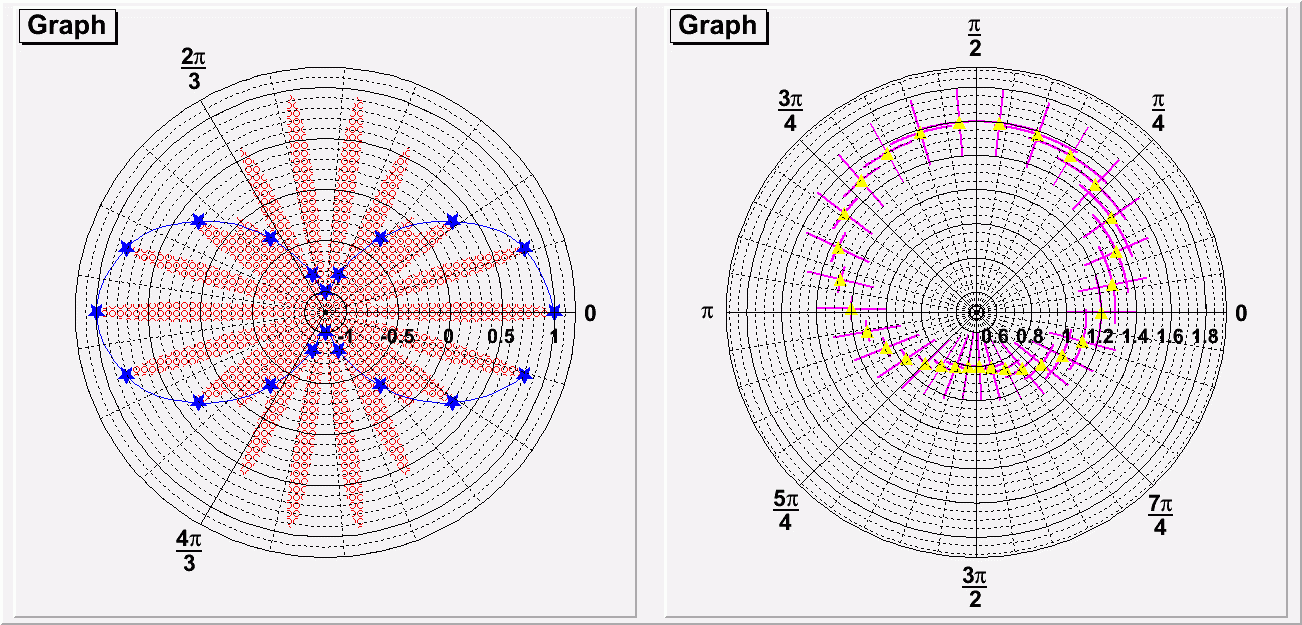 Examples of polar graphs Examples of polar graphs |
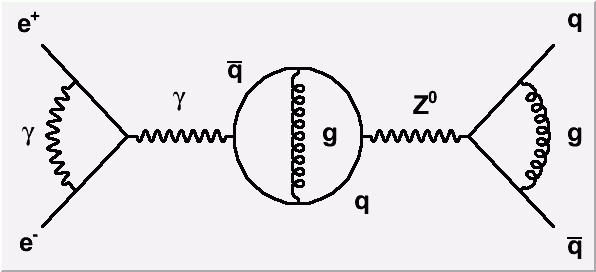 Feynman diagrams Feynman diagrams |
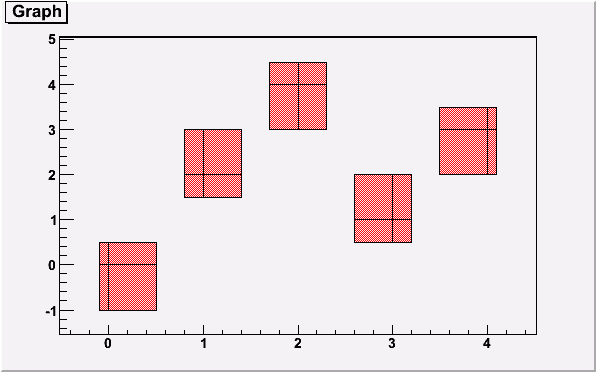 Graph with asymmetric errors Graph with asymmetric errors |
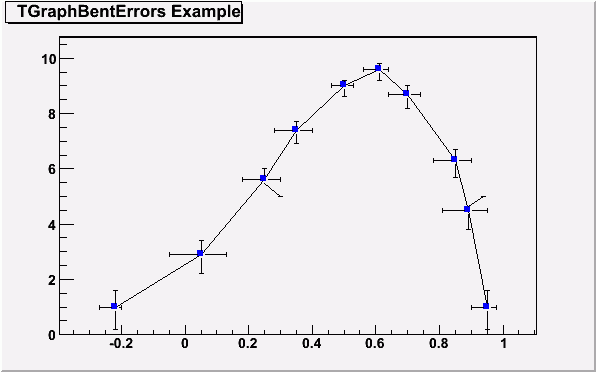 Graph with bent error bars Graph with bent error bars |
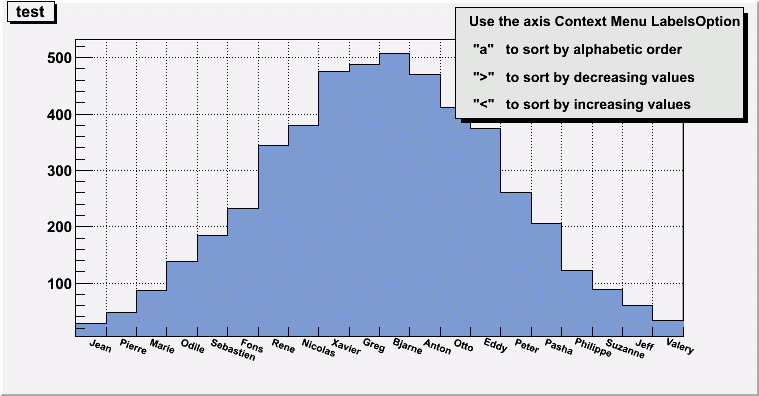 Histograms with alphanumeric labels Histograms with alphanumeric labels |
 Implicit functions Implicit functions |
 Iso surface to drawn 3D histogram Iso surface to drawn 3D histogram |
 List of greek symbols List of greek symbols |
 Markers' styles Markers' styles |
 Multi-Graph drawing Multi-Graph drawing |
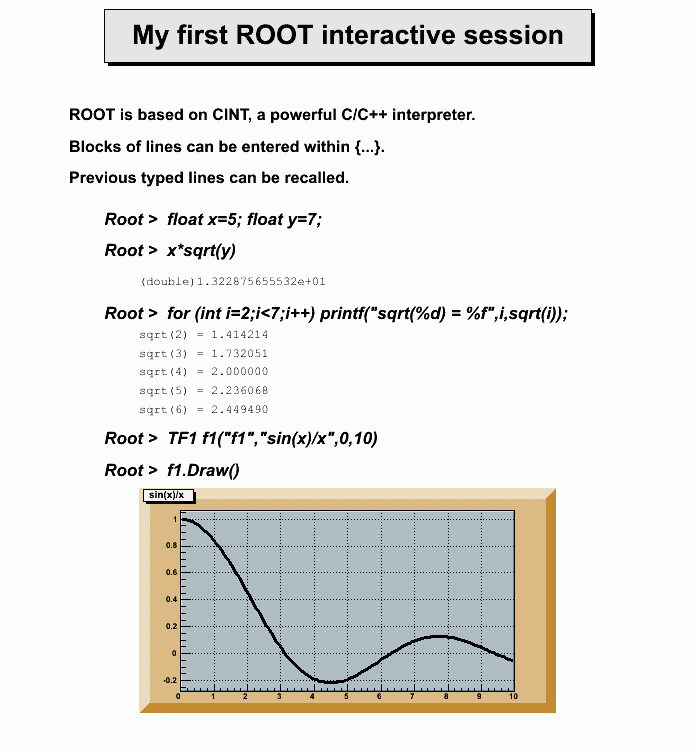 My first ROOT interactive session My first ROOT interactive session |
 Parallel coordinates Parallel coordinates |
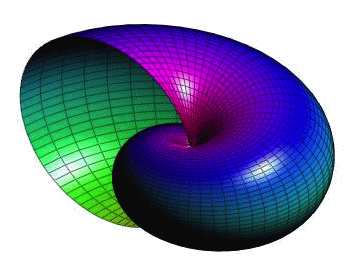 Parametric surfaces 1 Parametric surfaces 1 |
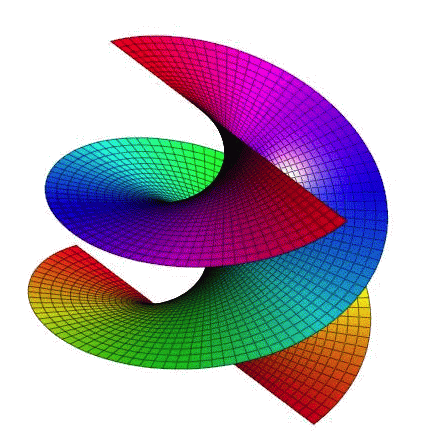 Parametric surfaces 2 Parametric surfaces 2 |
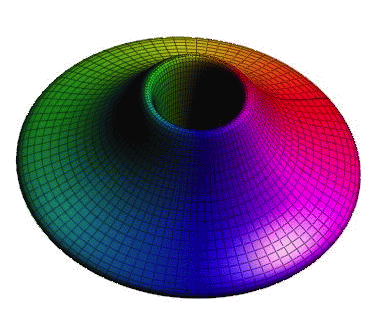 Parametric surfaces 3 Parametric surfaces 3 |
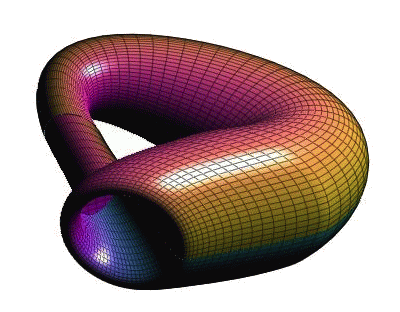 Parametric surfaces 4 Parametric surfaces 4 |
 Parametric surfaces 5 Parametric surfaces 5 |
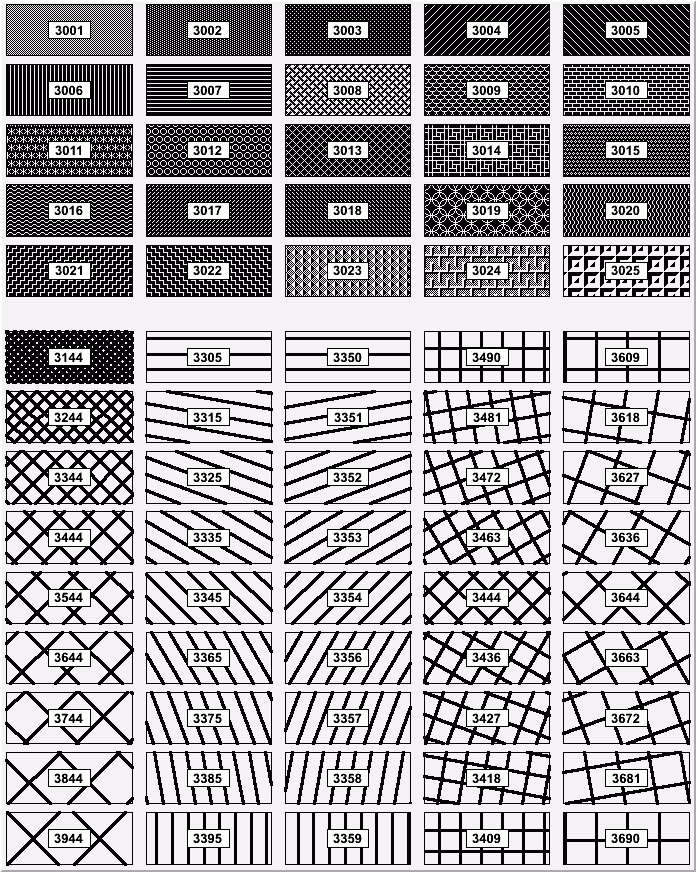 Polygons' fill styles Polygons' fill styles |
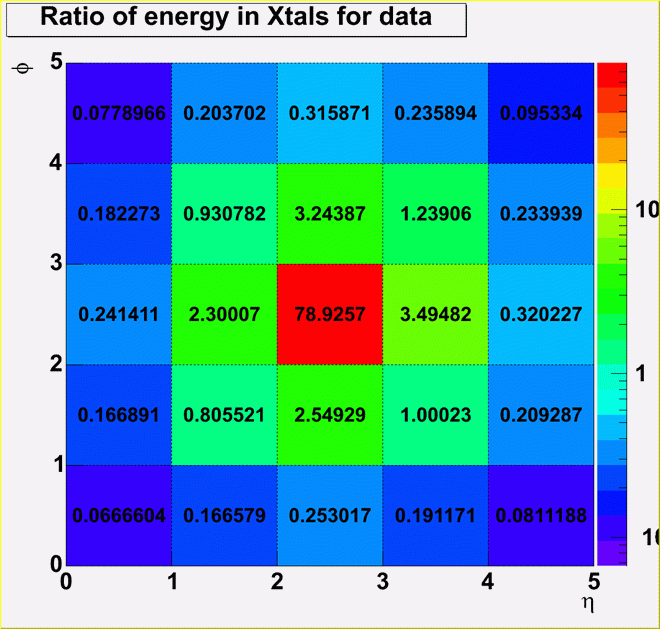 Ratio of energy in Xtals for data Ratio of energy in Xtals for data |
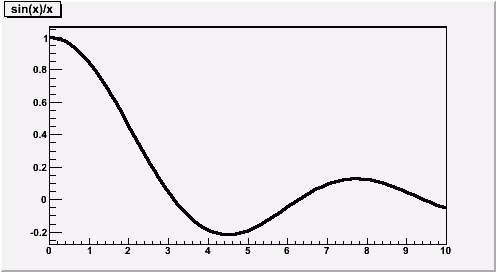 Simple graph Simple graph |
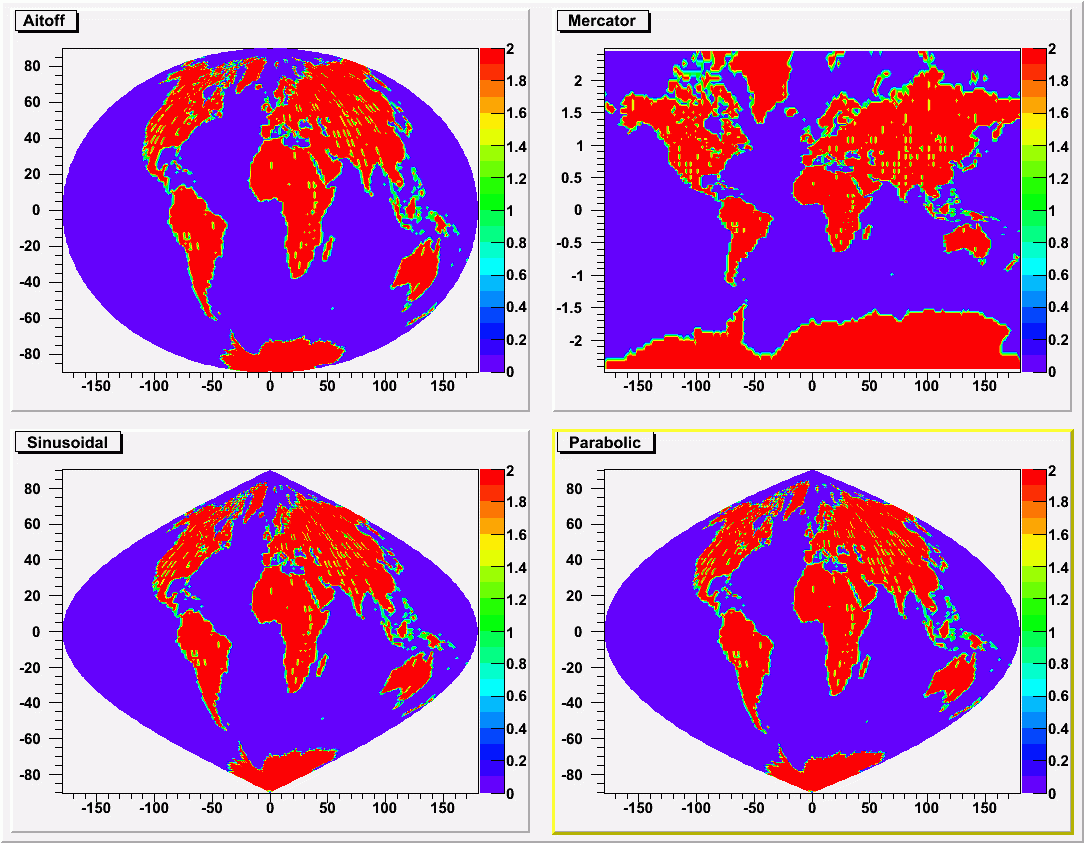 Sky maps or exposure maps Sky maps or exposure maps |
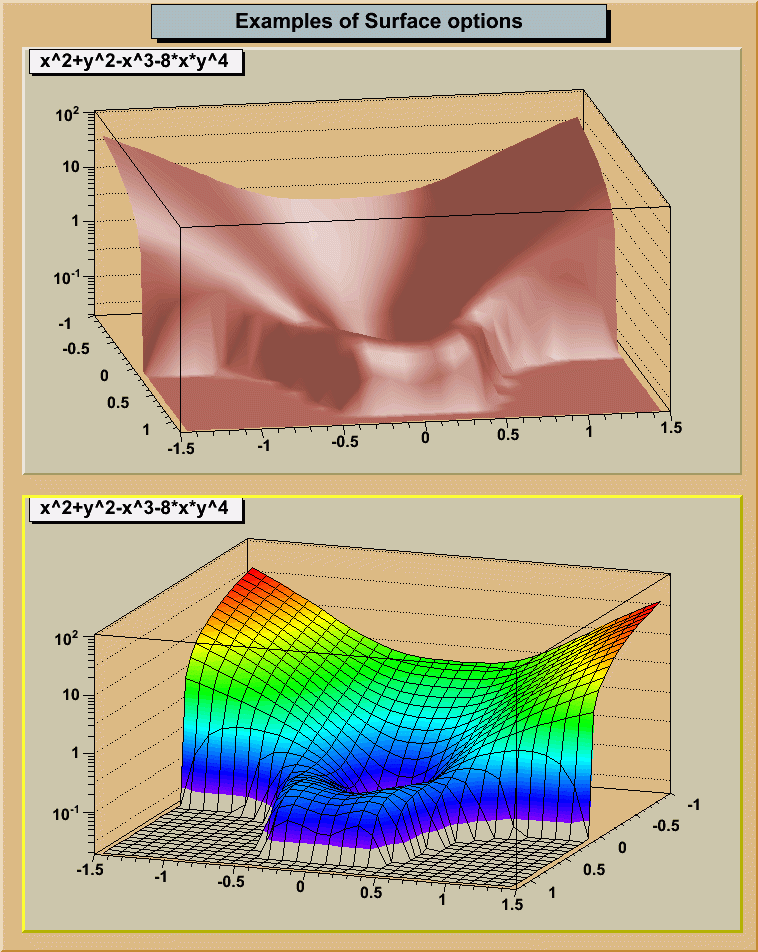 Surfaces plots Surfaces plots |
 TLatex Math symbols TLatex Math symbols |
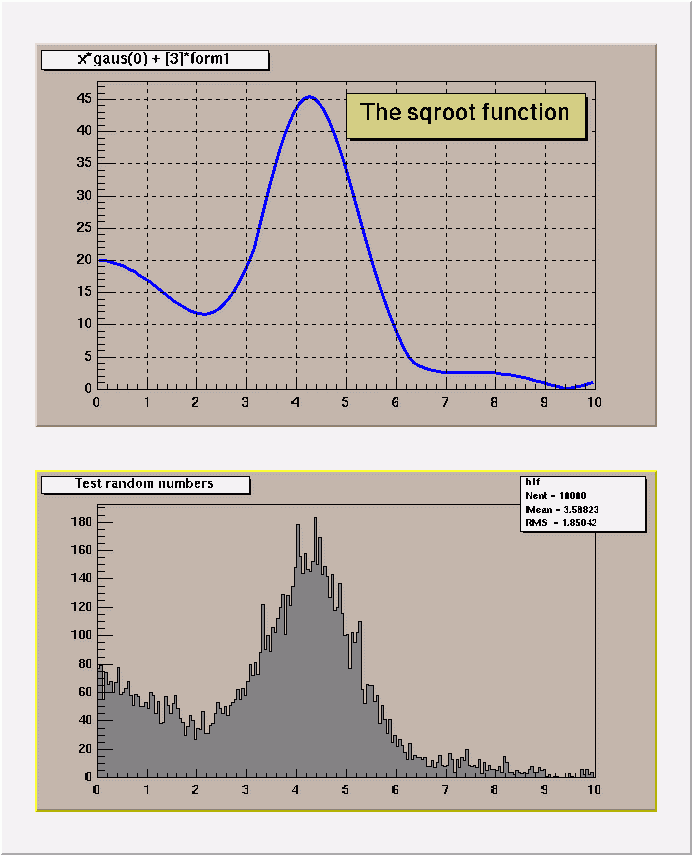 Test of random numbers Test of random numbers |
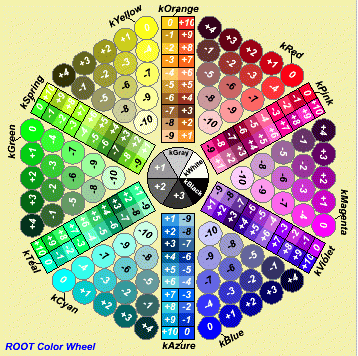 The color wheel The color wheel |
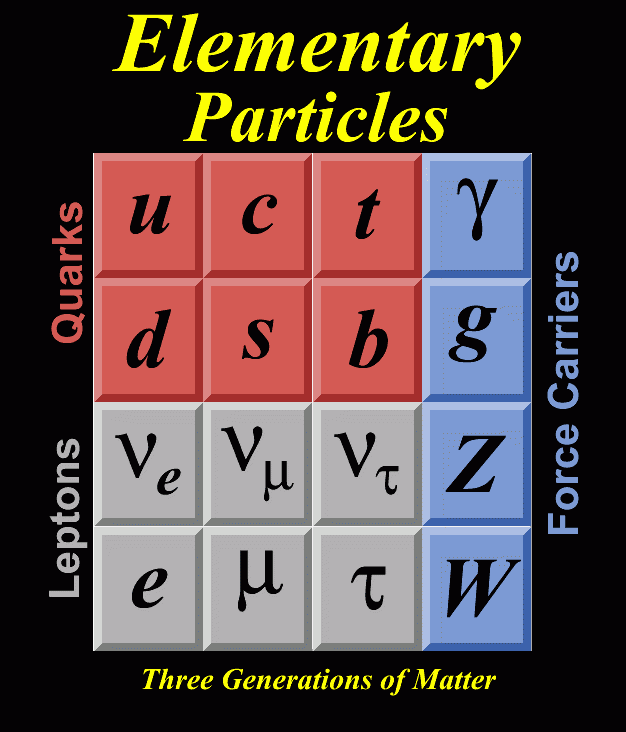 The elementary particles The elementary particles |
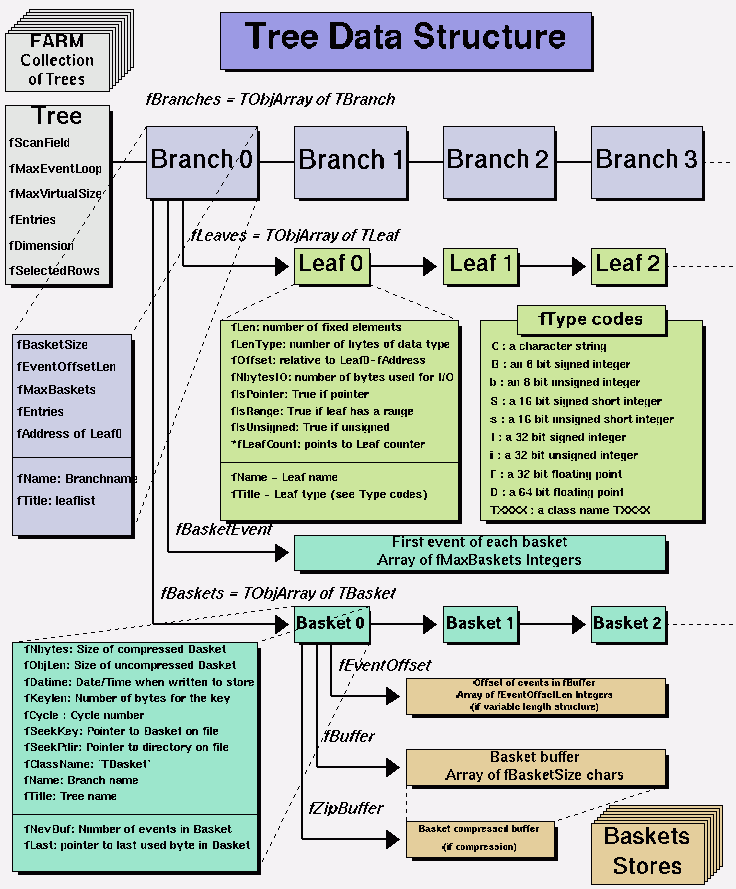 The tree data structure The tree data structure |
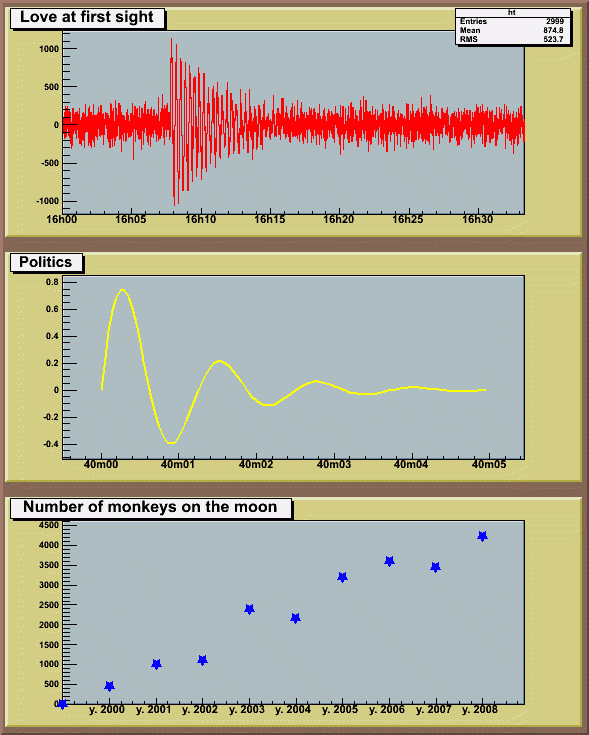 Time on axis Time on axis |
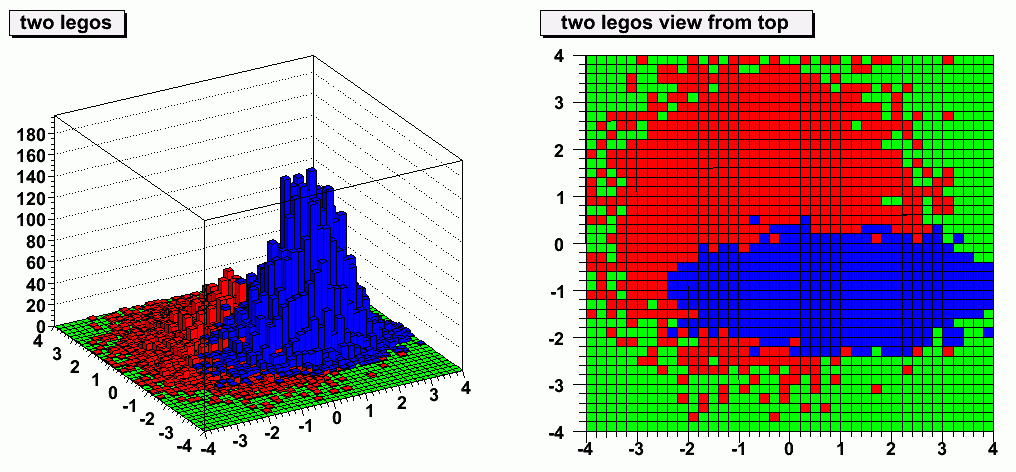 Two legos plots combined Two legos plots combined |
 An event display based on ROOT GUI
 GUI tools to build applications
 ROOT object browser
 TBrowser as a code editor
 TBrowser to draw histograms


