Finding Thresholds (original) (raw)
Most of the examples from this package are centred around thresholding images, but really the core function[auto_thresh()](../reference/auto%5Fthresh.html) can be used to find thresholds for any non-negative integer data.
Mostly high, some low
Let’s create a vector of values, most of which are greater than 50, the rest of which are less than 10:
Now let’s take a look at the distribution of x:
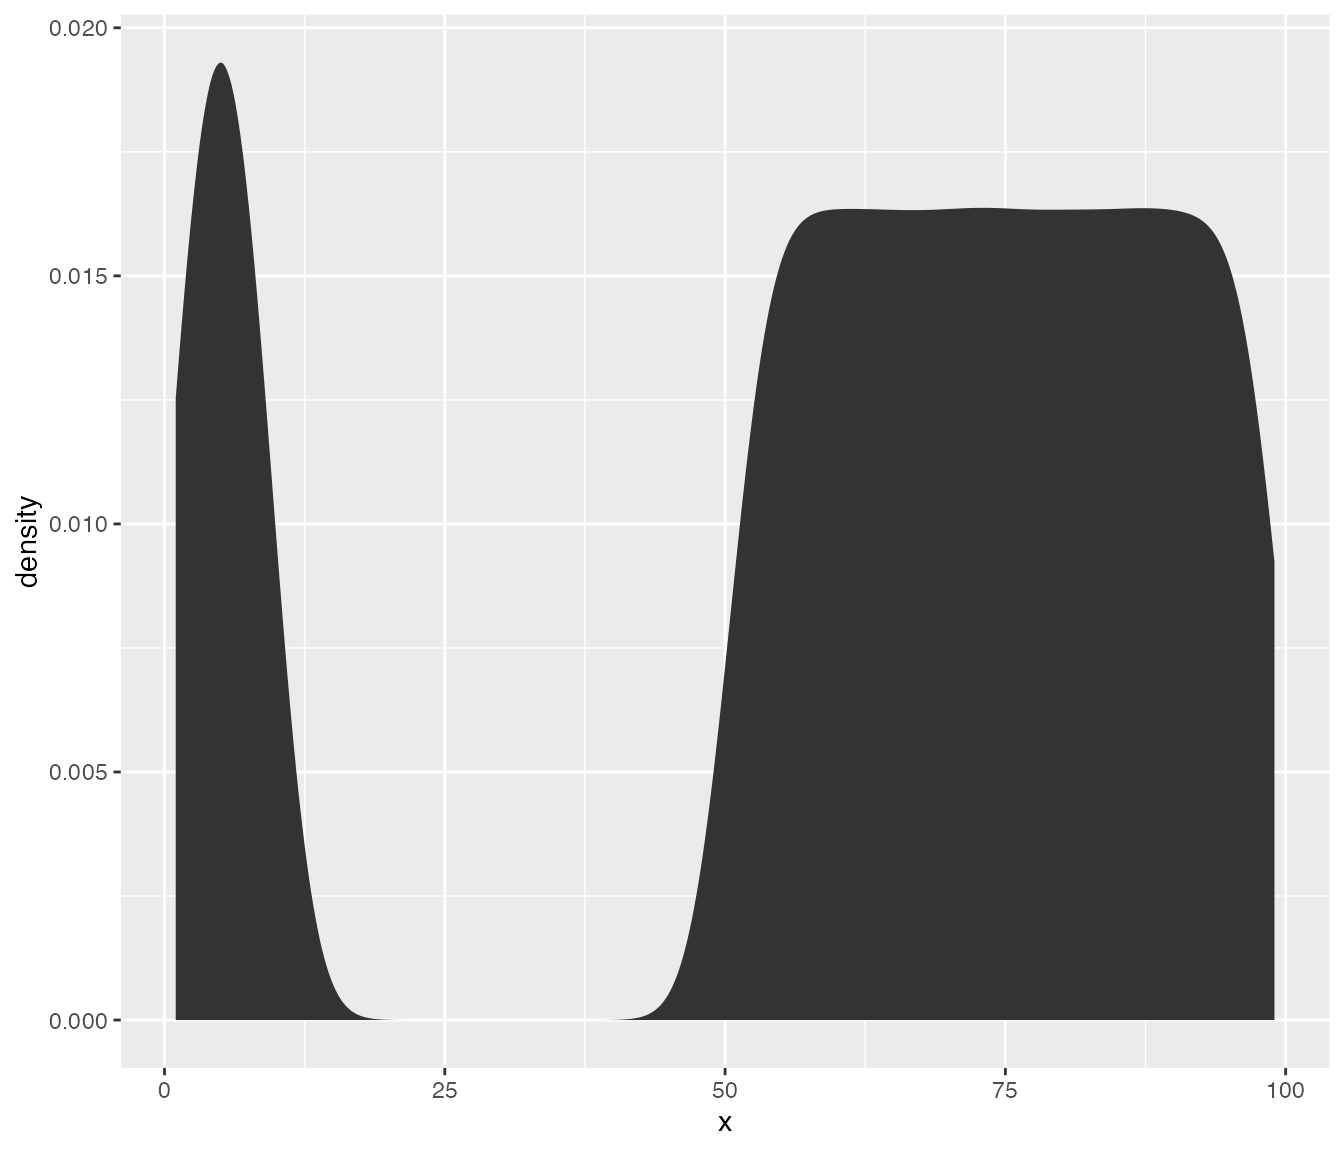
If you’re trying to threshold this sort of data, you’re probably looking for a method which will find a threshold that separates the larger values from the smaller ones. The available automatic thresholding methods are “IJDefault”, “Huang”, “Huang2”, “Intermodes”, “IsoData”, “Li”, “MaxEntropy”, “Mean”, “MinErrorI”, “Minimum”, “Moments”, “Otsu”, “Percentile”, “RenyiEntropy”, “Shanbhag”, “Triangle” and “Yen”. These are well demonstrated at https://imagej.net/plugins/auto-threshold.
Trying all methods
“MaxEntropy” and “Yen” often fail to find a threshold, so I generally avoid them. Let’s try out all the rest.
library(autothresholdr)
thresh_methods <- c(
  "IJDefault", "Huang", "Huang2", "Intermodes", "IsoData",
  "Li", "Mean", "MinErrorI", "Minimum", "Moments", "Otsu",
  "Percentile", "RenyiEntropy", "Shanbhag", "Triangle"
)
thresholds <- purrr::map_chr(thresh_methods, ~ auto_thresh(x, .)) %>%
  tibble(method = thresh_methods, threshold = .)
#> Warning: Automatic coercion from integer to character was deprecated in purrr 1.0.0.
#> ℹ Please use an explicit call to `as.character()` within `map_chr()` instead.
#> Call `lifecycle::last_lifecycle_warnings()` to see where this warning was
#> generated.
print(thresholds)
#> # A tibble: 15 × 2
#>    method       threshold
#>    <chr>        <chr>
#>  1 IJDefault    40
#>  2 Huang        9
#>  3 Huang2       9
#>  4 Intermodes   39
#>  5 IsoData      40
#>  6 Li           25
#>  7 Mean         60
#>  8 MinErrorI    60
#>  9 Minimum      33
#> 10 Moments      56
#> 11 Otsu         9
#> 12 Percentile   68
#> 13 RenyiEntropy 70
#> 14 Shanbhag     70
#> 15 Triangle     11
Now, which of these selected a threshold between 10 and 49?
filter(thresholds, threshold >= 10, threshold <= 49)
#> # A tibble: 6 × 2
#>   method     threshold
#>   <chr>      <chr>
#> 1 IJDefault  40
#> 2 Intermodes 39
#> 3 IsoData    40
#> 4 Li         25
#> 5 Minimum    33
#> 6 Triangle   11
The other methods aren’t necessarily wrong, they’re just more strict or more lax than these ones. For thresholding microscopy images to remove background, my favourite methods are “Huang” and “Triangle” because they are quite conservative in that anything even slightly above background is kept.
Using one method
auto_thresh(x, "huang")
#> [1] 9
#> attr(,"ignore_black")
#> [1] FALSE
#> attr(,"ignore_white")
#> [1] FALSE
#> attr(,"ignore_na")
#> [1] FALSE
#> attr(,"autothresh_method")
#> [1] "Huang"
#> attr(,"class")
#> [1] "th"      "integer"
auto_thresh(x, "tri")
#> [1] 11
#> attr(,"ignore_black")
#> [1] FALSE
#> attr(,"ignore_white")
#> [1] FALSE
#> attr(,"ignore_na")
#> [1] FALSE
#> attr(,"autothresh_method")
#> [1] "Triangle"
#> attr(,"class")
#> [1] "th"      "integer"
auto_thresh(x, "otsu")
#> [1] 9
#> attr(,"ignore_black")
#> [1] FALSE
#> attr(,"ignore_white")
#> [1] FALSE
#> attr(,"ignore_na")
#> [1] FALSE
#> attr(,"autothresh_method")
#> [1] "Otsu"
#> attr(,"class")
#> [1] "th"      "integer"
Using a frequency table
Rather than an array of values, you may have a frequency table. I’ll create one here from x.
If you have the data in this format (a data frame with column namesvalue and n) you can use the same function[auto_thresh()](../reference/auto%5Fthresh.html).
auto_thresh(x_freqtab, "huang")
#> [1] 9
#> attr(,"ignore_black")
#> [1] FALSE
#> attr(,"ignore_white")
#> [1] FALSE
#> attr(,"ignore_na")
#> [1] FALSE
#> attr(,"autothresh_method")
#> [1] "Huang"
#> attr(,"class")
#> [1] "th"      "integer"