SankeyMATIC: A Sankey diagram builder for everyone (original) (raw)
Make beautiful flow diagrams
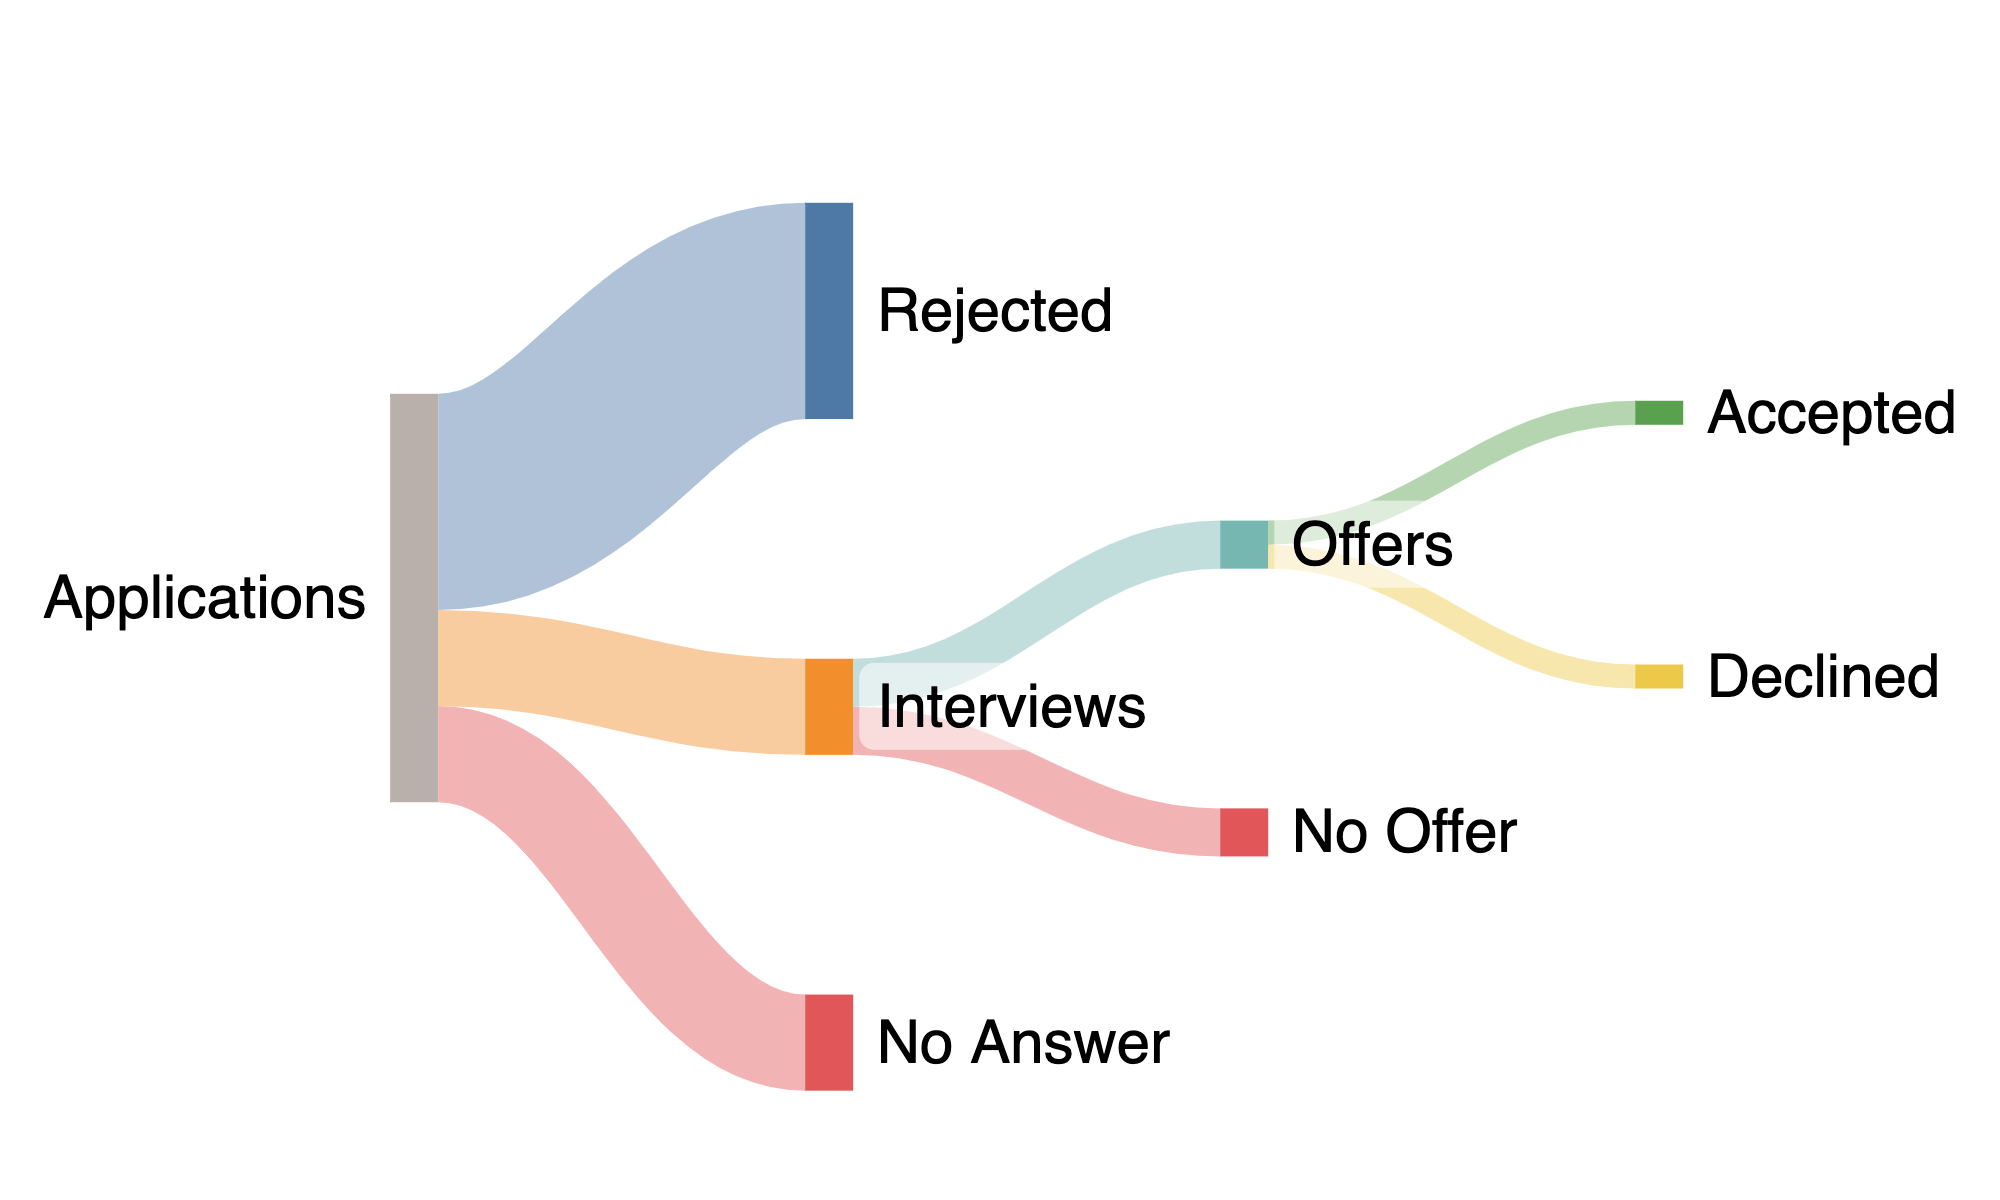
Sankey diagrams are used to compare amounts through different stages.
They can visualize: budgets, financial results, the story of an application process, elections with multiple rounds, and more.
Enter your data easily
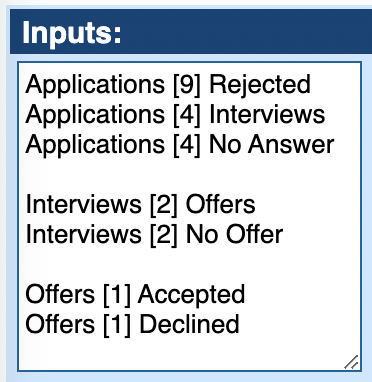
The format for entering flows is simple:
Source [Amount] Target
![Screenshot of these inputs in the SankeyMATIC interface: Applications [9] Rejected Applications [4] Interviews Applications [4] No Answer
Interviews [2] Offers Interviews [2] No Offer
Offers [1] Accepted Offers [1] Declined](https://sankeymatic.com/i/inputs-example.png)
Customize your diagram interactively
SankeyMATIC provides a wide array of controls which enable you to make your diagram look the way you want.
![Screenshot of these inputs in the SankeyMATIC interface:
A [1] B
A [1] C](https://sankeymatic.com/i/inputs-customize.png)
Save your work multiple ways
You can export a diagram as:
- a high-resolution image (PNG), choosing from multiple sizes
- a vector file (SVG), suitable for embedding in a web page or importing into a vector graphics editor.
You can also save the current state of your work in a readable plain text file, making it easy to:
- ...resume your work later on any computer or in any browser
- ...compare versions of a diagram (by showing the differences between source files)