Climate Science Special Report: Extreme Storms (original) (raw)
9.1: Introduction
Extreme storms have numerous impacts on lives and property. Quantifying how broad-scale average climate influences the behavior of extreme storms is particularly challenging, in part because extreme storms are comparatively rare short-lived events and occur within an environment of largely random variability. Additionally, because the physical mechanisms linking climate change and extreme storms can manifest in a variety of ways, even the sign of the changes in the extreme storms can vary in a warming climate. This makes detection and attribution of trends in extreme storm characteristics more difficult than detection and attribution of trends in the larger environment in which the storms evolve (e.g., Ch. 6: Temperature Change). Projecting changes in severe storms is also challenging because of model constraints in how they capture and represent small-scale, highly local physics. Despite the challenges, good progress is being made for a variety of storm types, such as tropical cyclones, severe convective storms (thunderstorms), winter storms, and atmospheric river events.
9.2: Tropical Cyclones (Hurricanes and Typhoons)
Detection and attribution (Ch. 3: Detection and Attribution) of past changes in tropical cyclone (TC) behavior remain a challenge due to the nature of the historical data, which are highly heterogeneous in both time and among the various regions that collect and analyze the data.1 ,2 ,3 While there are ongoing efforts to reanalyze and homogenize the data (e.g., Landsea et al. 2015;4 Kossin et al. 20132), there is still low confidence that any reported long-term (multidecadal to centennial) increases in TC activity are robust, after accounting for past changes in observing capabilities [which is unchanged from the Intergovernmental Panel on Climate Change Fifth Assessment Report (IPCC AR5) assessment statement5]. This is not meant to imply that no such increases have occurred, but rather that the data are not of a high enough quality to determine this with much confidence. Furthermore, it has been argued that within the period of highest data quality (since around 1980), the globally observed changes in the environment would not necessarily support a detectable trend in tropical cyclone intensity.2 That is, the trend signal has not yet had time to rise above the background variability of natural processes.
Both theory and numerical modeling simulations (in general) indicate an increase in TC intensity in a warmer world, and the models generally show an increase in the number of very intense TCs.6 ,7 ,8 ,9 ,10 In some cases, climate models can be used to make attribution statements about TCs without formal detection (see also Ch. 3: Detection and Attribution). For example, there is evidence that, in addition to the effects of El Niño, anthropogenic forcing made the extremely active 2014 Hawaiian hurricane season substantially more likely, although no significant rising trend in TC frequency near Hawai‘i was detected.11
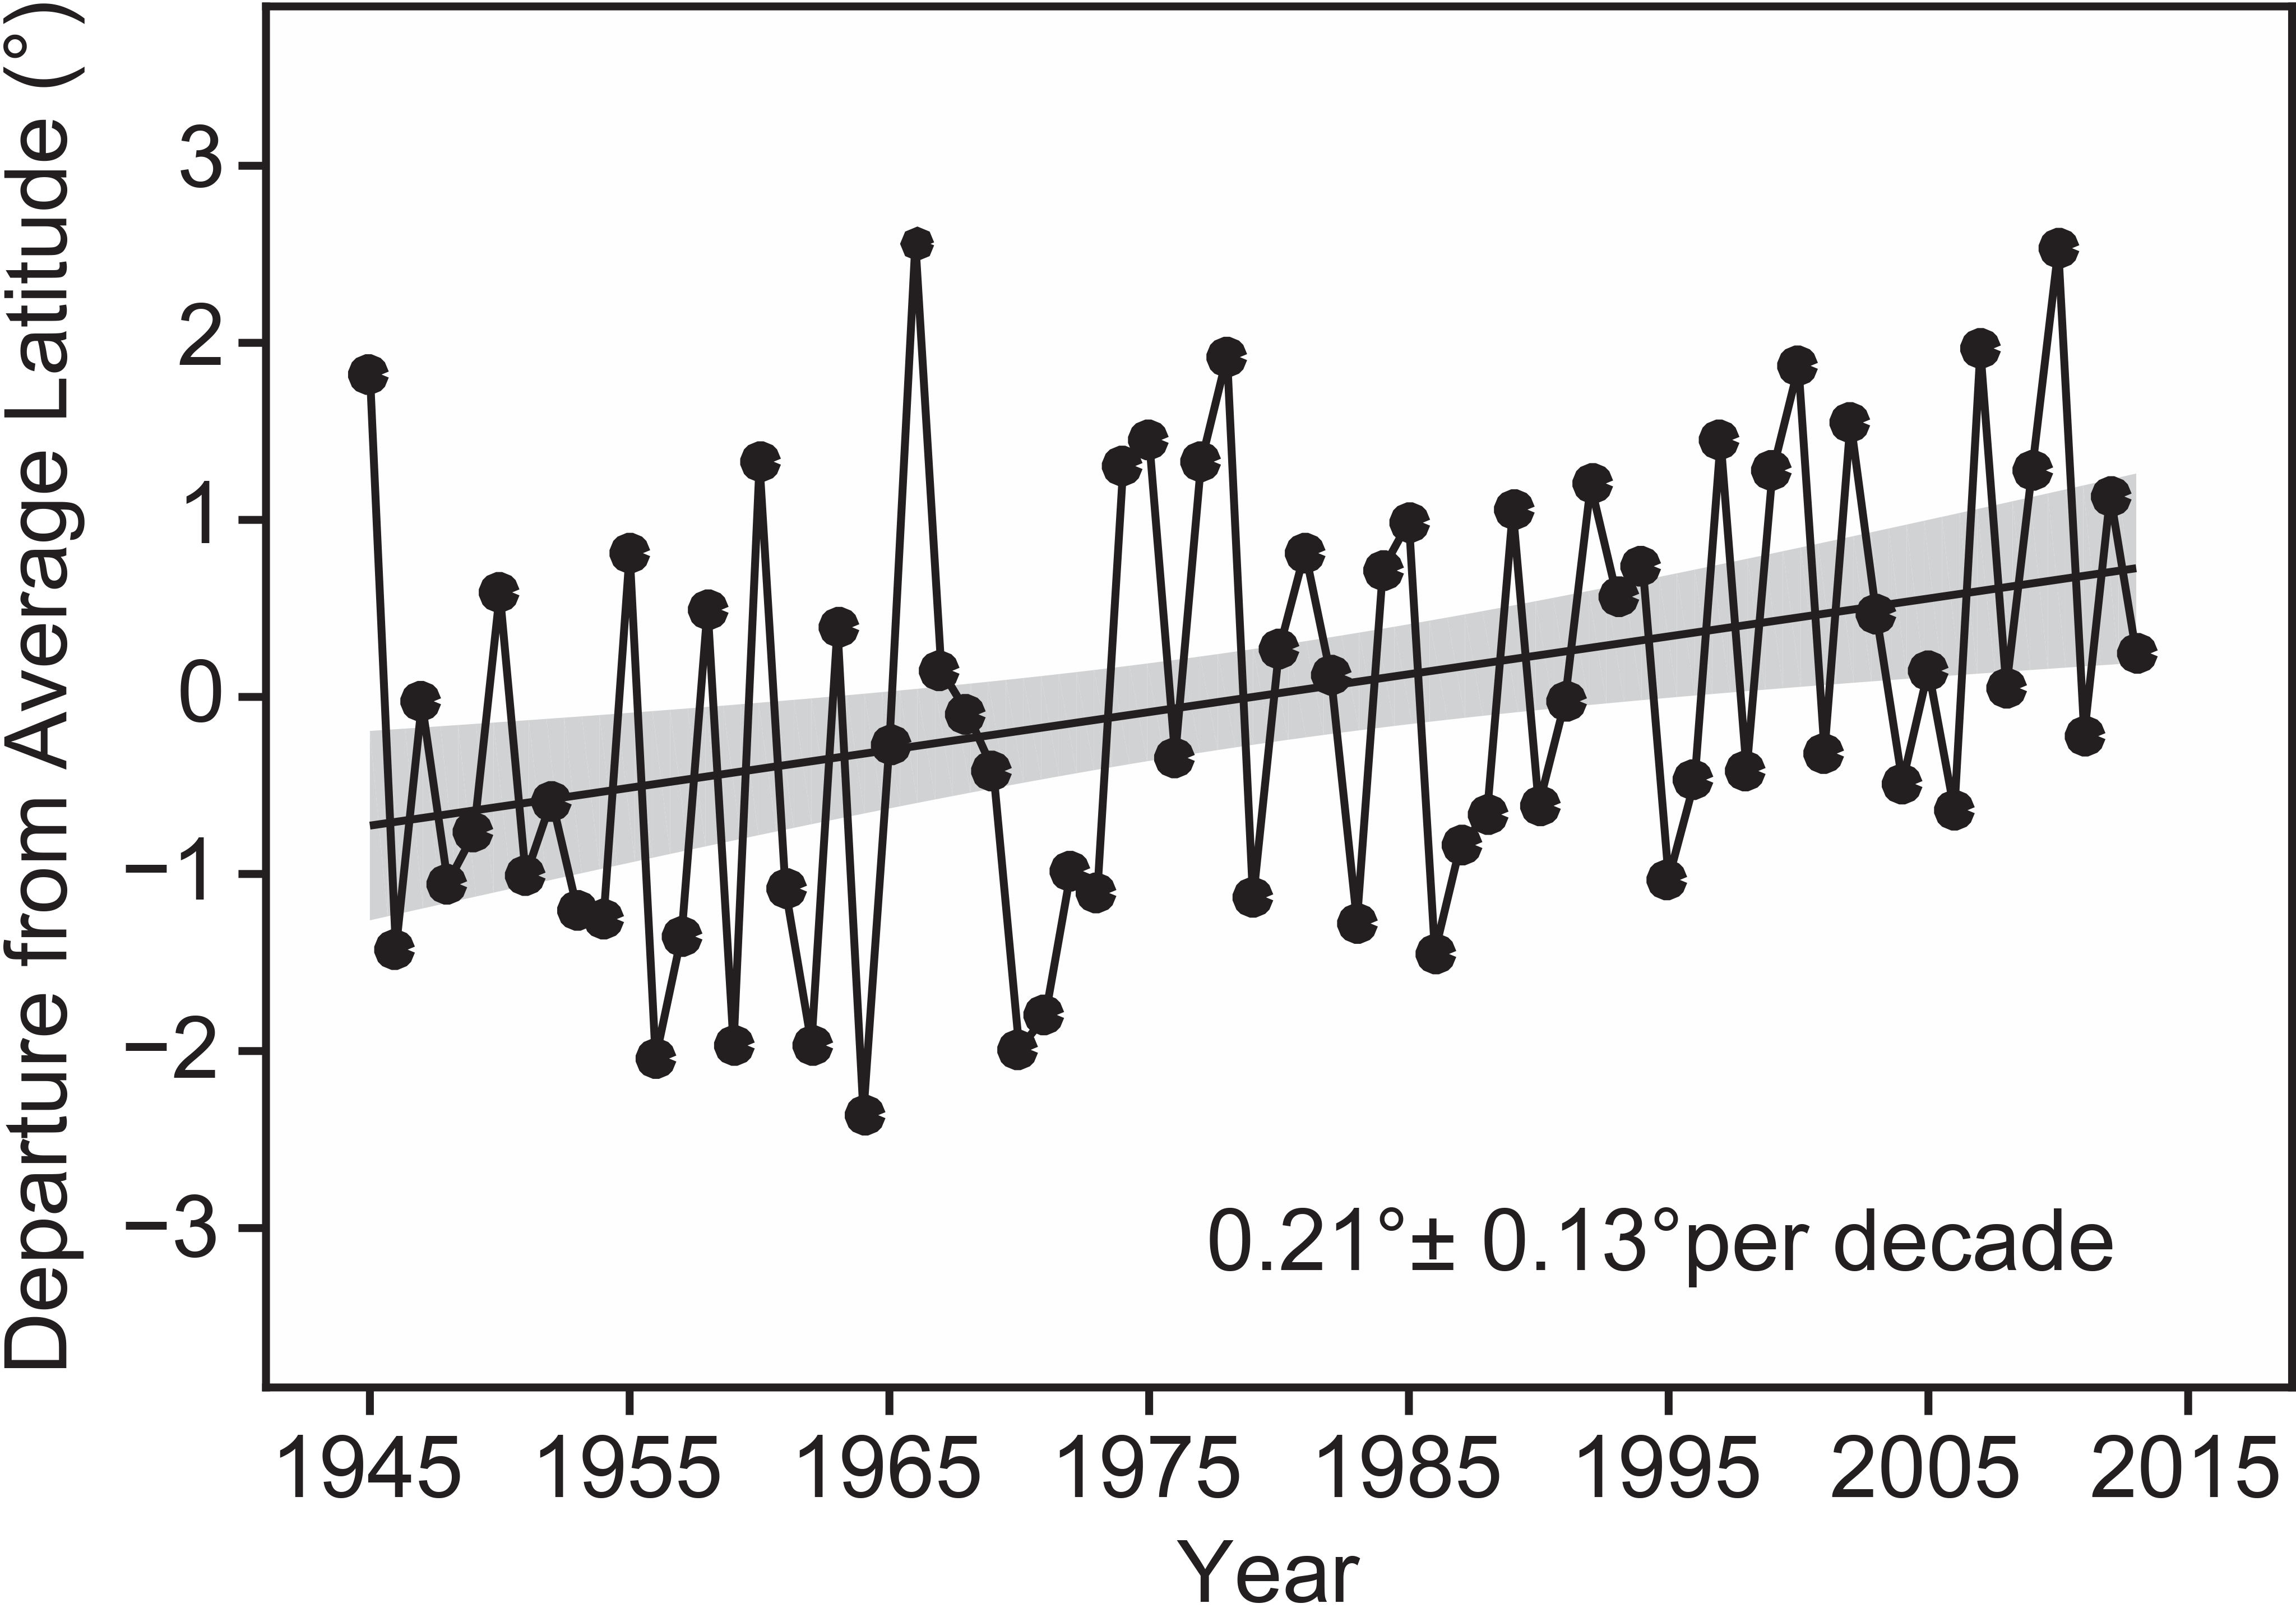
Changes in frequency and intensity are not the only measures of TC behavior that may be affected by climate variability and change, and there is evidence that the locations where TCs reach their peak intensity has migrated poleward over the past 30 years in the Northern and Southern Hemispheres, apparently in concert with environmental changes associated with the independently observed expansion of the tropics.12 The poleward migration in the western North Pacific,13 which includes a number of U.S. territories, appears particularly consistent among the various available TC datasets and remains significant over the past 60–70 years after accounting for the known modes of natural variability in the region (Figure 9.1). The migration, which can substantially change patterns of TC hazard exposure and mortality risk, is also evident in 21st century Coupled Model Intercomparison Project Phase 5 (CMIP5) projections following the RCP8.5 emissions trajectories, suggesting a possible link to human activities. Further analysis comparing observed past TC behavior with climate model historical forcing runs (and with model control runs simulating multidecadal internal climate variability alone) are needed to better understand this process, but it is expected that this will be an area of heightened future research.
Figure 9.1
Poleward migration, in degrees of latitude, of the location of annual mean tropical cyclone (TC) peak lifetime intensity in the western North Pacific Ocean, after accounting for the known regional modes of interannual (El Niño–Southern Oscillation; ENSO) and interdecadal (Pacific Decadal Oscillation; PDO) variability. The time series shows residuals of the multivariate regression of annually averaged latitude of TC peak lifetime intensity onto the mean Niño-3.4 and PDO indices. Data are taken from the Joint Typhoon Warning Center (JTWC). Shading shows 95% confidence bounds for the trend. Annotated values at lower right show the mean migration rate and its 95% confidence interval in degrees per decade for the period 1945–2013. (Figure source: adapted from Kossin et al. 2016;13 © American Meteorological Society. Used with permission.)
In the Atlantic, observed multidecadal variability of the ocean and atmosphere, which TCs are shown to respond to, has been ascribed (Ch. 3: Detection and Attribution) to natural internal variability via meridional overturning ocean circulation changes,14 natural external variability caused by volcanic eruptions15 ,16 and Saharan dust outbreaks,17 ,18 and anthropogenic external forcing via greenhouse gases and sulfate aerosols.19 ,20 ,21 Determining the relative contributions of each mechanism to the observed multidecadal variability in the Atlantic, and even whether natural or anthropogenic factors have dominated, is presently a very active area of research and debate, and no consensus has yet been reached.22 ,23 ,24 ,25 ,26 ,27 Despite the level of disagreement about the relative magnitude of human influences, there is broad agreement that human factors have had an impact on the observed oceanic and atmospheric variability in the North Atlantic, and there is medium confidence that this has contributed to the observed increase in hurricane activity since the 1970s. This is essentially unchanged from the IPCC AR5 statement,6 although the post-AR5 literature has only served to further support this statement.28This is expected to remain an active research topic in the foreseeable future.
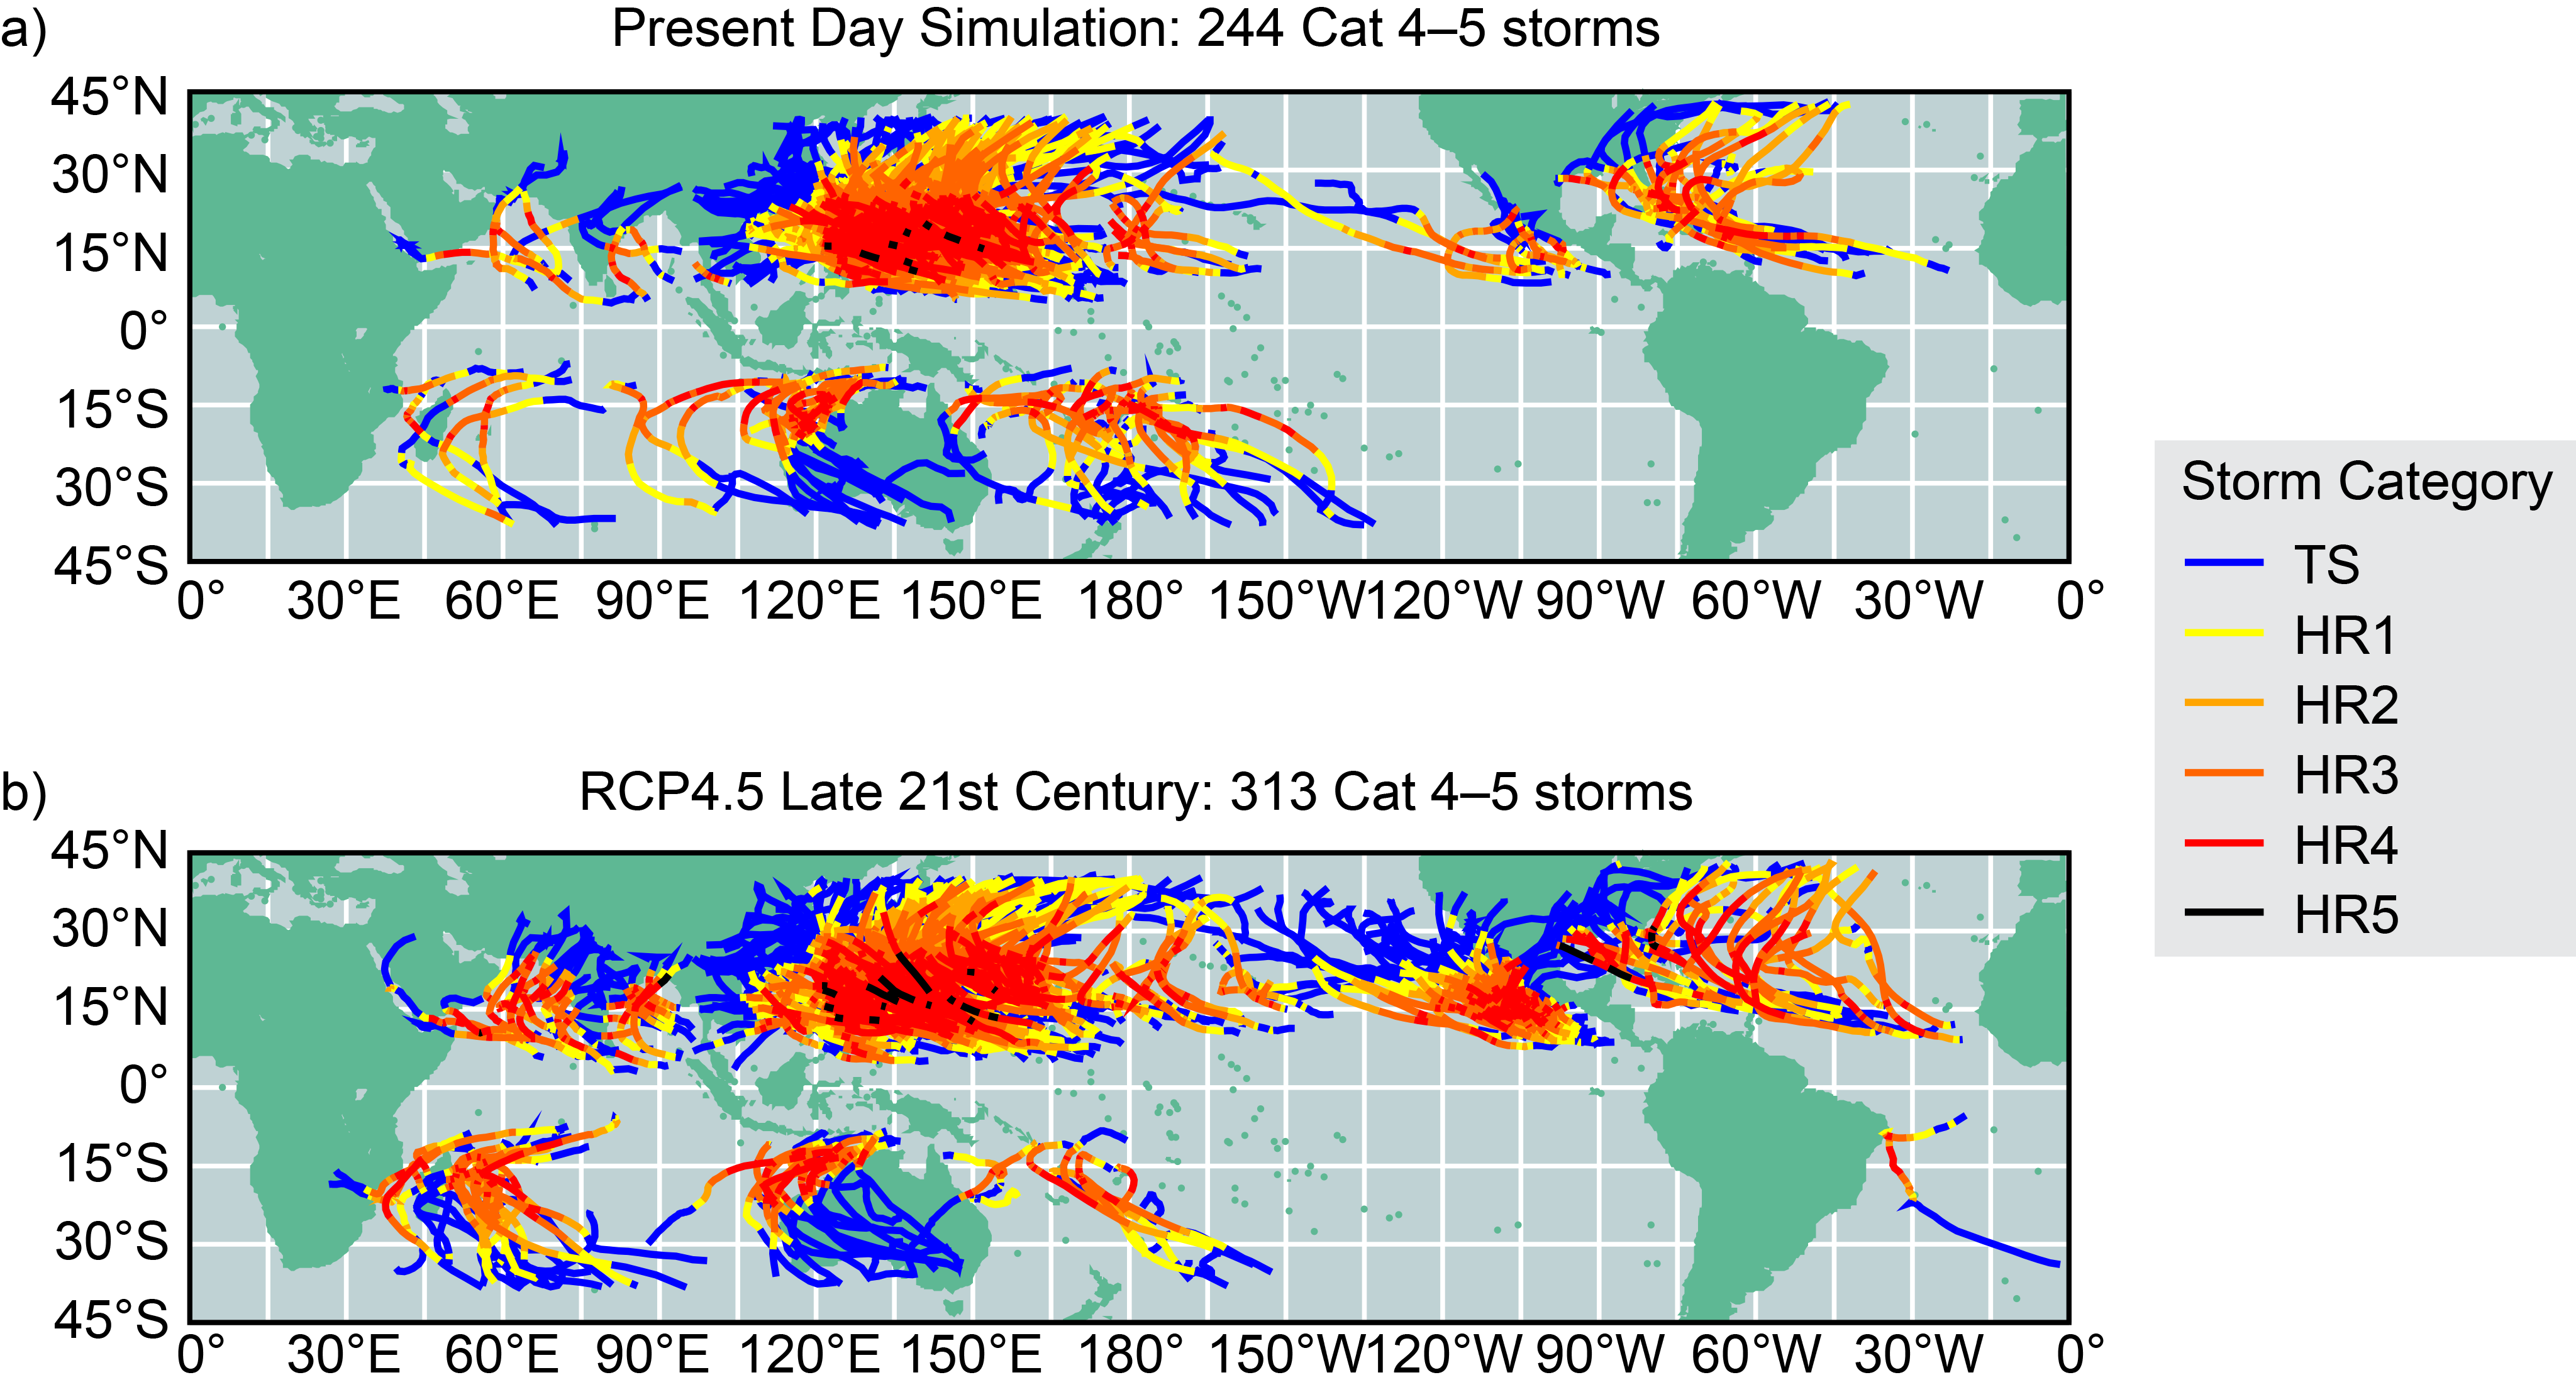
The IPCC AR5 consensus TC projections for the late 21st century (IPCC Figure 14.17)8 include an increase in global mean TC intensity, precipitation rate, and frequency of very intense (Saffir-Simpson Category 4–5) TCs, and a decrease, or little change, in global TC frequency. Since the IPCC AR5, some studies have provided additional support for this consensus, and some have challenged an aspect of it. For example, a recent study9 projects increased mean hurricane intensities in the Atlantic Ocean basin and in most, but not all, other TC-supporting basins (see Table 3 in Knutson et al. 20159). In their study, the global occurrence of Saffir–Simpson Category 4–5 storms was projected to increase significantly, with the most significant basin-scale changes projected for the Northeast Pacific basin, potentially increasing intense hurricane risk to Hawai‘i (Figure 9.2) over the coming century. However, another recent (post-AR5) study proposed that increased thermal stratification of the upper ocean in CMIP5 climate warming scenarios should substantially reduce the warming-induced intensification of TCs estimated in previous studies.29 Follow-up studies, however, estimate that the effect of such increased stratification is relatively small, reducing the projected intensification of TCs by only about 10%–15%.30 ,31
Another recent study challenged the IPCC AR5 consensus projection of a decrease, or little change, in global tropical cyclone frequency by simulating increased global TC frequency over the 21st century under the higher scenario (RCP8.5).32 However, another modeling study has found that neither direct analysis of CMIP5-class simulations, nor indirect inferences from the simulations (such as those of Emanuel 201332), could reproduce the decrease in TC frequency projected in a warmer world by high-resolution TC-permitting climate models,33 which adds uncertainty to the results of Emanuel.32
In summary, despite new research that challenges one aspect of the AR5 consensus for late 21st century-projected TC activity, it remains_likely_ that global mean tropical cyclone maximum wind speeds and precipitation rates will increase; and it is more likely than not_that the global frequency of occurrence of TCs will either decrease or remain essentially the same. Confidence in projected global increases of intensity and tropical cyclone precipitation rates is_medium and high, respectively, as there is better model consensus. Confidence is further heightened, particularly for projected increases in precipitation rates, by a robust physical understanding of the processes that lead to these increases. Confidence in projected increases in the frequency of very intense TCs is generally lower (medium in the eastern North Pacific and low in the western North Pacific and Atlantic) due to comparatively fewer studies available and due to the competing influences of projected reductions in overall storm frequency and increased mean intensity on the frequency of the most intense storms. Both the magnitude and sign of projected changes in individual ocean basins appears to depend on the large-scale pattern of changes to atmospheric circulation and ocean surface temperature (e.g., Knutson et al. 20159). Projections of these regional patterns of change—apparently critical for TC projections—are uncertain, leading to uncertainty in regional TC projections.
Figure 9.2

Tracks of simulated Saffir–Simpson Category 4–5 tropical cyclones for (a) present-day or (b) late-21st-century conditions, based on dynamical downscaling of climate conditions from the CMIP5 multimodel ensemble (lower scenario; RCP4.5). The tropical cyclones were initially simulated using a 50-km grid global atmospheric model, but each individual tropical cyclone was re-simulated at higher resolution using the GFDL hurricane model to provide more realistic storm intensities and structure. Storm categories or intensities are shown over the lifetime of each simulated storm, according to the Saffir–Simpson scale. The categories are depicted by the track colors, varying from tropical storm (blue) to Category 5 (black; see legend). (Figure source: Knutson et al. 2015;9 © American Meteorological Society. Used with permission.)
9.3: Severe Convective Storms (Thunderstorms)
Tornado and severe thunderstorm events cause significant loss of life and property: more than one-third of the $1 billion weather disasters in the United States during the past 25 years were due to such events, and, relative to other extreme weather, the damages from convective weather hazards have undergone the largest increase since 1980.40A particular challenge in quantifying the existence and intensity of these events arises from the data source: rather than measurements, the occurrence of tornadoes and severe thunderstorms is determined by visual sightings by eyewitnesses (such as “storm spotters” and law enforcement officials) or post-storm damage assessments. The reporting has been susceptible to changes in population density, modifications to reporting procedures and training, the introduction of video and social media, and so on. These have led to systematic, non-meteorological biases in the long-term data record.
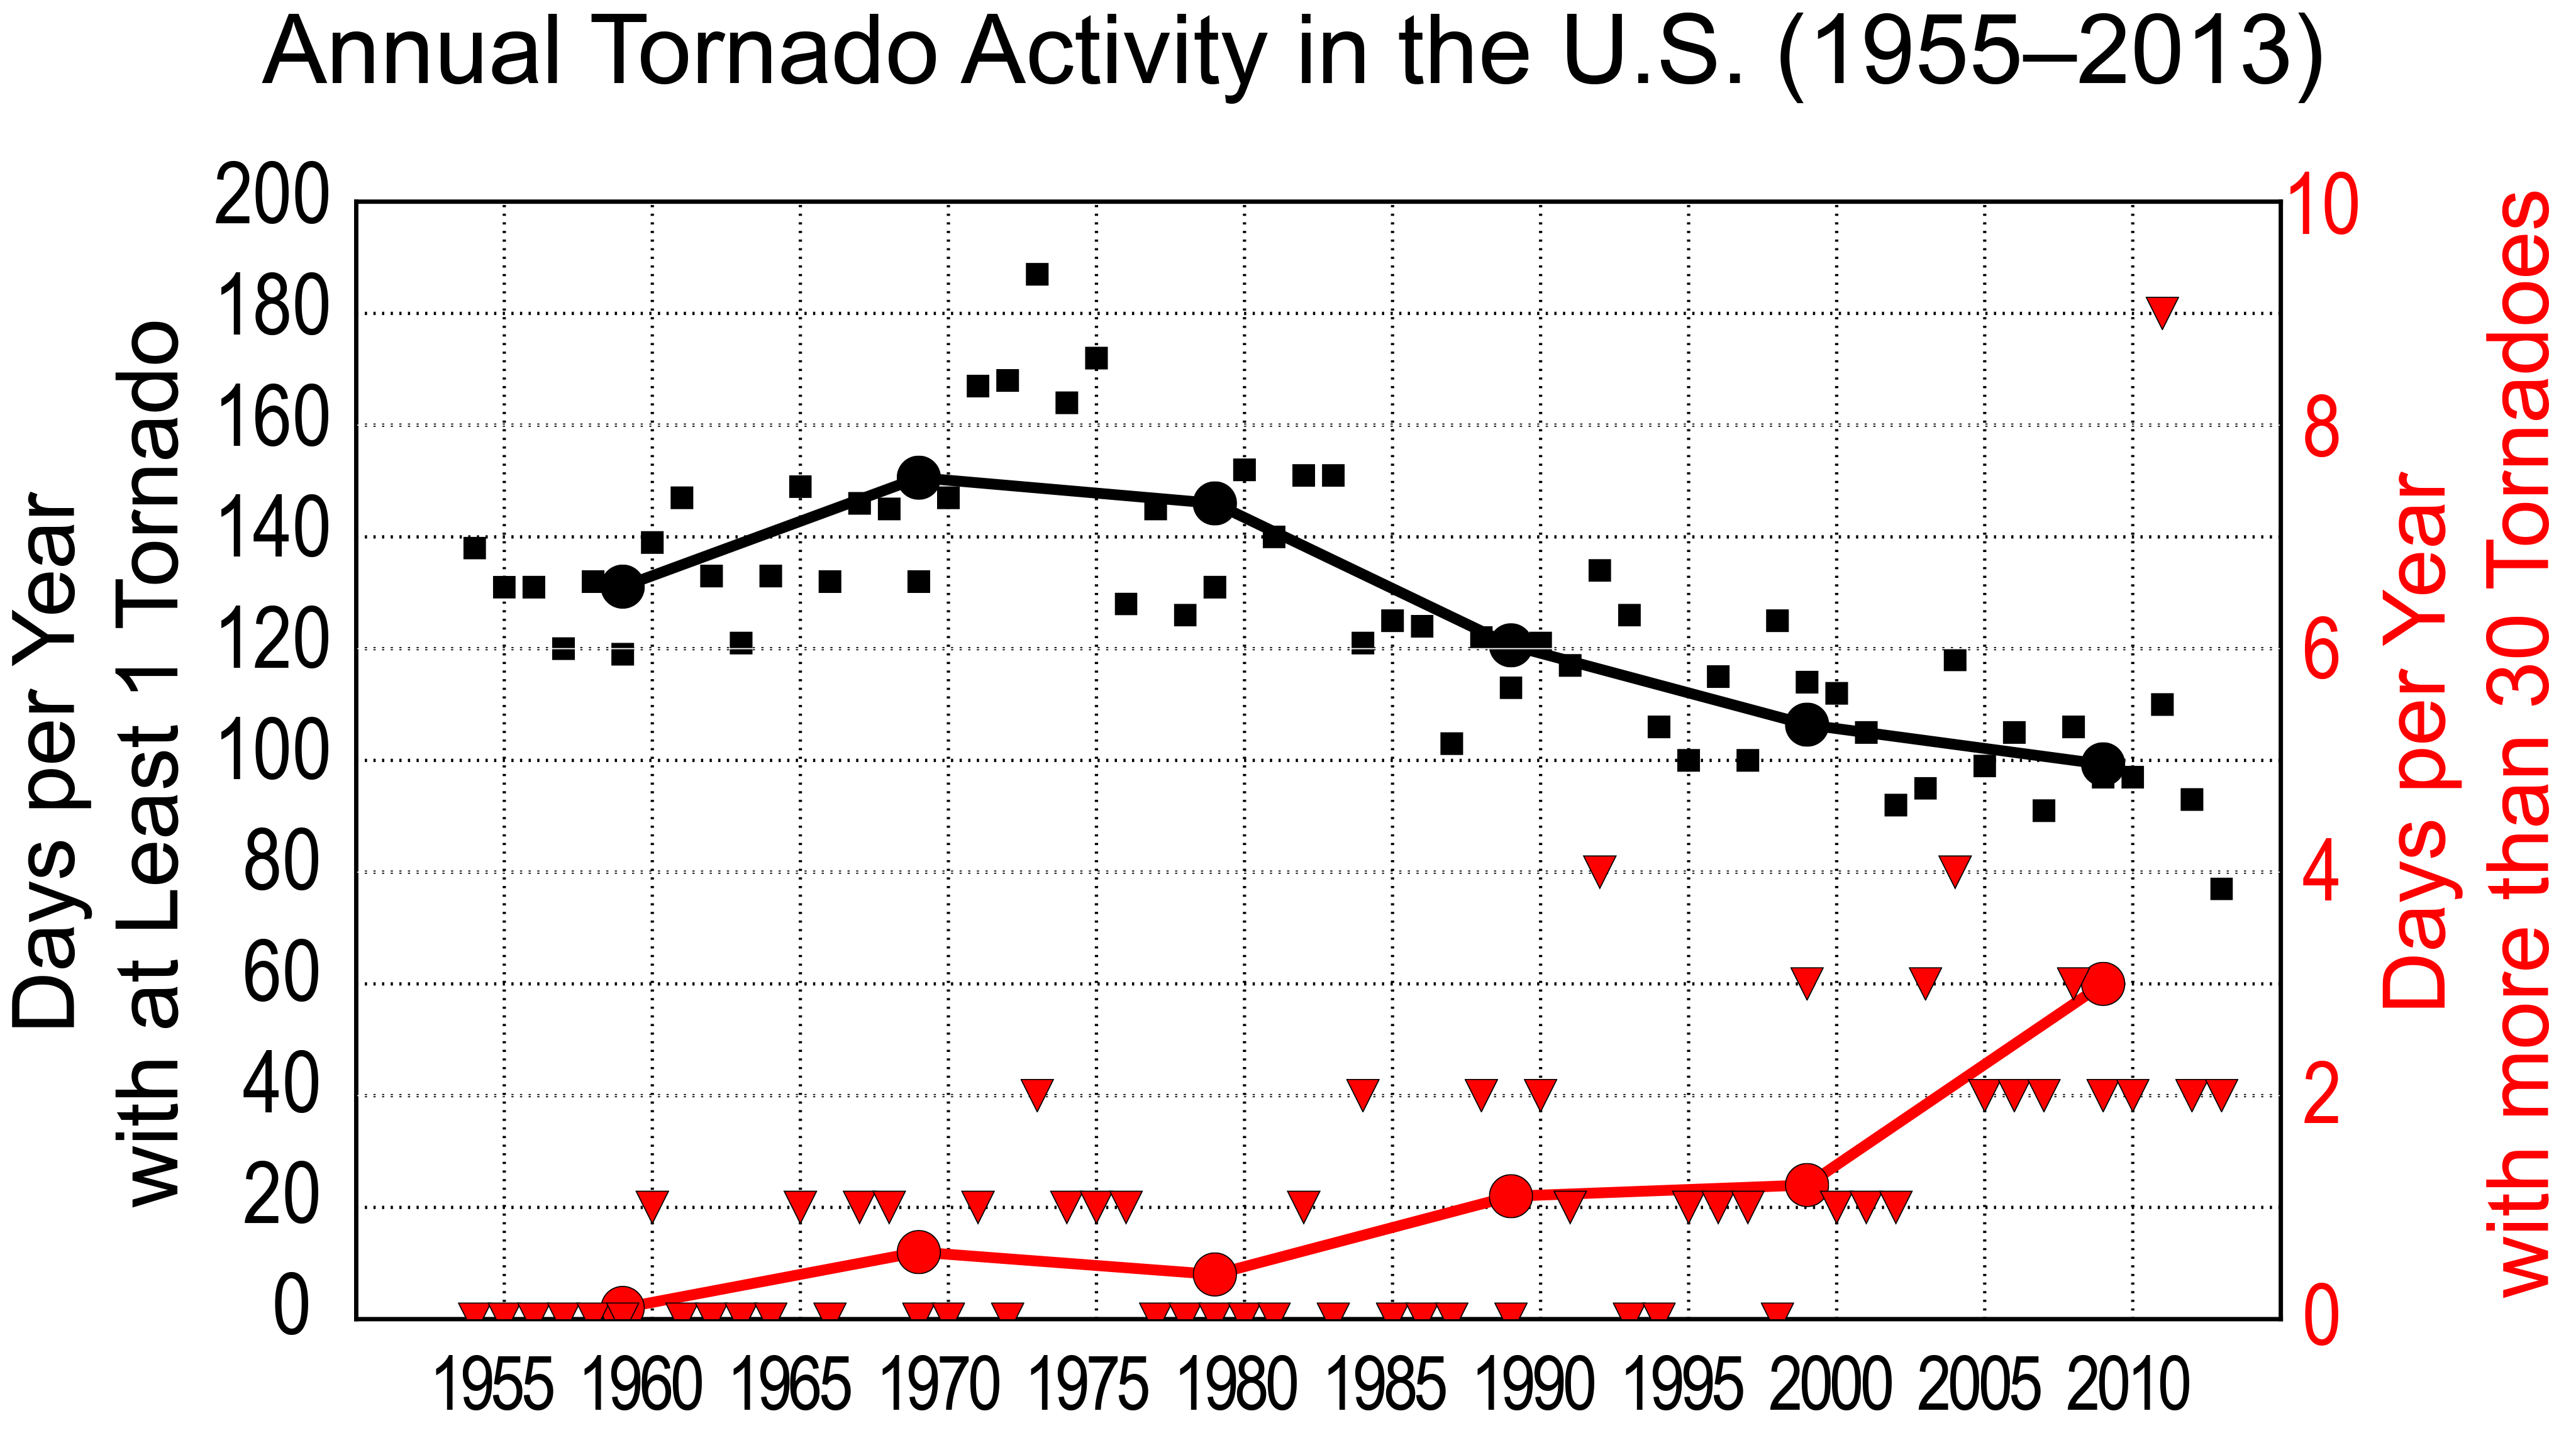
Nonetheless, judicious use of the report database has revealed important information about tornado trends. Since the 1970s, the United States has experienced a decrease in the number of days per year on which tornadoes occur, but an increase in the number of tornadoes that form on such days.41 One important implication is that the frequency of days with large numbers of tornadoes—tornado outbreaks—appears to be increasing (Figure 9.3). The extent of the season over which such tornado activity occurs is increasing as well: although tornadoes in the United States are observed in all months of the year, an earlier calendar-day start to the season of high activity is emerging. In general, there is more interannual variability, or volatility, in tornado occurrence (see also Elsner et al. 201542).43
Figure 9.3
Annual tornado activity in the United States over the period 1955–2013. The black squares indicate the number of days per year with at least one tornado rated (E)F1 or greater, and the black circles and line show the decadal mean line of such tornado days. The red triangles indicate the number of days per year with more than 30 tornadoes rated (E)F1 or greater, and the red circles and line show the decadal mean of these tornado outbreaks. (Figure source: redrawn from Brooks et al. 201441).
Evaluations of hail and (non-tornadic) thunderstorm wind reports have thus far been less revealing. Although there is evidence of an increase in the number of hail days per year, the inherent uncertainty in reported hail size reduces the confidence in such a conclusion.44Thunderstorm wind reports have proven to be even less reliable, because, as compared to tornadoes and hail, there is less tangible visual evidence; thus, although the United States has lately experienced several significant thunderstorm wind events (sometimes referred to as “derechos”), the lack of studies that explore long-term trends in wind events and the uncertainties in the historical data preclude any robust assessment.
It is possible to bypass the use of reports by exploiting the fact that the temperature, humidity, and wind in the larger vicinity—or “environment”—of a developing thunderstorm ultimately control the intensity, morphology, and hazardous tendency of the storm. Thus, the premise is that quantifications of the vertical profiles of temperature, humidity, and wind can be used as a proxy for actual severe thunderstorm occurrence. In particular, a thresholded product of convective available potential energy (CAPE) and vertical wind shear over a surface-to-6 km layer (S06) constitutes one widely used means of representing the frequency of severe thunderstorms.45 This environmental-proxy approach avoids the biases and other issues with eyewitness storm reports and is readily evaluated using the relatively coarse global datasets and global climate models. It has the disadvantage of assuming that a thunderstorm will necessarily form and then realize its environmental potential.
Upon employing global climate models (GCMs) to evaluate CAPE and S06, a consistent finding among a growing number of proxy-based studies is a projected increase in the frequency of severe thunderstorm environments in the United States over the mid- to late 21st century.46 ,47 ,48 ,49 ,50 ,51 The most robust projected increases in frequency are over the U.S. Midwest and southern Great Plains, during March-April-May (MAM).46 Based on the increased frequency of very high CAPE, increases in storm intensity are also projected over this same period (see also Del Genio et al. 200752).
Key limitations of the environmental proxy approach are being addressed through the applications of high-resolution dynamical downscaling, wherein sufficiently fine model grids are used so that individual thunderstorms are explicitly resolved, rather than implicitly represented (as through environmental proxies). The individually modeled thunderstorms can then be quantified and assessed in terms of severity.53 ,54 ,55 The dynamical-downscaling results have thus far supported the basic findings of the environmental proxy studies, particularly in terms of the seasons and geographical regions projected to experience the largest increases in severe thunderstorm occurrence.46
The computational expense of high-resolution dynamical downscaling makes it difficult to generate model ensembles over long time periods, and thus to assess the uncertainty of the downscaled projections. Because these dynamical downscaling implementations focus on the statistics of storm occurrence rather than on faithful representations of individual events, they have generally been unconcerned with specific extreme convective events in history. So, for example, such downscaling does not address whether the intensity of an event like the Joplin, Missouri, tornado of May 22, 2011, would be amplified under projected future climates. Recently, the “pseudo-global warming” (PGW) methodology (see Schär et al. 199656), which is a variant of dynamical downscaling, has been adapted to address these and related questions. As an example, when the parent “supercell” of select historical tornado events forms under the climate conditions projected during the late 21st century, it does not evolve into a benign, unorganized thunderstorm but instead maintains its supercellular structure.57As measured by updraft strength, the intensity of these supercells under PGW is relatively higher, although not in proportion to the theoretical intensity based on the projected higher levels of CAPE. The adverse effects of enhanced precipitation loading under PGW has been offered as one possible explanation for such shortfalls in projected updraft strength.
9.4: Winter Storms
The frequency of large snowfall years has decreased in the southern United States and Pacific Northwest and increased in the northern United States (see Ch. 7: Precipitation Change). The winters of2013⁄2014 and 2014⁄2015 have contributed to this trend. They were characterized by frequent storms and heavier-than-normal snowfalls in the Midwest and Northeast and drought in the western United States. These were related to blocking (a large-scale pressure pattern with little or no movement) of the wintertime circulation in the Pacific sector of the Northern Hemisphere (e.g., Marinaro et al. 201558) that put the midwestern and northeastern United States in the primary winter storm track, while at the same time reducing the number of winter storms in California, causing severe drought conditions.59While some observational studies suggest a linkage between blocking affecting the U.S. climate and enhanced arctic warming (arctic amplification), specifically for an increase in highly amplified jet stream patterns in winter over the United States,60 other studies show mixed results.61 ,62 ,63 Therefore, a definitive understanding of the effects of arctic amplification on midlatitude winter weather remains elusive. Other explanations have been offered for the weather patterns of recent winters, such as anomalously strong Pacific trade winds,64 but these have not been linked to anthropogenic forcing (e.g., Delworth et al. 201565).
Analysis of storm tracks indicates that there has been an increase in winter storm frequency and intensity since 1950, with a slight shift in tracks toward the poles.66 ,67 ,68 Current global climate models (CMIP5) do in fact predict an increase in extratropical cyclone (ETC) frequency over the eastern United States, including the most intense ETCs, under the higher scenario (RCP8.5).69 However, there are large model-to-model differences in the realism of ETC simulations and in the projected changes. Moreover, projected ETC changes have large regional variations, including a decreased total frequency in the North Atlantic, further highlighting the complexity of the response to climate change.
9.5: Atmospheric Rivers
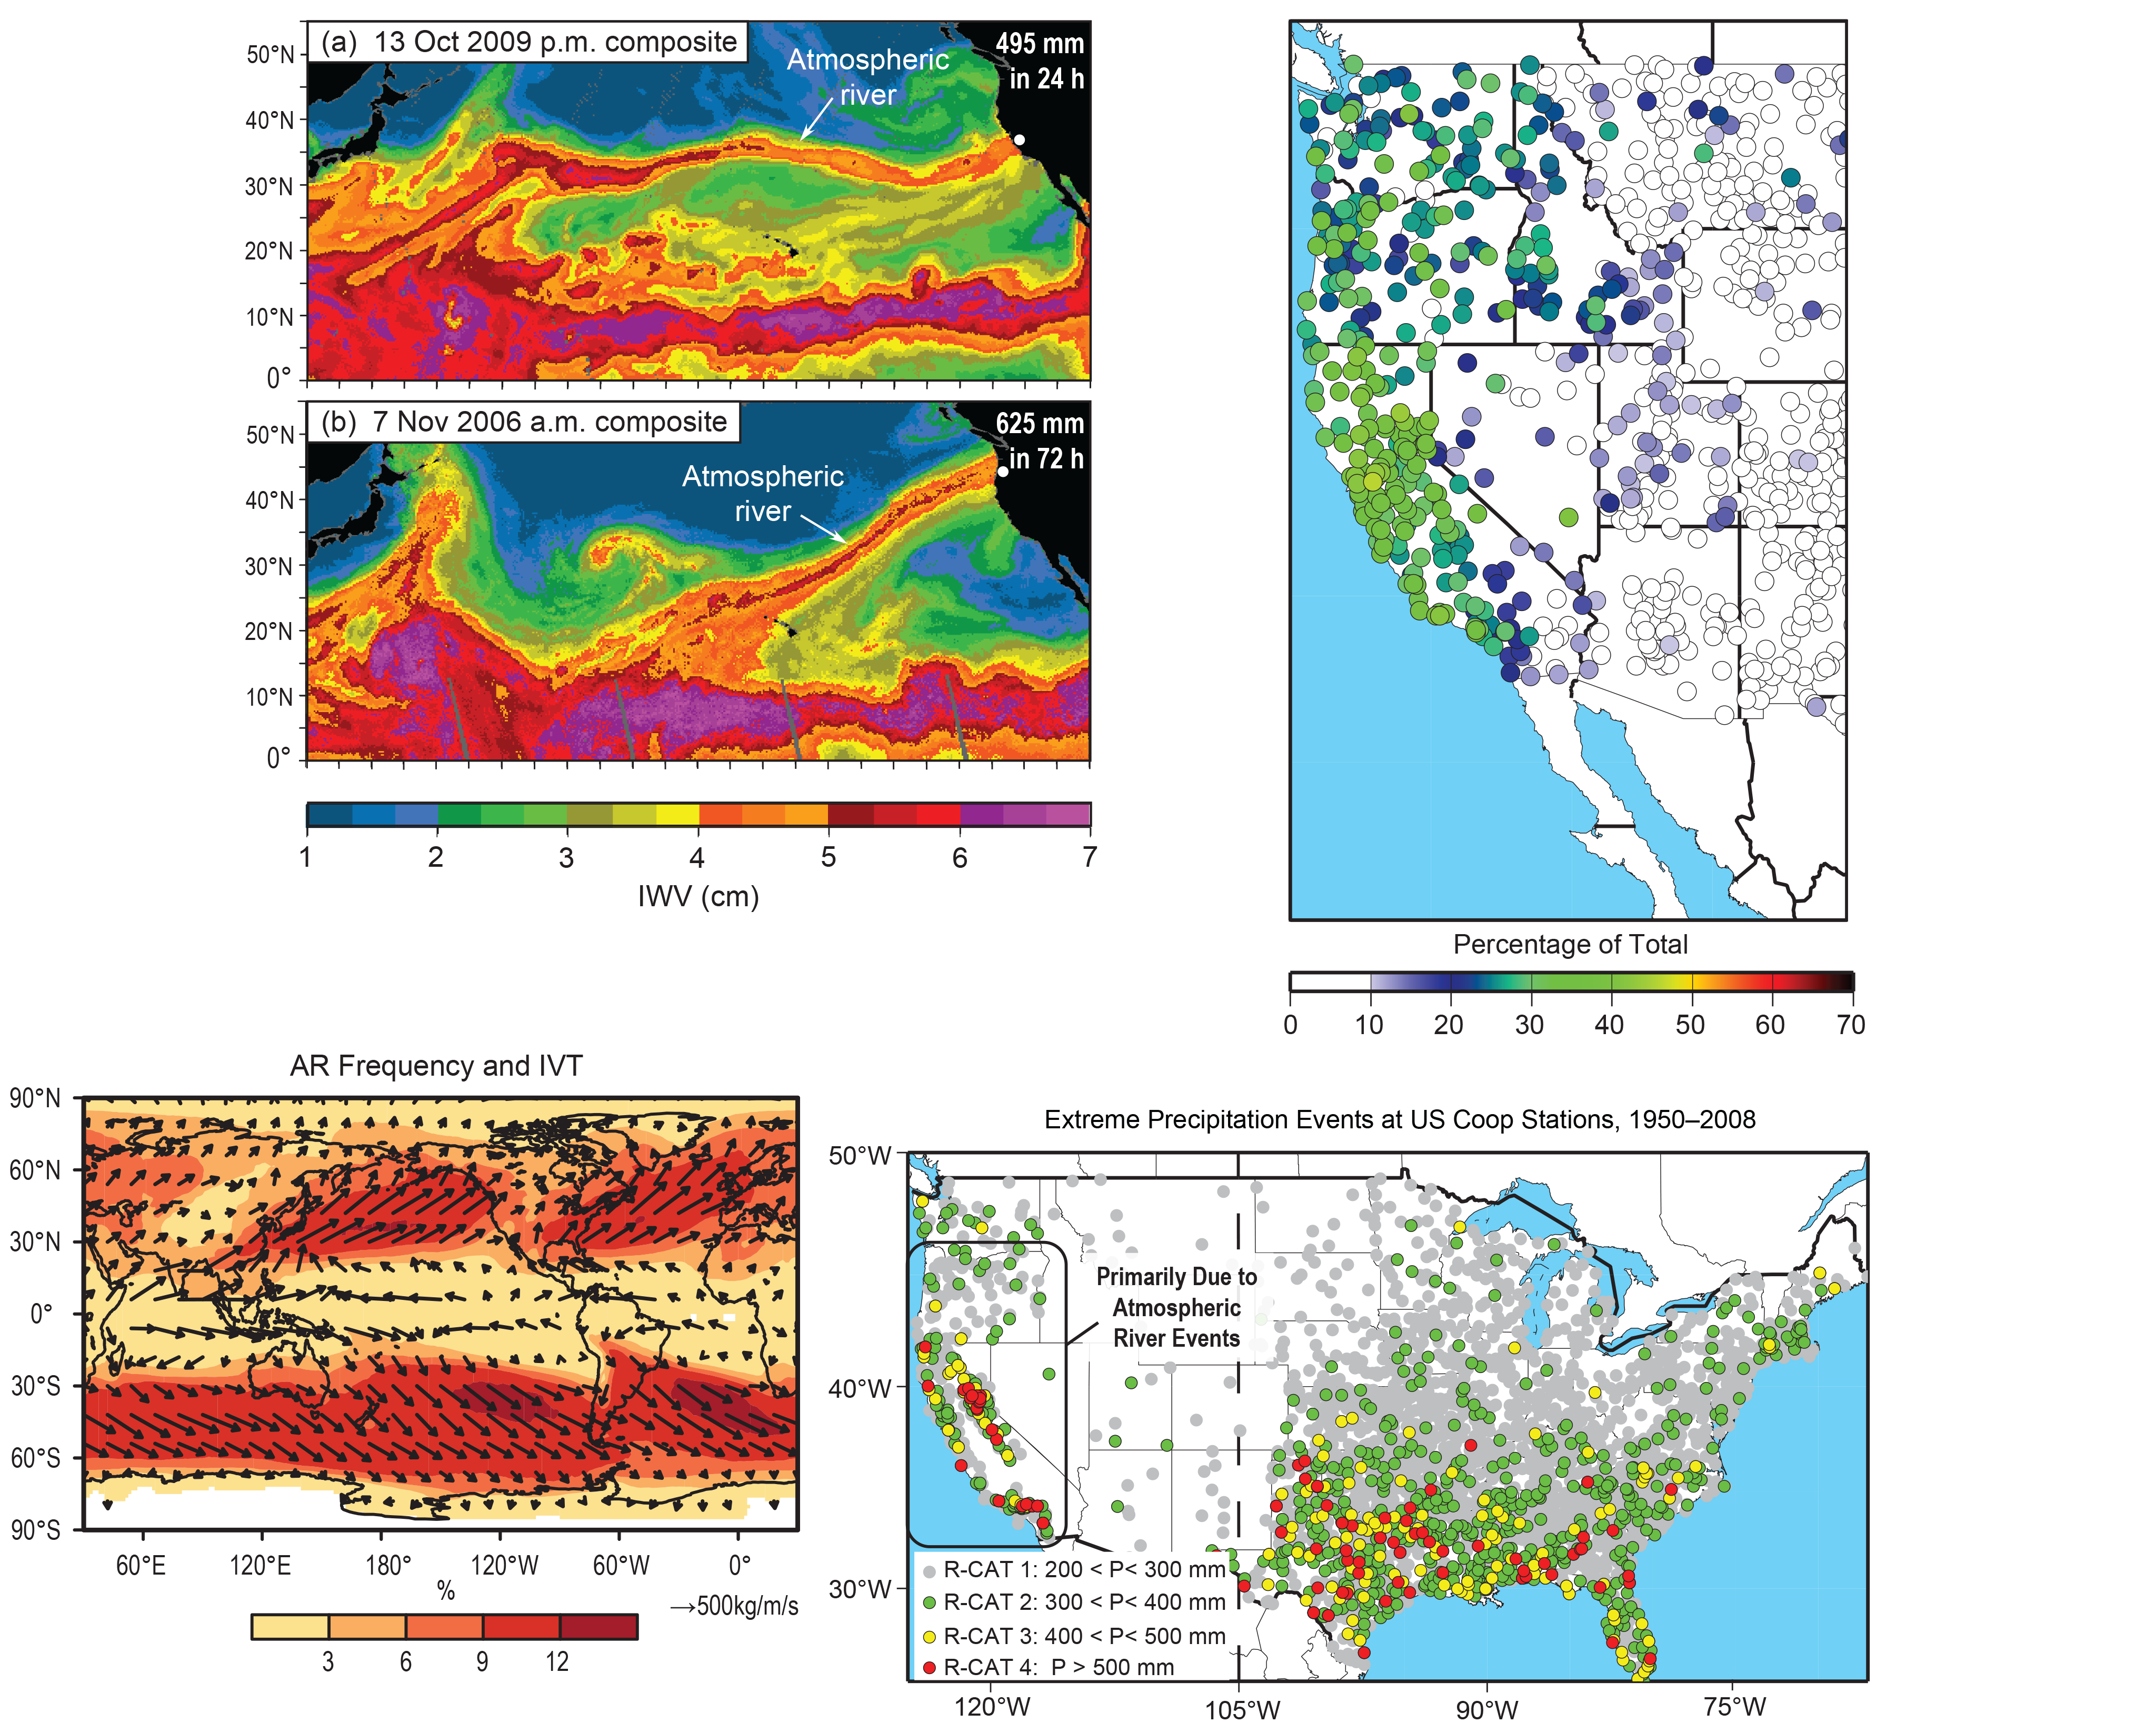
The term “atmospheric rivers” (ARs) refers to the relatively narrow streams of moisture transport that often occur within and across midlatitudes70 (Figure 9.4), in part because they often transport as much water as in the Amazon River.71 While ARs occupy less than 10% of the circumference of Earth at any given time, they account for 90% of the poleward moisture transport across midlatitudes (a more complete discussion of precipitation variability is found in Ch. 7: Precipitation Change). In many regions of the world, they account for a substantial fraction of the precipitation,72 and thus water supply, often delivered in the form of an extreme weather and precipitation event (Figure 9.4). For example, ARs account for 30%–40% of the typical snowpack in the Sierra Nevada mountains and annual precipitation in the U.S. West Coast states73 ,74—an essential summertime source of water for agriculture, consumption, and ecosystem health. However, this vital source of water is also associated with severe flooding—with observational evidence showing a close connection between historically high streamflow events and floods with landfalling AR events—in the west and other sectors of the United States.75 ,76 ,77 More recently, research has also demonstrated that ARs are often found to be critical in ending droughts in the western United States.78
Figure 9.4
(upper left) Atmospheric rivers depicted in Special Sensor Microwave Imager (SSM/I) measurements of SSM/I total column water vapor leading to extreme precipitation events at landfall locations. (middle left) Annual mean frequency of atmospheric river occurrence (for example, 12% means about 1 every 8 days) and their integrated vapor transport (IVT).72
(bottom) ARs are the dominant synoptic storms for the U.S. West Coast in terms of extreme precipitation93 and (right) supply a large fraction of the annual precipitation in the U.S. West Coast states.73
[Figure source: (upper and middle left) Ralph et al. 2011,94 (upper right) Guan and Waliser 2015,72 (lower left) Ralph and Dettinger 2012,93 (lower right) Dettinger et al. 2011;73 left panels, © American Meteorological Society. Used with permission.]
Given the important role that ARs play in the water supply of the western United States and their role in weather and water extremes in the west and occasionally other parts of the United States (e.g., Rutz et al. 201479), it is critical to examine how climate change and the expected intensification of the global water cycle and atmospheric transports (e.g., Held and Soden 2006;80 Lavers et al. 201581) are projected to impact ARs (e.g., Dettinger and Ingram 201382). Under climate change conditions, ARs may be altered in a number of ways, namely their frequency, intensity, duration, and locations. In association with landfalling ARs, any of these would be expected to result in impacts on hazards and water supply given the discussion above. Assessments of ARs in climate change projections for the United States have been undertaken for central California from CMIP3,73 and a number of studies have been done for the West Coast of North America,83 ,84 ,85 ,86 ,87 and these studies have uniformly shown that ARs are likely to become more frequent and intense in the future. For example, one recent study reveals a large increase of AR days along the West Coast by the end of the 21st century under the higher scenario (RCP8.5), with fractional increases between 50% and 600%, depending on the seasons and landfall locations.83Results from these studies (and Lavers et al. 201388 for ARs impacting the United Kingdom) show that these AR changes were predominantly driven by increasing atmospheric specific humidity, with little discernible change in the low-level winds. The higher atmospheric water vapor content in a warmer climate is to be expected because of an increase in saturation water vapor pressure with air temperature (Ch. 2: Physical Drivers of Climate Change). While the thermodynamic effect appears to dominate the climate change impact on ARs, leading to projected increases in ARs, there is evidence for a dynamical effect (that is, location change) related to the projected poleward shift of the subtropical jet that diminished the thermodynamic effect in the southern portion of the West Coast of North America.83
Presently, there is no clear consensus on whether the consistently projected increases in AR frequency and intensity will translate to increased precipitation in California. This is mostly because previous studies did not examine this explicitly and because the model resolution is poor and thus the topography is poorly represented, and the topography is a key aspect of forcing the precipitation out of the systems.89 The evidence for considerable increases in the number and intensity of ARs depends (as do all climate variability studies based on dynamical models) on the model fidelity in representing ARs and their interactions with the global climate/circulation. Additional confidence comes from studies that show qualitatively similar projected increases while also providing evidence that the models represent AR frequency, transports, and spatial distributions relatively well compared to observations.84 ,85 A caveat associated with drawing conclusions from any given study or differences between two is that they typically use different detection methodologies that are typically tailored to a regional setting (cf. Guan and Waliser 201572). Additional research is warranted to examine these storms from a global perspective, with additional and more in-depth, process-oriented diagnostics/metrics. Stepping away from the sensitivities associated with defining atmospheric rivers, one study examined the intensification of the integrated vapor transport (IVT), which is easily and unambiguously defined.81 That study found that for the higher scenario (RCP8.5), multimodel mean IVT and the IVT associated with extremes above 95% percentile increase by 30%–40% in the North Pacific. These results, along with the uniform findings of the studies above examining projected changes in ARs for western North America and the United Kingdom, give high confidence that the frequency of AR storms will increase in association with rising global temperatures.


