TacCoRL: Integrating Tactile Feedback into VLA via Simulation (original) (raw)
Left shows the held-out J4 replay, where gravity compensation caused the largest calibration gap; after SysID, simulation matches real tracking. Right shows aligned tactile distributions from matched rollouts, supporting simulator post-training.
Across all tasks, visuo-tactile policies consistently achieve higher success rates than vision-only policies during simulator RL. This indicates that tactile histories remain useful during on-policy refinement, rather than serving solely as an additional imitation-learning input.
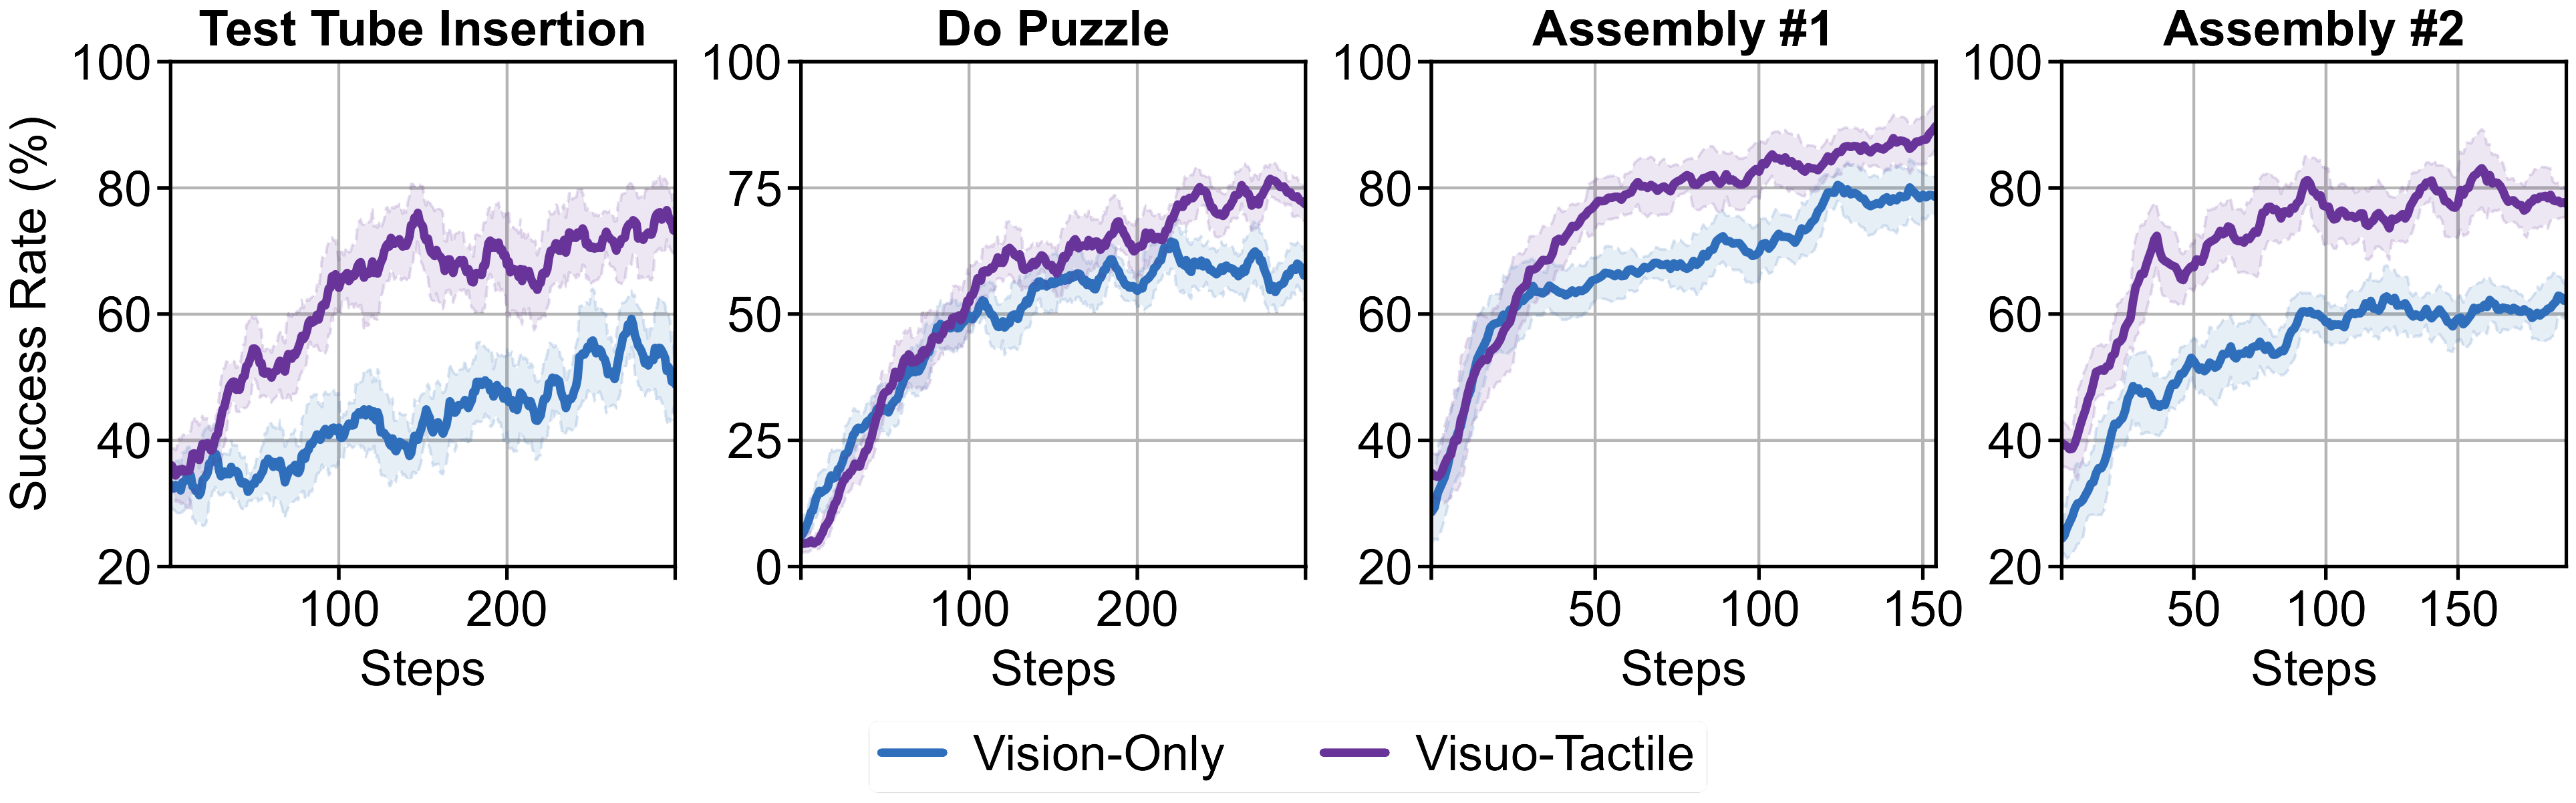
Tactile Feedback Improves Simulator RL
We vary the co-training ratio α and real-anchor weight β on the Assembly #2 task and report model performance in terms of simulator success rate, real-data anchor loss, which measures policy deviation from real demonstrations during simulation, and real-world deployment success rate.
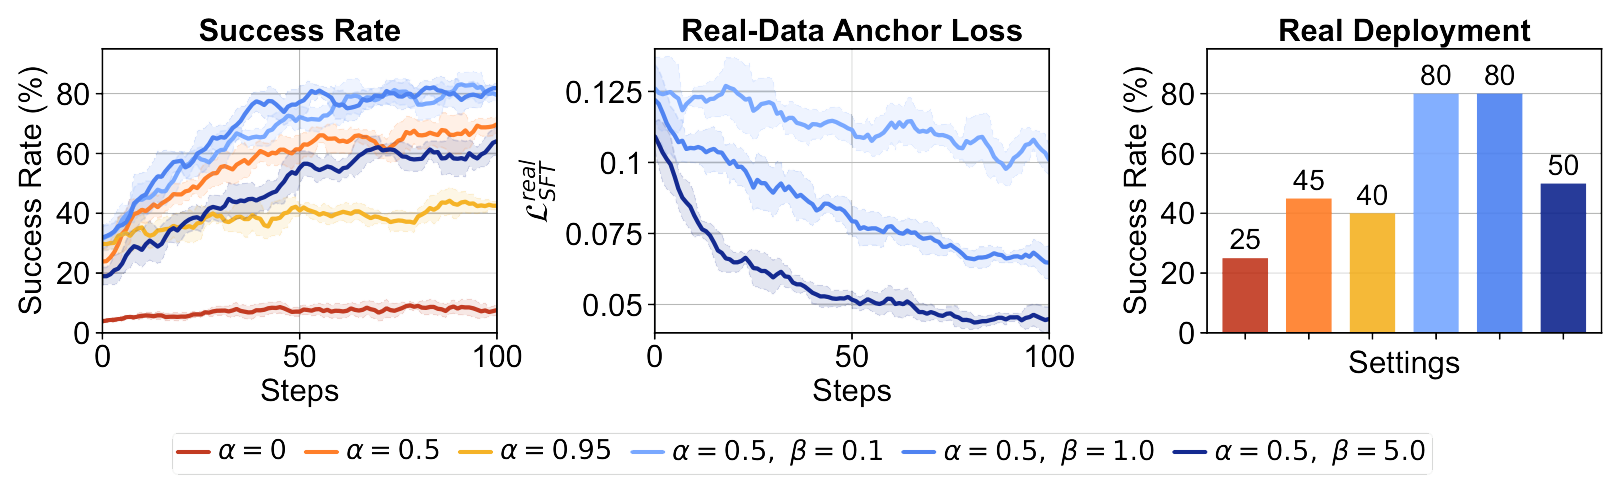
Ablation of Co-Training and Real-Data Anchoring
Direct RL from the base VLA model fails across all tasks. Sim-real co-training provides a strong initialization and substantially improves the success rate for simulator-based RL. Incorporating tactile feedback further improves policy performance.
| Settings | Vision-Only | Visuo-Tactile | ||||||
|---|---|---|---|---|---|---|---|---|
| Tube | Puzzle | Asm. #1 | Asm. #2 | Tube | Puzzle | Asm. #1 | Asm. #2 | |
| After Co-Training | 42% | 12% | 39% | 39% | 41% | 16% | 47% | 58% |
| RL Start with Exploration Noise | 35% | 5% | 25% | 25% | 36% | 4% | 35% | 42% |
| RL from Base VLA | 0% | 0% | 0% | 0% | 0% | 0% | 0% | 0% |
| RL with Co-Training | 50% | 54% | 77% | 61% | 72% | 71% | 92% | 79% |
Simulation Success Rates
Rows compare training stages; columns compare vision-only and visuo-tactile policies. Tactile feedback and RL post-training together achieve the highest real-world success rates.
| Training Stage | Vision-Only | Visuo-Tactile | ||||||
|---|---|---|---|---|---|---|---|---|
| Tube | Puzzle | Asm. #1 | Asm. #2 | Tube | Puzzle | Asm. #1 | Asm. #2 | |
| Real-Only Fine-Tuning | 20% | 5% | 35% | 25% | 45% | 15% | 35% | 40% |
| Sim-Real Co-Training | 35% | 10% | 40% | 35% | 50% | 25% | 45% | 55% |
| RL Post-Training | 35% | 25% | 80% | 60% | 70% | 45% | 95% | 80% |