Image library - Understanding Science (original) (raw)

Found 181 images:

Chart showing evidence of CFCs causing ozone depletion.

Diagram showing "the core of science." Concepts such as hypothesis, expected results/observatiosn, and actual results/observations.

Benefits and outcomes, another part of the Understanding Science Flowchart.

Community analysis and feedback portion of the Understanding Science Flowchart

Second part of Understanding Science flowchart: Testing ideas.

Beginning of the Understanding Flowchart: Exploration and discovery

Image of one lightbulb symbolizing ideas versus several lightbulbs together.

Scientific theories as puzzle pieces.

Example of evolutionary tree showing red feathers evolving twice is less preferable to evolving once on an evolutionary tree.

Image showing force of gravity applied to both apples and atoms.

Image of vague information against a thermometer and measurements.

Graph of ozone depleting as chlorine monoxide increases.

Map of Chicxulub impact crater on the Yucatan Peninsula.

All items crossed out on list of Scientist's code of conduct.

A scientist's code of conduct: Despite the evidence against it, Pons and Fleischmann refused to give up the idea that they had produced cold fusion.

Scientist's code of conduct: Pons and Fleischmann refused to let other scientist search of fusion products in their cell.

Scientist's code of conduct list at Openly communicate ideas and tests to others.

A Scientist's code of conduct with 2. Expose your ideas to testing

A listing of a scientists code of conduct.

Atomic model of solar radiation freeing up chlorine atom.

Atomic model of trichlorofluoromethane.

DNA molecules look the same upside down, or backwards.

DNA symmetry II

Watson and Crick realize that since DNA crystals could be flipped upside down and backwards, and still look the same.
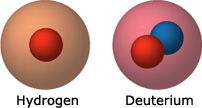
View details »

Diagram of pencils in pairs, one is flipped the other direction. Each pair is then flipped again

Cartoon of three scientists, one disagrees but the other two remind them to stick to the data.

Three scientists of different backgrounds discussing new research.

Cartoon of a woman at a chalkboard, a naturalist looking through binoculars, and scientist studying beetles in a lab.

Hydrogen atom versus deuterium atom which has both a proton and neutron

Deuterium

A hydrogen atom has only a single proton in its nucleus, whereas deuterium, a rarer isotope of hydrogen, has a proton and a neutron.

View details »

Drawing showing flow of analyzing DNA base pairs leading to sharing data with scientific community.

Graph with several spikes denoting high number of extinctions during KT event.

Extinctions

Percentage of organisms that have gone extinct over the past 200 million years, based on the fossil record.

View details »

Cartoon of a deeps diver and an octopus with arrow pointing to a magazine, then pointing to the image on TV show.

Drawing of woman with tan skin reading a magazine entitled "Climate"

Image showing

Even theories change (4 of 4)

General relativity seems up for a change. For example, it doesn't mesh with what we know about the interactions between extremely tiny particles. Will physicists develop a new theory that…

View details »

Diagram of baseball, Earth, Moon and electric and magnetic forces, and a person on a rocket showing special relativity.

Drawings showcasing the presence of theory of relativity

Drawing of a baseball next to image of the Moon and Earth

Even theories change (1 of 4)

Science is always a work in progress and even theories change. For example, in the 1600s classical mechanics was the accepted explanation of the movement of objects both in space…

View details »

Photo of Ernest Rutherford

Bacterias experiencing multiple instances of endosymbiosis

Comparison of two evolutionary trees hypothesizing origins of endosymbiosis.

Evolutionary tree showing plastids and mitochondria jumping to eukaryotes.

Heat maps of growing hole in ozone.

World map marking localities of iridium spikes.

Chart of evidence supporting hypothesis that CFCs will cause significant ozone depletion"

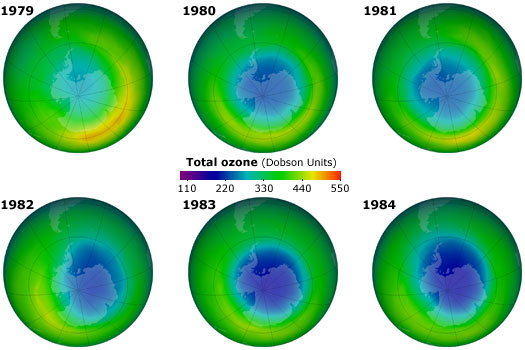
Hypothesis of ozone depletion

Molina and Rowland's over-arching hypothesis (that releasing CFCs into the atmosphere would cause significant ozone depletion) was based on many supporting hypotheses, backed by their own lines of evidence.

View details »

Atomic model of DNA bases

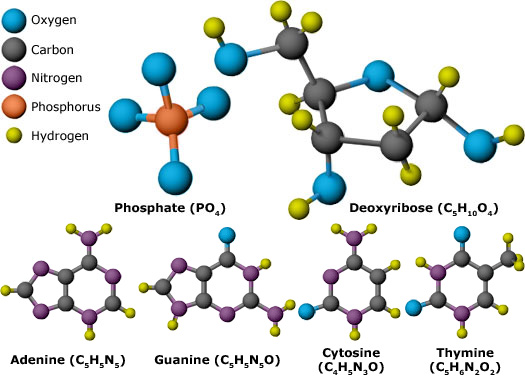
How the base pairs match up

Students are given six knowledge statements and asked to rank them according to how scientific they feel the statements are. A group discussion ensues. This activity is adapted from Scharmann…

View details »

Composite image of aerosol cans, a refrigerator, and styrofoam.

Cartoon of a skydiver with speech bubble saying, "I'm not deploying my parachute until scientists get more certain about this gravity stuff."

Iridium graph

Cartoon of two scientists talking about a how much can happen in scientific process.

flowchart showing the discovery of Image B 51 leading to DNA being in a stacked formation and helix.

Image B 51

Franklin and Gosling's image confirmed the idea that DNA was helical in shape and that its bases were stacked pancake-style.

View details »

Photo of Ignaz Semmelweis.

DNA helix as a completed puzzle.

Flat atomic model of DNA bases as a puzzle piece.

Two puzzle pieces being added to a more and more complete puzzle of DNA.

Puzzle piece of atomic orientation arrows

Phosphate placement on the DNA model as a puzzle piece. Below, the puzzle is slowing being put together.

Water molecules as a puzzle piece.

DNA as a puzzle piece.

DNA bases as puzzle pieces.

Heredity tree as a puzzle piece.

Comparing prokaryotic and eukaryotic cells.

Steps in formation of deuterium fusion reaction.

Flowchart showing cycle of peer review process.

Peer review

Peer review of a scientific study submitted for publication provides assurance that someone who knows what they're doing has double-checked it.

View details »

Graph of Chlorine and CFCs rise and start to decline after CFC ban.

Ozone levels fluctuate so widely that it is difficult to detect subtle trends over a short-term period, as shown by these ozone measurements for the atmosphere over Switzerland taken between 1926 and 1975.

Ozone fluctuation

Ozone levels fluctuate so widely that it is difficult to detect subtle trends over a short-term period, as shown by these ozone measurements for the atmosphere over Switzerland taken between…

View details »

A graph showing world production of three major CFC types between 1970 and 1988. The dot marks the year (1977) that the US phaseout of CFCs was announced.

Graphic showing mitochondrial DNA following maternal lineage.

Nuclear vs. mitochondrial DNA

Unlike nuclear DNA (left), mitochondrial DNA is only inherited from the maternal lineage (right) - a quirk which allowed Margulis to determine whether mitochondrial DNA encoded unique traits.
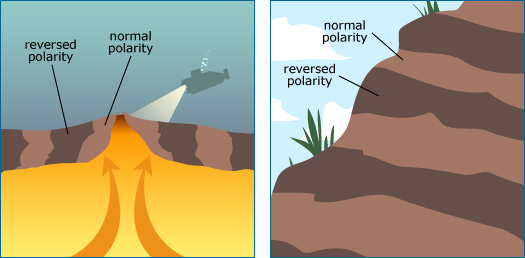
View details »

Chart showing decline in ozone in northern hemisphere.

Photo of Niels Bohr.

Chart showing many hypotheses to explain major extinction during the Cretaceous.

Atomic model of Nitrogen dioxide and oxygen making Chlorine nitrate.

Atomic model of DNA bases.

Image of a person caught trying to delete files.

Image of a person throwing away a bad Petri dish result.

The word "wrong" stamped over exaggerated cartoon of scientist saying, "Finally done with the firs two steps of The Scientific Method

Graphs comparing equation based model versus actual rabbit populations.

Math equations describe rabbit/wolf relationship. X equals rabbits, and Y equals wolves.

Image comparing growth on Petri dishes, one with a substance and one with only growth media. Petri dishes look the same.

Drawing of Petri dishes, growth medium and two substances.

Image comparing placement of rock layers under water to exposed outcrop on mountain side.

Magnetic flip-flops

As new seafloor forms, the igneous rock records the current state of the Earth's magnetic field. Sedimentary rock layers forming at the bottom of the ocean may also record these…

View details »

Image of senior citizen with thought bubble containing Zeus and Ganesha.

A person with red hair in a bun with a thought bubble containing a DNA strand, a rat, and an apple circling a dollar sign.

Image of a tan skin person with a mustache and thought bubble containing a violin and portrait of the Mona Lisa.

A cartoon of a person with glasses and long black hair with a thought bubble, with image of scale weight good and bad inside.

Diagram showing x-ray passing through a lead screen, crystalline solid, photographic plate showing spots of diffracted x-rays.

Early but erroneous atomic model of DNA bases

Image suggesting that endosymbiosis doesn't fit within current framework of evolutionary theory.

cartoon of a man holding a bottle and woman reading newspaper both thinking "Hmm... where's the science here?"

Untangling media messages

Media representations of science and science-related policy are essential for quickly communicating scientific messages to the broad public; however, some important parts of the scientific message can easily get lost…

View details »

Listed examples of scientific misconduct.

Map of Europe highlighting the cities Gubbio, Italy and Stevns Klint, Denmark.

Chart showing two possible explanations on h ow clay was deposited during KT boundary.

Two evolutionary trees showing different hypothesis of how circular shape plasmid evolved in the cell.

Two sided illustration. One side shows two scientists in front of chalkboard shaking hands. The other side shows the same scientists in front of nuclear power plant, one holds a "yes" and the other holds a "no." sign.

Protestors at the National Mall holding opposing signs that say "No STEM cell research" and "Save lives with STEM Cells"

Two scientist holding clipboards with different evolutionary trees looking at fossil in an outcrop

People talking animatedly in front of a chalkboard

computer graphic models of Thymine and Guanine

Thymine and guanine

The visiting American chemist, Jerry Donohue, provided a key piece of evidence when he revealed that the forms given for thymine and guanine in most textbooks were wrong. Note the…

View details »

A chart showing hypothesis of supernova causing extinctions. Expected observations show Iridium concentration of 3 atom per billion and that's what is observed.

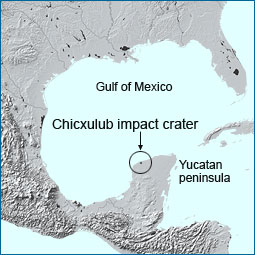
The supernova hypothesis

An existing hypothesis proposed that a supernova at the end of the Cretaceous had caused the extinction of dinosaurs. Supernovas throw off heavy elements like iridium - so the hypothesis…

View details »

List of questions

Diagram of Earth's atmosphere showing ozone layer stopping out much of the UV radiation.

Chart showing hypothesis of clay deposited thousands of ears ago and observation of 0.1 atoms per billion in clay. We actually see 3 atoms. A large jump.

Cross section of earth magma layers showing direction of heat flow causing movement of tectonic plates.

A satelite in space above earth showing African continent

Evolutionary tree comparing South American and African species sharing a common ancestor.

Comparison of cross section of geological rock layers in South America and Africa. They are similar.

Map showing South America and Africa migrating apart.

Map showing South America and Africa both with similar primate skulls superimposed on top.

Diagram of cold fusion cell with wavy red arrows signifying release of heat to be measured.

A technical drawing of cold fusion cell published

Diagram of "fusion cell." Two rods of palladium in a water bath connected to a battery.

Evolutionary tree showing plastids, tubules, and mitochondria jumping to eukaryotes branch from bacteria branch.

Image charts out hypothesis of asteroid striking the earth as reasons for high iridium and no plutonium, not sure why a major extinction occurred.

The chart has two areas highlighted: "Organelles reproduce and are passed from parent to offspring." and "Organelle has genetic material."

A highlighted part of the chart "Organelles have close free-living bacterial relatives" has promising results.

In a grid, marking possible origins of endosymbiosis of different organelles in the cell.

Shows different expectations on endosymbiotic

A supernova occurred at the K-T boundary. Expect to see plutonium-244 but was not found in sediment sample.

Testing the supernova hypothesis

To further test the supernova hypothesis:If a supernova had occurred, it would have also released plutonium-244 as well as iridium. Original tests looked positive but replicating the analysis showed that…

View details »

As cold fusion takes place, we expect to see neutrons released, however none are released.

The expected observation of elevated helium-4 levels was not actually observed.

The evidence of cold fusion leads a question mark about what will be observed.

Comparing different results of Pon's and Jone's work on cold fusion.

Expected observations of behavior of atoms in palladium

Top row with phrases in green bubbles correspond to image below. First column "Hypothesis/theory" with an image of D particles inside a palladium rod and “Cold fusion is taking place in the palladium”. The next column shows “Expected results/observations” with a thermometer at a high heat. “We expect to see heat generated.” In the next column, we see “equal to or not equal” to “Actual results/ observations” which shows the same.

Top row with phrases in green bubbles correspond to image below. First column "Hypothesis/theory" with an image of an aerosol can surrounded by Ozone molecules. The next column shows “Expected results/observations” with Chlorine monoxide atom. “ Chlorine should be present in the upper atmosphere.” In the next column, we see “equal to or not equal” to “Actual results/ observations” which shows a a large question mark.

Top row with phrases in green bubbles correspond to image below. First column "Hypothesis/theory" with an image of an aerosol can surrounded by Ozone molecules. The next column shows “Expected results/observations” with CFCs floating at the bottom of image. “If CFCs are destroyed in the upper atmosphere then more CFCs will be present at altitudes.” In the next column, we see “equal to or not equal” to “Actual results/ observations” which shows a graph of CFC concentration versus altitude and the trend line sharply declines.

Top row with phrases in green bubbles correspond to image below. First column "Hypothesis/theory" with an image of an aerosol can surrounded by Ozone molecules. The next column shows “Expected results/observations” with a large question mark below it. In the next column, we see “equal to or not equal” to “Actual results/ observations” which is on top of another question mark.

Showing hypothesis of organelle endosymbiosis in cells. Hypothesis is "Some organelle evolved via symbiosis." The next column shows an evolutionary tree with bacteria on one branch and organelle on another. This leads to a big question mark.

Two rows of phrases encapsulated in green bubbles. The first for says "Expected results/observations" equals "Actual results/observations" then an arrow leads to "Lends support." The second row of green bubbles says "Expected results/observations" not equal to "Actual results/observations" pointing to "Helps refute."

Testing scientific ideas

Scientific testing occurs in two logical steps: (1) if the idea is correct, what would we expect to see, and (2) does that expectation match what we actually observe? Ideas…

View details »

Two images showing different hypothesis of atoll formation. The left shows a peak underwater with only a thin portion at the top as coral. The image on the left, a majority of the peak is coral.

Top down view of atoll Eniwetok. Shows ring land with water surrounding and in the center.

A maze for rats has many dead end paths and only one that leads to cheese. A dotted line leads to a dead end. Caption says, "When the tunnel to the reward is blocked the rats follow their mental map and choose the tunnel that leads in the direction where they know the reward to be."

Testing an idea (3 of 3)

When the entrance to the reward tunnel was blocked, most of the rats picked a tunnel that led in the direction of the food, supporting the idea that rats navigate…

View details »

Image of many pathways but only one goes to cheese. Caption says "First the rates learn to follow the tunnel that leads to the reward."

Testing an idea (2 of 3)

Tolman and his colleagues trained rats in a maze which offered them many different tunnels to enter first. One of the tunnels twisted and turned but consistently led to the…

View details »

Drawing of a mouse imagining the pathway through a maze to cheese

Testing an idea (1 of 3)

Psychologist Edward Tolman wanted to know how rats successfully navigate their surroundings - for example, a maze containing a hidden reward. Would they build mental maps of the maze as…

View details »

A set of three images. The first shows an hypothesis model of an atom depicted by a circle with plus and minus signs. The second expected result/observation shows alpha particles passing through a gold foil. The third actual result/observation shows that some alpha particles bounce back.

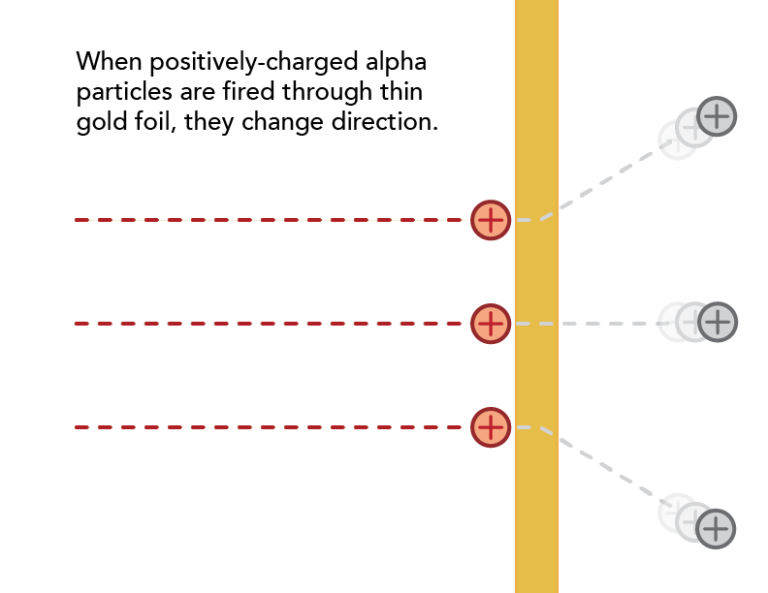
Rutherford’s argument (1 of 2)

In the early 1900s, Ernest Rutherford and his colleagues performed this experiment to test the hypothesis that an atom's mass and positive charge are spread diffusely throughout the atom and…

View details »

Three images in succession detailing Rutherfords hypothesis. First the hypothesis shows a hydrogen atom. Next the expectation is that some alpha particles bounce back the way they come when sprayed into a gold foil. Last, the actual result shows some alpha particles bounce back the way they came.

Two images comparing if birds songs are genetically encoded, or learned.

Testable ideas

A scientific idea may require a lot of reasoning to work out an appropriate test, but to be scientific, an idea must be testable.

View details »

Image formatted in a grid to show examples following parts of scientific hypothesis in studying plants, atoms and earth science. Top row shows a word in an equation “Hypothesis/theory” with an arrow leading to “expected results/observations” is equal or not equal to “actual results/observations.” Second row of grid an image of a leaf stoma, next the leaf is under the microscope and the result is the same as the first leaf stoma. The second row has 3 images. First, an image of an atom, leading to the next image of a particle bouncing off an illustration of gold foil. The third image shows the same image. The last row shows world map during the early during the cretaceous, when land was not separated by the ocean. This image points to current world map. South America has a skull super imposed, as well as Africa. The last image, the result, is the same as the second.

Summing up scientific arguments

Scientific arguments are formed by figuring out what we would expect to observe if a particular idea were true and then checking those expectations against what we actually observe. A…
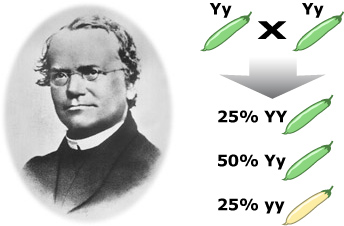
View details »

Image of screenshot from CDC.gov website. Areas are highlighted to show legitimacy of information.

Image advertising the benefits of "carrot oil" as a cure for baldness. However, the ad looks suspect.

cartoon image of a person searching for scientific information on the internet while also holding open a scientific journal.

A figure looks at an evolutionary tree of butterflies imposed over map and observes. They say , " Hmm.. evolutionary theory suggests other interesting questions to investigate. What other species are these butterflies closely related to? How might these species evolve in response to global warming?"

On a snowy slope, the hybrid butterfly is flying. Next to it is a thermometer showing a high temperature. On the snow sits the lowland butterfly, it's temperature is low. The figure makes an observation "Hmm... the alpine butterflies are darker than species at lower elevation which could be caused by natural selection for heat absorption. If this theory applies, I'd expect coloration to affect the butterflie's body temperature."

A figure looks at three mountain peaks. Each peak has a snowcap. Two peaks have a butterfly below the snow, and the one in the middle has one in the snow. Each with a unique pattern, though the middle one has characteristics of both. The figure says "Hmm... based on what I know about speciation and other examples like this. I'd hypothesize that the alpine species is a hybrid between two species from lower elevations."

Two figures talking, one is holding a bag with a money symbol. The other has a speech bubble that says "I can't accept this funding. It would be a conflict of interest."

A figure writing on a note. In a speech bubble, they say "My colleagues deserve recognition for their work on this project."

A figure looking at a failed experiment says "That didn't work as expected, but it's an important finding and I need to report it honestly."

Three figures looking at a blackboard, one is asking "Could you explain this part more?"

a comic divided into four quadrants. Top right shows a person with glasses on the phone. Top left shows a person sitting on the ground with a laptop in the desert. The bottom left shows a scientist studying a fish fossil. The bottom left shows a person with braids studying a whiteboard with an evolutionary tree drawn on it.

Circle split into 3 pie shape. One shape shows a girl coming up with an idea, the next she is looking through a microscope making observations, and the last she is writing on a white board. This last pie is labeled expectations.

The following words are encapsulated in green bubbles and formatted into a math equation: "scientific idea" + "expectations" + "observations" = "scientific argument"

A cartoon showing eight individuals of various cultures including a cowboy, a diver and an astronaut depicting diversity in science.

A yellow note with black text titled Science Checklist. The first check box is checked with a red check mark.

Several circles that contain different parts of science are connected to each other in a long scrolling image.

Right side shows Rutherford's model of the atom with a star pattern, left shows Bohr's model of the atom with concentric circles.

Close up of pathway of alpha particles colliding with positive charge of atoms in the gold foil.

Path of alpha particles fired through gold foil. Gold foil shows plus and minus signs depicting positive and negative charges of other particles in the foil.

Cartoon of scientist in a lecture hall giving a talk. A spotlight shines on them as they speak into the microphone.

A researcher with long blond hair and green shirt examines a lower jaw bone through a magnifying glass. Image of their eye is enlarged in the magnifying glass.

Cartoon of collaborators talking with speech bubble pointing to both with a lightbulb

Cartoon of a scientist editing and marking up papers with a red pen.

Gregor Mendel on left and genotypes of pea plant offsprings on the right.

Revisiting Mendel

Gregor Mendel (left) showed that if you know the genotypes of the parents in a cross, you can predict the ratios of different offspring genotypes (right).

View details »

Cartoon of scientists finding repeatable results in their experiment consisting of weight a flash with purple substance both weighing exactly 352 grams.

Dotted arrows overlayed on top of Science Flowchart, explaining paths taken in understanding science.

Question "How traits are inherited?" followed by arrows to scientific facts. Fading as more relationships shown.

Science flow chart

Building a scientific argument – cartoon 1

Scientific arguments involve three components: the idea (a hypothesis or theory), the expectations generated by that idea (frequently called predictions), and the actual observations relevant to those expectations (the evidence).

View details »

Behaving scientifically

Science is open to anyone and benefits tremendously from the expanding diversity of perspectives. However, science only works because the people involved with it behave "scientifically."

View details »

Illustration of scientists from the past to present.