9 Feature Adoption Metrics to Track + How To Improve Them (original) (raw)
What are feature adoption metrics?
Feature adoption metrics are KPIs that measure how well users are embracing your product’s features.
These metrics come in various categories, depending on what you need to measure. For example, activation rate and time-to-adopt help you track engagement early in the user journey. Meanwhile, breadth and depth of adoption indicate user investment in your product and their likelihood of continued use (more on these later).
Why are feature adoption metrics important?
From CAC to monthly retention rates, your product team already has many metrics to track, so why add feature adoption to the list? Here are four primary reasons why adoption metrics matter:
- See the “Big Picture”**:** Feature adoption metrics don’t just show you what’s happening, they help you understand how it’s all connected. For example, by analyzing feature adoption trends, you might discover that a recent UI change led to a significant increase in user engagement with a previously underutilized feature.
- Measure product success: Instead of relying on intuition or anecdotal feedback, you can use feature adoption data to track customer progress, compare the performance of different features, and identify which ones resonate most with users.
- Increase customer satisfaction: Adoption metrics help you understand what frustrates and delights users. Armed with this information, you can make targeted improvements to address common pain points and boost customer satisfaction.
- Inform product development: Struggling to optimize your product roadmap? Feature adoption data provides invaluable clues for deciding which features to prioritize, iterate on, and sunset. For example, imagine discovering that your power users are flocking to a feature designed for beginners. This unexpected trend might reveal an opportunity to revamp the feature or create a more advanced version tailored to their needs.
How do you measure feature adoption?
Here’s a simple way to do it:
Divide the monthly active users of that feature by the number of user logins in the same period and multiply by 100.
For example, let’s say your product had 500 user logins this month, and 200 of those logins used your new “Analytics dashboard” feature. Your monthly feature adoption rate will be 40% (200/500 X 100).
Of course, this is a hypothetical example, but if you’re wondering what a good feature adoption rate it is, we found the average for core features to be 24.5%.
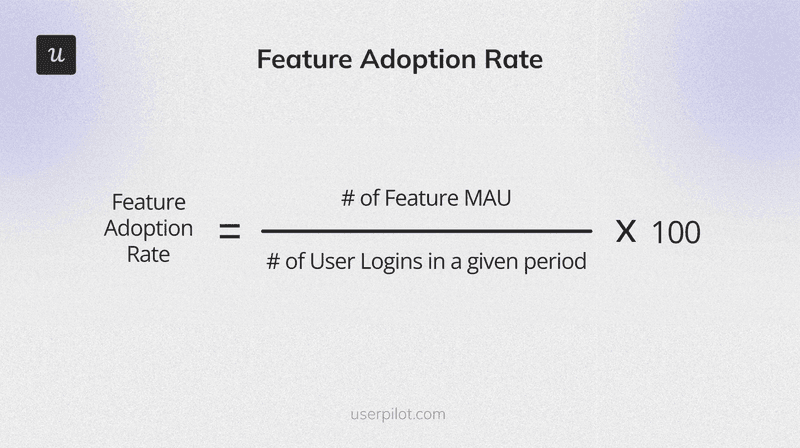
How to calculate the feature adoption rate.
Why are feature adoption metrics critical for product success?
They only track how many times a user logs in
They reveal how well users are embracing specific functionalities, not just general product usage
They are used exclusively for calculating monthly revenue
Which metric measures the delay between a user becoming aware of a feature and actually using it?
Time-to-Value (TTV)
Time-to-Adopt
Session Duration
What does “Breadth of Adoption” specifically track?
How often a single feature is used by one person
The number of different features a user adopts across the entire product
The percentage of users who have churned
Optimize your adoption strategy with Userpilot.
Track every interaction, identify bottlenecks, and drive feature success without code.
9 key feature adoption metrics to track for SaaS companies
Ready to start measuring feature adoption for your SaaS? This section will cover 9 of the most important metrics:
1. Activation rate
The activation rate measures the percentage of new users who complete a set of actions that demonstrate they’ve experienced your feature’s core value. For example, activation events for a time-tracking tool might include creating a project, starting a timer for a task, or generating a report.
How to calculate: Divide the number of users who used the feature by the total number of users in that group (e.g., total new users) and multiply by 100.
High activation rates suggest a successful onboarding process and a clear value proposition. In the same way, low activation often signals a need to improve your onboarding flow.
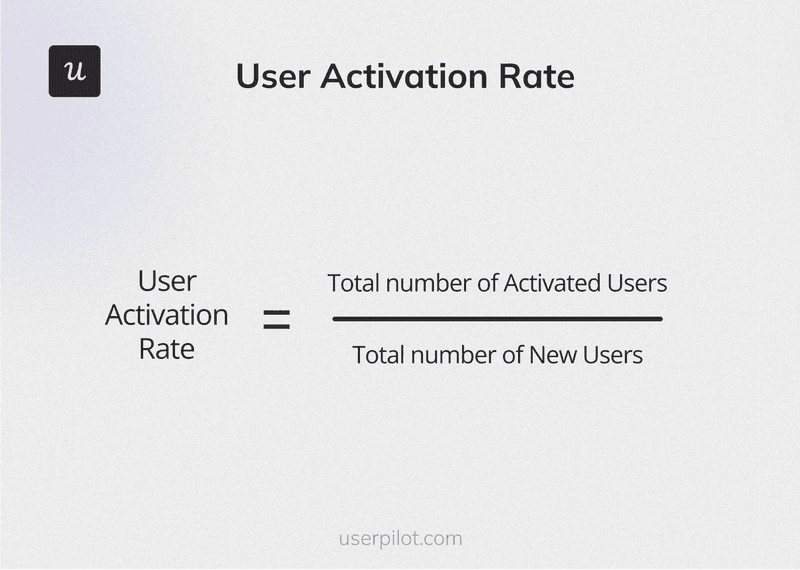
How to calculate feature activation rate.
2. Time-to-adopt
Time-to-adopt measures how long it takes a user to start actively using a specific feature after becoming aware of it.
How to calculate: Subtract the timestamp of the first interaction from the timestamp of the adoption event.
Let’s say you want to measure the time-to-adopt to a new “reporting dashboard” feature in your CRM software. Here’s what the steps will look like:
- Identify the “awareness event”: Define the event that signifies a user’s first exposure to the feature—e.g., seeing a feature announcement or engaging with a new user onboarding flow.
- Adoption event: Log into your analytics tool and define “adoption” as the user creating their first custom report in the dashboard
- Track actions: Track the time the user receives the notification and the time they create their first custom report.
- Calculate difference: For each user, calculate the difference between these two timestamps to determine their individual time-to-adopt.
- Analyze data: Calculate the average time-to-adopt across all users and segment the data to identify any trends or outliers.
This metric helps you understand how quickly users recognize a feature’s value and incorporate it into their workflow. Consistently long time-to-adopt often means poor feature discoverability or a lack of perceived value.
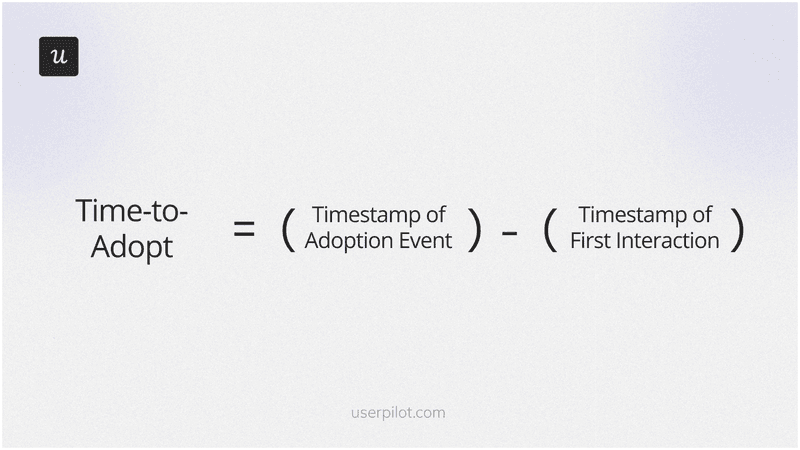
How to calculate the time-to-adopt metric.
3. Active users
The active user metric tracks how many users actively engage with a feature within a defined period.
How to calculate:
- Define what constitutes an “active feature user” based on your product’s specific context: For example, if you’re a social media scheduling tool, you might decide that someone isn’t an active user of your bulk scheduling feature until they’ve used it to schedule at least five posts at once within the past month.
- Choose a timeframe: Select a relevant timeframe for measurement (the most commonly used timeframes when tracking feature adoption metrics are daily, weekly, or monthly).
- Track user actions: Use your analytics platform to track the number of unique users who perform the specified actions within a chosen timeframe.
An increasing number of active users is a positive sign that your feature is attracting and retaining users.
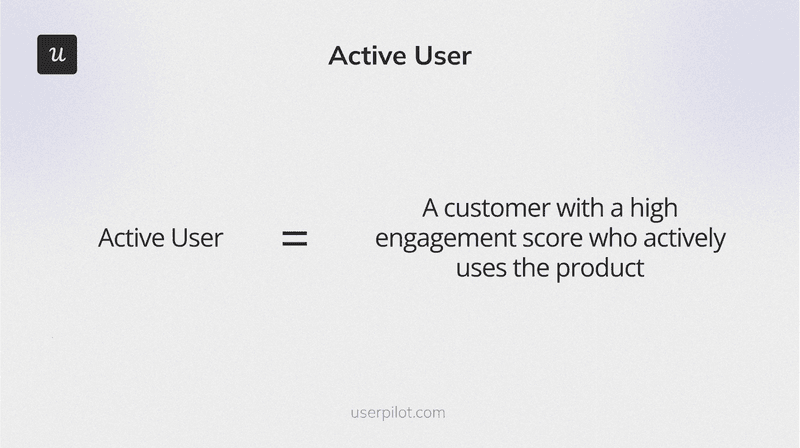
How to define an active user.
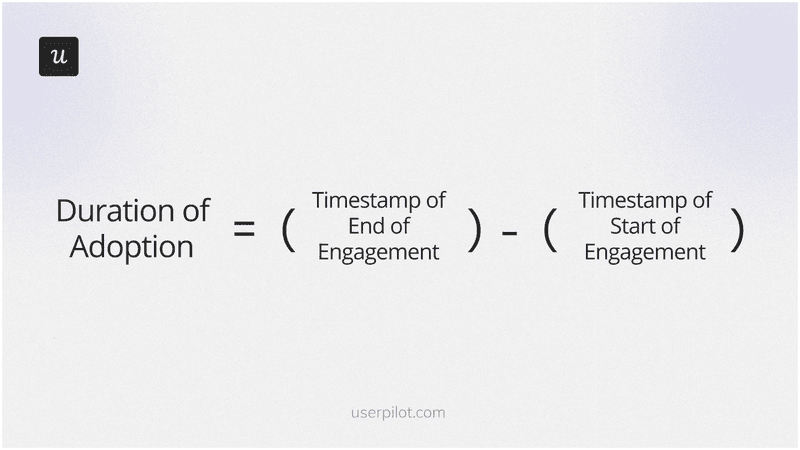
4. Duration of adoption
It’s one thing to adopt a feature, but using it consistently over an extended period is a different ball game. The duration of the adoption metric measures how long existing users actively engage with a feature after they initially adopt it.
How to calculate:
- Define “active engagement”: Clearly define what active engagement means for that feature. This could be based on specific actions (e.g., number of times a button is clicked, time spent within a specific module), milestones within the feature, or a combination of factors.
- Track user sessions: Use a product analytics tool like Userpilot to track the start and end times of user sessions within the feature.
- Use this formula: Duration of Adoption = (timestamp of the end of engagement) – (timestamp of the start of engagement). You can also calculate the average duration of adoption by summing the individual durations for all users and dividing by the number of users.
Short-lived adoption suggests a feature may have initial appeal but fails to deliver lasting value. For example, if 80% of users try a new feature immediately after launch, but only 15% are still using it six months later, that’s a clear sign to investigate why.
To do this, you could survey—or even interview—some of the users who stopped engaging. Then, find the core issues and improve.
Duration-of-adoption.
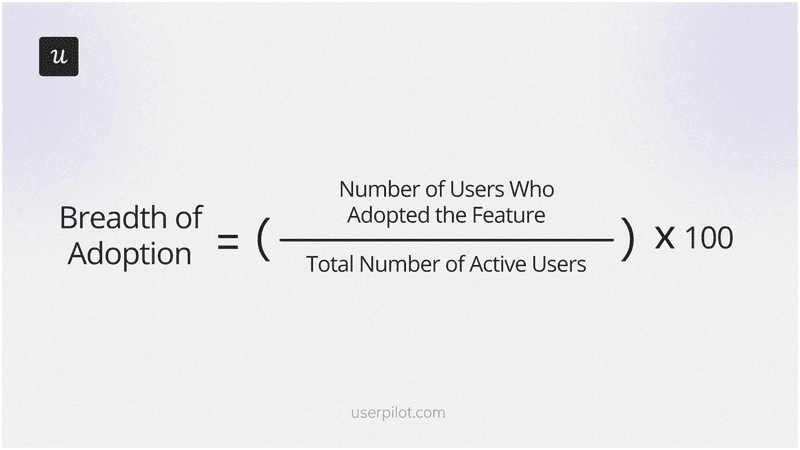
5. Breadth of adoption
This metric tracks the number of different features a user adopts within your product.
How to calculate: Begin by defining what constitutes adoption. Then, use a tool like Userpilot to track which users have engaged with the feature within a specified period.
Next, divide the number of users who adopted the feature(s) by the total number of active users within that period and multiply by 100.
If many users aren’t adopting your core features, then it’s a critical signal that needs immediate attention. This low feature adoption rate could indicate underlying issues, such as mismatched user needs, unclear value propositions, or usability problems.
How to calculate the breadth of adoption.
6. Depth of adoption
Depth of adoption measures how intensively users engage with a particular feature. It looks beyond simple feature usage and considers factors like frequency of use, the number of actions taken within the feature, and the level of user engagement.
How to calculate: You can choose between quantitative analysis and the qualitative approach or combine both to gain a holistic picture. Here’s a quick breakdown:
Quantitative measures:
- Frequency of use: Track how often users engage with the feature within a given timeframe (as with the time-to-adopt metric discussed above, you can get this data by calculating the time intervals between user actions).
- Feature usage intensity: Measure the complexity or sophistication of user interactions with the feature (e.g., number of advanced options used and complexity of workflows created).
- Time spent: Track how much time users spend actively using the feature (Use a tool like Userpilot to integrate event tracking. Then, capture timestamps for when users start and stop interacting with the feature).
Qualitative measures:
- User interviews: Conduct interviews with users to understand their workflows, challenges, and how deeply they utilize the feature.
- Feedback forms: Provide in-app feedback forms or surveys to gather insights into user experiences and identify areas for improvement.
- Support interactions: Analyze support tickets and service interactions to understand user challenges and identify areas where deeper engagement is hindered.
High adoption depths indicate that users enjoy using your features and have integrated them into their regular routines. If some features have shallow adoption, you can improve that by delivering ongoing support through webinars and a self-serve resource center. Also, check if there’s a need for a more interactive onboarding flow.
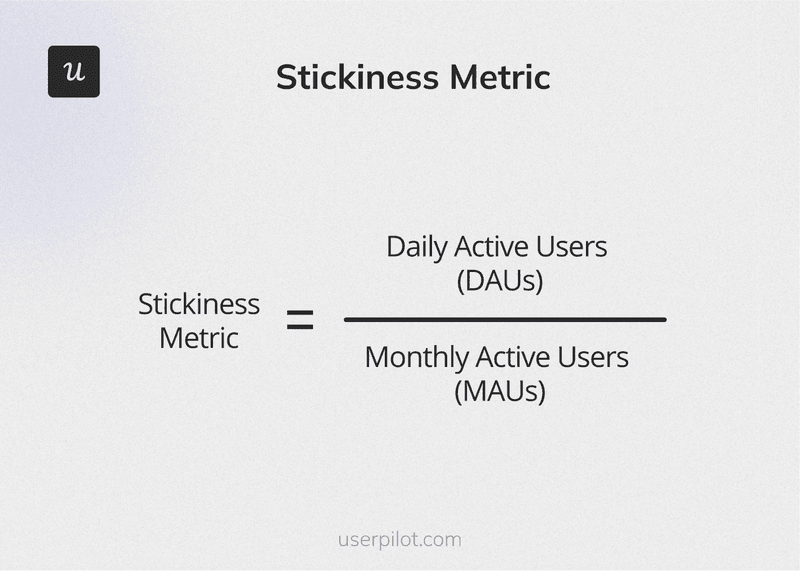
7. Stickiness
Stickiness measures how frequently users return to use a feature after their initial adoption.
How to calculate: A common way to calculate stickiness is by dividing the feature’s daily active users by monthly active users. However, you can also use other timeframes, such as weekly active users, or track session frequency within a specific period.
Low stickiness for a core feature can be an early warning sign of churn because it suggests users might not find the feature valuable enough to return to it regularly.
How to calculate feature stickiness.
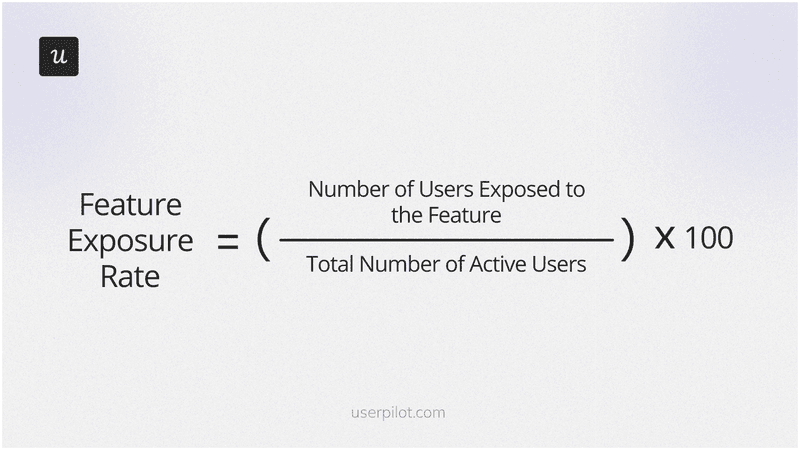
8. Feature exposure
This metric tracks the percentage of users who have been exposed to or have had the opportunity to discover a specific feature—usually through in-app messages.
How to calculate: Divide the number of users exposed to the feature by the total number of active users and multiply by 100.
High feature exposure is crucial for driving adoption because users can’t interact with functionalities they know nothing about. On the other hand, low feature exposure can lead to missed opportunities for adoption and the underutilization of valuable features. It can also result in a poor user experience if users feel like they are missing out on important capabilities.
Feature exposure rate.
9. Drop-off rate
This metric measures how many users abandon a specific workflow or task related to a feature.
How to calculate: Divide the number of users who abandoned the workflow by the number who started the workflow, and multiply by 100.
A high drop-off rate within a specific workflow often signals a lack of clarity or a mismatch between user expectations and the feature’s functionality. Low drop-off rates suggest a smooth and intuitive user experience that guides users effectively through the feature or task.
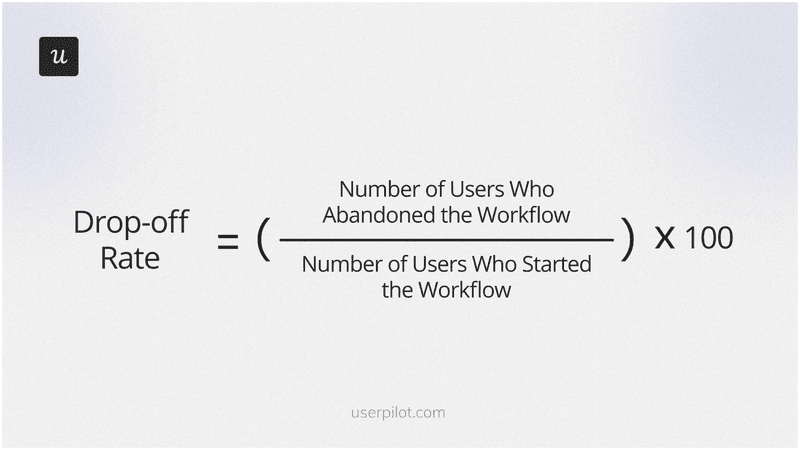
Formula to calculate the drop-off rate.
Best practices for improving + increasing feature adoption
Feature adoption metrics are only valuable if you use the data to improve your product and user experience. This section explores how to turn those metrics into more actionable insights.
Diagnose adoption bottlenecks
Isolate the adoption metrics that are underperforming and investigate the reasons behind them.
For example, if a feature has low adoption rates, check whether this is due to a discoverability issue, a low perceived value, or usability problems. If you notice a high time-to-adopt for some features, it might indicate a complex onboarding process or a confusing user interface.
Userpilot can help you deploy funnel analysis to identify drop-offs in the feature adoption funnel and pinpoint exactly what’s going on. For example, our funnel analysis report might show you that users are abandoning a specific step in a multi-stage process. Based on this insight, you can dig further to spot the friction point and optimize the process.
Improve feature adoption with Userpilot.
Use segmentation to understand feature adoption across different user groups
To truly understand how your features are performing, you need to go beyond the surface level. Different user groups will interact with your product in distinct ways, so a one-size-fits-all approach to adoption tracking might mean missing out on crucial insights.
Use a tool like Userpilot to segment users based on criteria like their subscription plan, level of product experience (e.g., returning vs. new users), or engagement with other features. Then, analyze the adoption metrics within each segment to better understand their unique needs and behaviors. This granular view can help you identify patterns and tailor your product strategy accordingly.
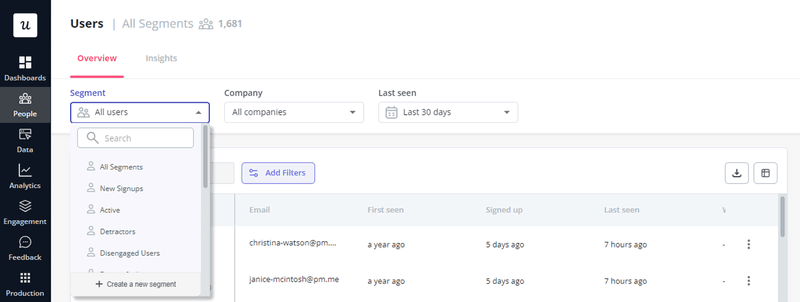
Creating user segments in Userpilot.
Assess your current user onboarding process
Use metrics like time-to-first-value and feature activation rates to assess your onboarding process. Aim to find potential improvement points, then deploy relevant solutions.
Speaking of solutions, Userpilot can help you create gamified onboarding flows that educate and keep users engaged throughout the onboarding process. Here’s an example of using our platform to build an onboarding checklist code-free.
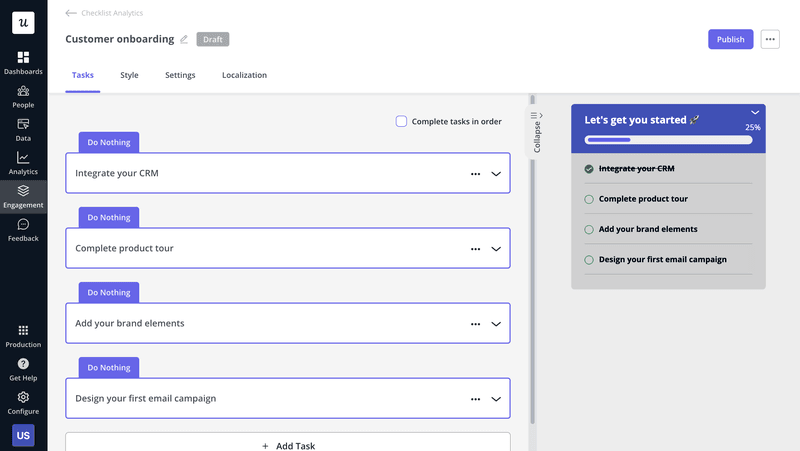
Gamify your onboarding process and improve feature adoption rates with Userpilot.
Combine qualitative and quantitative data
Feature adoption metrics provide valuable quantitative insights, but numbers alone don’t tell the whole story. So, combine these quantitative metrics with qualitative data that provides context and reveals the “why” behind the numbers.
How? Use an all-in-one growth tool like Userpilot to trigger in-app surveys and collect contextual user feedback. Here’s an example of how Userpilot can make your surveys appear on the right product pages:
Build surveys code-free with Userpilot.
Continuously measure the impact of your changes
Establish a baseline for your key adoption metrics before implementing any changes. Then, track these metrics over time to see how your efforts affect them.
You can leverage Userpilot to create a custom analytics dashboard that includes only the metrics you’re interested in monitoring.
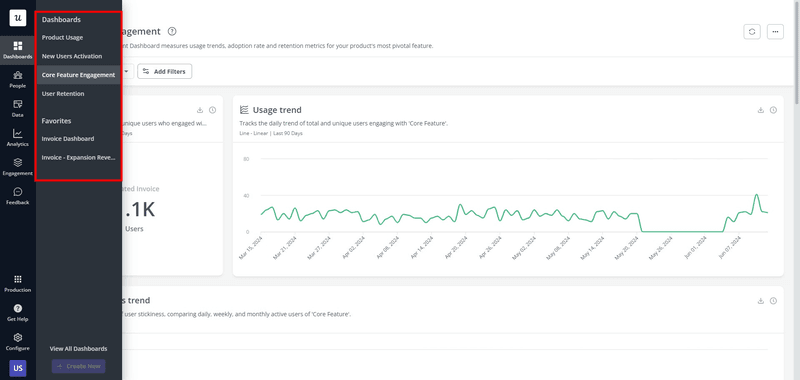
Track feature adoption metrics with Userpilot.
Feature adoption metrics FAQs
What’s a good feature adoption rate?
There’s no one-size-fits-all answer because a “good” feature adoption rate varies depending on factors like your industry, product complexity, and target audience.
However, our study found that a 20-30% feature adoption rate is a reasonable target for many SaaS products. Keep in mind that this is just a general guideline, and your specific goals may vary.
How can I measure feature adoption metrics?
Userpilot provides all the tools you need to measure feature adoption. Within one platform, you can track user behavior, build customized dashboards, segment users, and analyze user flows.
Conclusion
Feature adoption isn’t just about measuring usage—it’s a valuable window into what your users truly need and how you can better serve them. This user-centric approach is key to increasing engagement and satisfaction and, ultimately, driving sustainable business growth.
Ready to take action? Book a demo and discover how Userpilot can help you gather user insights, create seamless onboarding experiences, and boost feature adoption.