Exploring Userpilot Flow Analytics: A Walkthrough (original) (raw)
What are flows in Userpilot?
Userpilot flows are sequences of UI patterns that product, marketing, and customer success teams can use for:

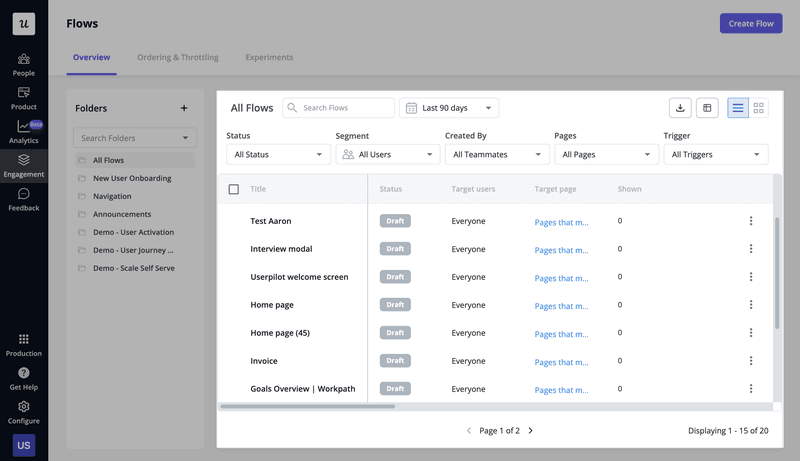
Userpilot flows main dashboard.
Are your user flows helping or hurting adoption?
Just building a flow isn’t enough. You need to measure its impact. Take this 4-step assessment to see if you’re getting the most out of your flow analytics.
How do you currently measure flow success?
We just track total views
We track completion rates only
We track step-by-step drop-offs and goal completion
What happens when a flow has a high drop-off rate?
We leave it as is
We rewrite the copy based on intuition
We A/B test new variations against a control group
Do you link flows to specific user outcomes?
No, flows are just for information
Sometimes, but it’s hard to correlate
Yes, we track if users adopt the feature after the flow
Optimize Flows for Real Results
Don’t just show messages—drive action. Userpilot gives you detailed flow analytics, goal tracking, and A/B testing to ensure your in-app guidance works.
Track. Test. Optimize.
What UI elements are available in Userpilot?
There are 6 different types of UI elements and spotlights you can create: pop-up modals, tooltips, slideouts, banners, spotlights, and driven actions. You can trigger these individually or group them into interactive walkthroughs and checklists.
UI patterns include modals, slideouts, tooltips, and driven actions.

UI patterns for flows in Userpilot.
Spotlights include Native tooltips, Hotspots, and Banners.
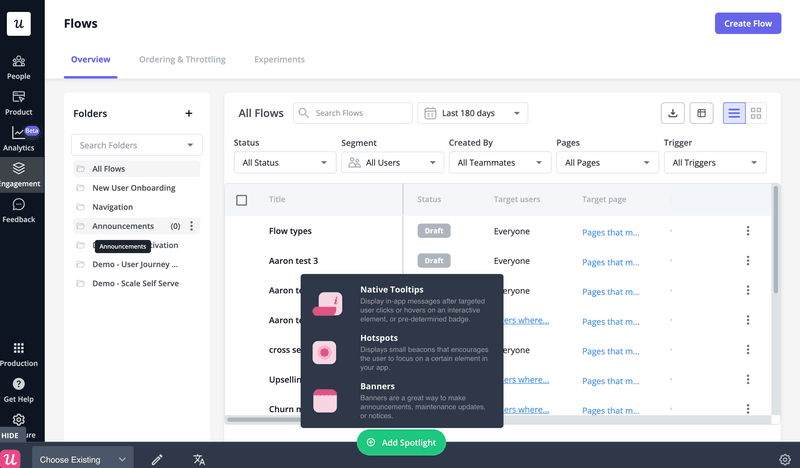
Spotlights for flows in Userpilot.
Flows are easy to customize thanks to the WYSIWYG Chrome Extension editor. In each of the UI elements, you can include buttons, HTML elements, media, and of course, text.
Talking of text, you can quickly create or refine the microcopy for each of the patterns in your flow with Userpilot’s AI writing assistant, so there’s no need to look for 3rd party tools.
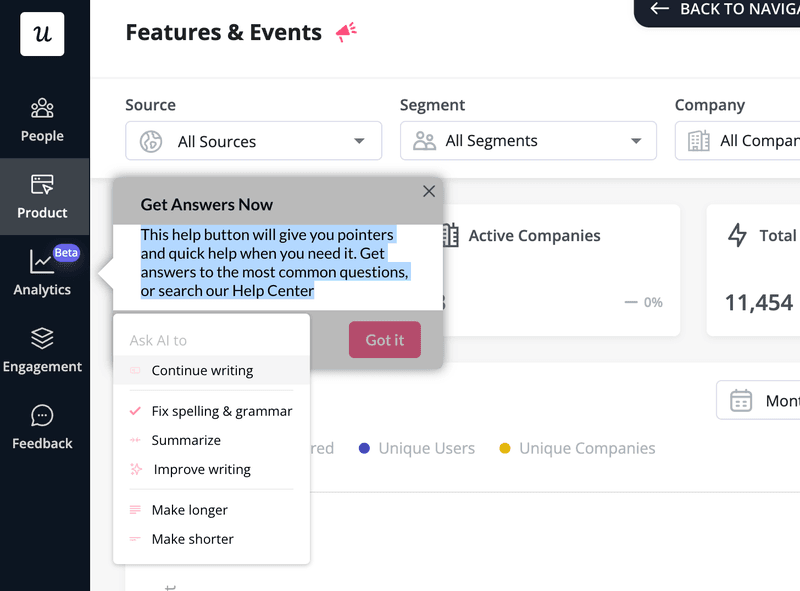
AI writing assistant in Userpilot.
AI also powers the localization feature, which allows you to automatically translate your in-app messages into multiple languages.
Once you create a flow, you can schedule the publication and end dates of your flows for time-sensitive announcements.
More importantly, Userpilot allows you to target specific user segments, for example, new users, and thanks to the throttling feature, you can limit how many flows each user sees to avoid information overload.
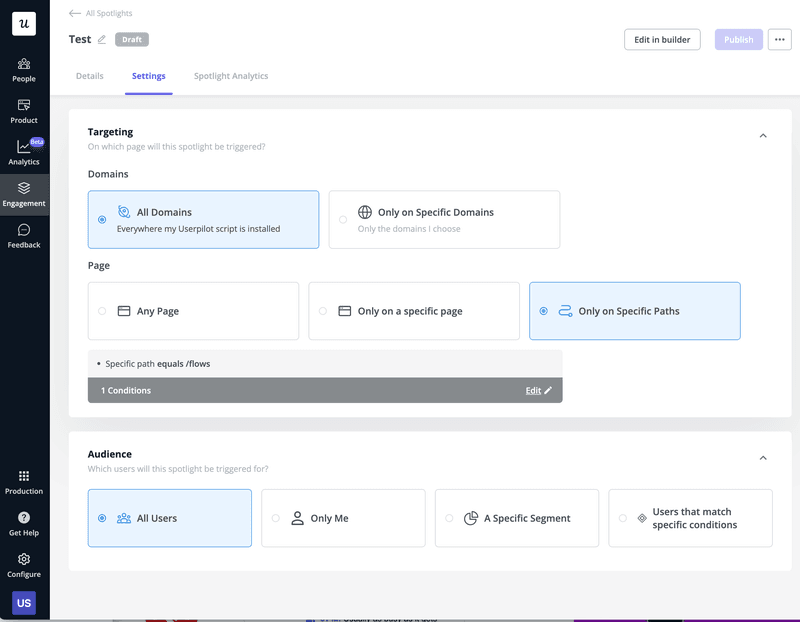
Flow targetting options.
Why track flow analytics in Userpilot?
Tracking flow analytics data in Userpilot enables continuous improvement of your flows so that they can drive your key KPIs more effectively.
How so?
If designed well, your flows can improve user activation, boost product adoption, and increase expansion revenue.
However, poor design can create unnecessary friction that slows users down. And the longer they take to complete the flows, the more likely they are to churn.
Userpilot flow analytics give you a detailed understanding of which flows get completed and which not so that you can easily identify sources of friction. Armed with such insights, you can iterate on your flows and increase their performance.
Where to view the performance of your flows?
Userpilot flow analytics are available in the sidebar menu.
To access them, click on the Engagement button, and choose Flows from the menu.
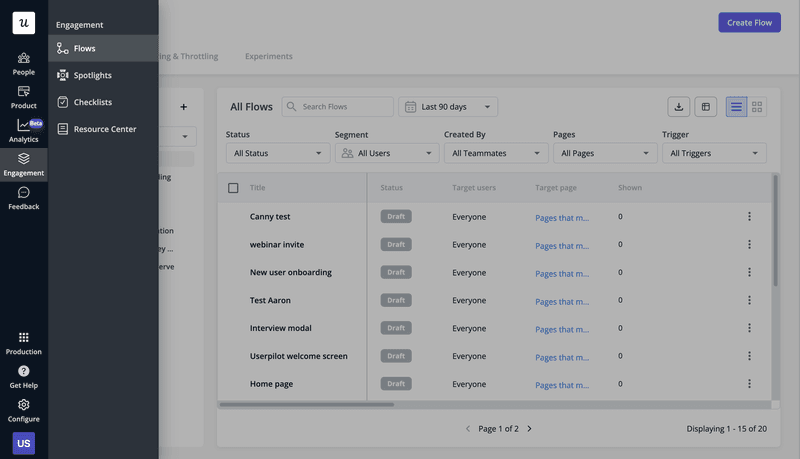
Userpilot flow analytics.
This will reveal a list of all your flows with basic information like their status, target users, target page, and the number of times it was shown.
From the list, choose the flow that you’re interested in.
Userpilot flow analytics,
To access the analytics page, click on Flow Analytics at the top of the page.
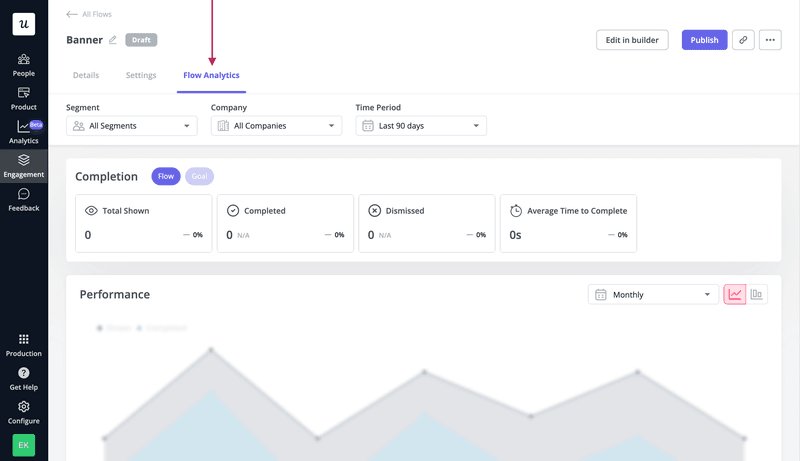
Userpilot flow analytics.
What do Userpilot flow analytics include?
Userpilot allows you to analyze different aspects of the flow performance and access the data in various formats.
Chart visualization settings
Userpilot allows you to filter the flow performance data using 3 criteria: user segment, company, and time period.
This gives you the ability to isolate the data that you need. For instance, you could look at the performance of the flow among the power users at a specific company in the last 7 days.
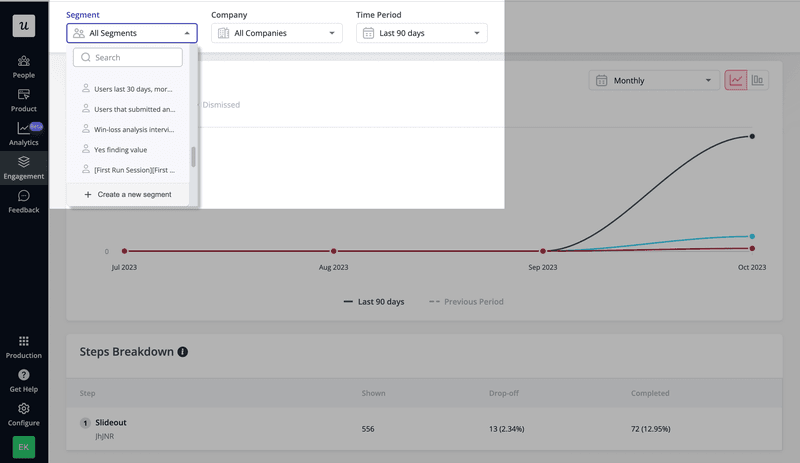
Flow analytics: chart settings.
Flow and goal completion metrics
What data do you get about your flow performance?
There are 4 basic metrics:
- Total shown – how many times it was triggered
- Completed – how many users finished it
- Dismissed – how many users didn’t start the flow
- Average Time to Complete – the lead time, from the moment the user starts the flow until they finish

Flow analytics: Flow scoreboard.
In addition, Userpilot allows you to set goals and track your flow effectiveness.
For example, you could set a goal for an activation or feature adoption event. In this way, you can see how many users achieve the goal after completing the flow.
To see the data, toggle to the Goal view.

Flow analytics: Goal scoreboard.
Flow analytics chart
Userpilot’s flow analytics charts provide easy-to-interpret visualization of the historical flow data.
One quick look is enough to see how many users have seen the flow, how many completed it, and how many dismissed it.
In the top right corner, you can choose the chart type, for example, a graph line or stacked bar chart, as well as time intervals, for example, daily, weekly, or monthly.
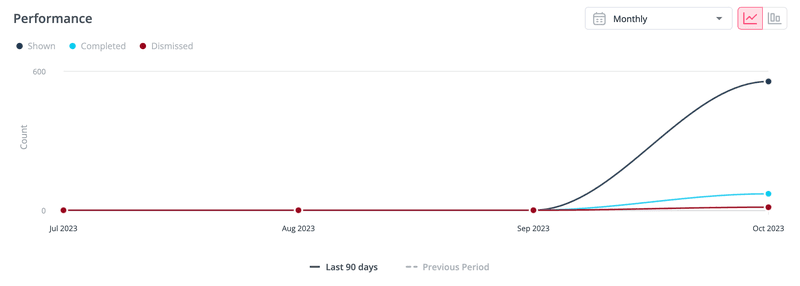
Flow analytics: performance chart.
Steps breakdown
Apart from the overall flow performance, Userpilot allows you to track the performance of each step. Specifically, you get data on how many users have seen each step, how many completed them, and how many dropped off at this stage.
This allows you to identify friction and drop-off points so that you can better optimize the flow.
To access the information, scroll down to the Steps Breakdown.
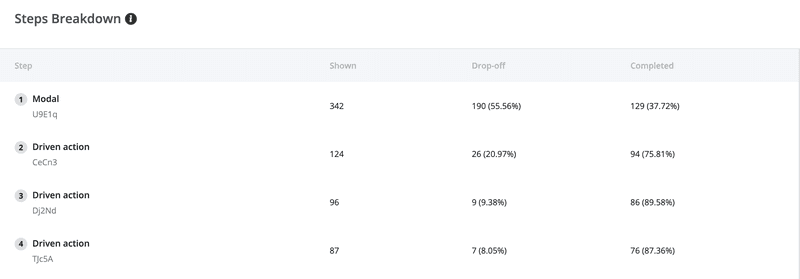
Flow analytics: steps breakdown.
User activity
Finally, with Userpilot, you can also see flow data for individual users.
In particular, you can see:
- How many flows a user has completed.
- How many they’ve dismissed.
- When they completed a goal.
This allows you a more granular analysis, for example, as a follow-up to customer feedback.
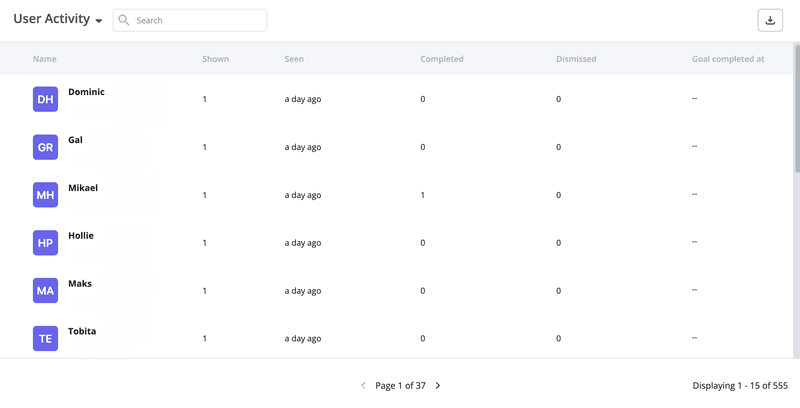
Flow analytics: individual users.
Conclusion
Userpilot analytics enable SaaS teams to measure the performance of in-app flows.
By tracking completion rates of the flows and individual steps, they can optimize the flows to improve user experience. Tracking goals associated with flows enables them to determine how successful they are at driving your KPIs.
To learn how your SaaS organization can benefit from Userpilot’s flow analytics, book the demo!