Introducing Userpilot Analytics: The Complete Product Growth Tool (original) (raw)
I admit Introducing Userpilot Analytics may not be the most accurate title. After all, Userpilot is already a powerful analytics tool and we’re simply adding new features that have been available only in dedicated product analytics tools so far.
Why?
As the competition in the B2B SaaS space is growing, SaaS companies need even better product analytics to drive product growth.
The new analytics features will provide product teams with more granular insights into user behavior at all customer journey stages. Thanks to them, they can analyze and act on data to improve customer experience and retain them.
Curious about the new features? Let’s check them out!
What can you expect from the new Userpilot analytics?
The new analytics features include:
- Trend analysis – to track changes in key product metrics over time.
- Funnel analysis – to monitor and optimize conversion rates at different stages of the user journey.
- Flow analytics – for tracking user progress along the user journey in detail.
- A/B testing – to conduct a range of experiments to optimize in-app experiences.
On top of these, the team is also working on retention analysis, customizable dashboards, user profile analytics, and AI-powered analytics. These are coming by the end of the year.
Is your product analytics stack holding you back?
Basic reporting isn’t enough to drive product-led growth. Take this 4-step assessment to see if you are ready for the next generation of Userpilot Analytics.
How easily can you visualize usage trends over time?
We rely on static spreadsheets
We see general traffic but lack user-level detail
We track custom events, DAUs, and MAUs instantly
Can you pinpoint exactly where users drop off in a flow?
No, we just see the final conversion rate
We have a vague idea but can’t see step-by-step data
Yes, we analyze granular flow steps and drop-off points
How do you optimize underperforming experiences?
We make changes based on gut feeling
We run basic A/B tests occasionally
We run continuous Head-to-Head and Multivariate tests
Unlock the Complete Product Growth Tool
Don’t settle for fragmented data. Userpilot Analytics combines Trends, Funnels, and A/B testing in one platform to help you analyze and act on data instantly.
Analyze. Experiment. Grow.
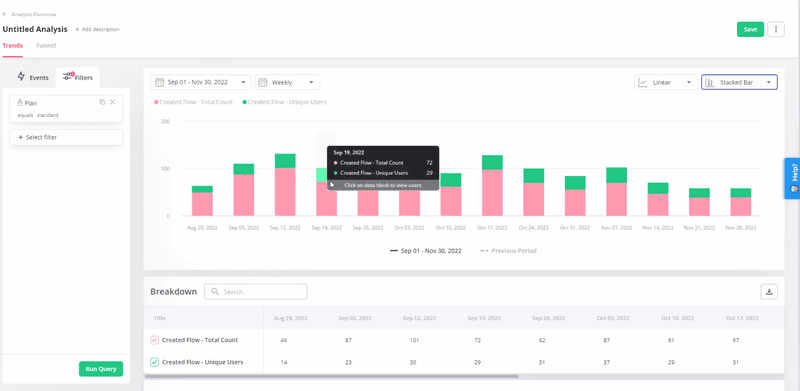
Uncover usage trends with powerful data analysis trends
Trend analysis allows you to visualize event data at the user and company levels.
For example, you could visualize the total number of users who completed a particular event (including custom events), unique users, active users (DAUs, WAUs, and MAUs), as well as the count per user.
This is not limited to a single event either. You can use the feature to visualize multiple trends in one graph. For example, you could use it to track main activation events like ‘created a flow’ and feature usage.
Of course, the feature enables product managers to filter the event analytics data for more granular analysis. For example, you could filter data by company name or device type. You can also add custom formulas, and export the data into a CSV file.
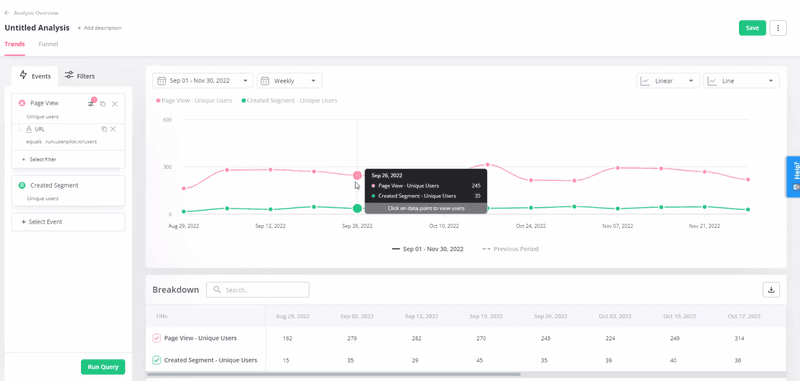
Introducing Userpilot Analytics: Trend analysis.
The visualizations are easy to customize, and you can choose different graph and chart styles to display your product usage data:
- Time Series – Line, Stacked Line, Stacked Bar
- Total Value – Pie, Bar, Metric
Introducing Userpilot Analytics: Trend analysis.
Unveil conversions across key stages with funnel analysis
Funnel analysis is a tool that allows you to track conversion rates at key stages of the user journey. The feature also allows you to view the average conversion time.
Thanks to that, you will be able to easily identify friction points and drop-offs. If lots of users fail to progress from one stage to another, that’s the spot that needs optimizing.
Of course, identifying the exact source of friction will require further investigation. You could target the users who have dropped off with surveys or watch their session recordings.
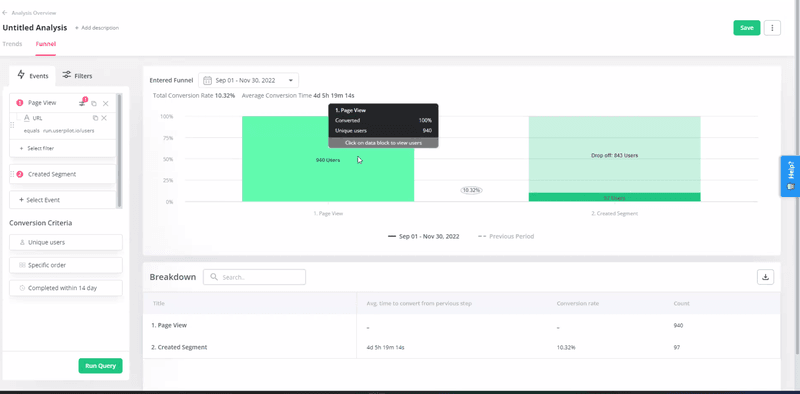
Introducing Userpilot Analytics: Funnel analysis.
Funnels in Userpilot will allow you to break down the data for detailed analysis of the conversion rates. For example, you could display conversion data across different price plans or user segments next to each other in one funnel chart.
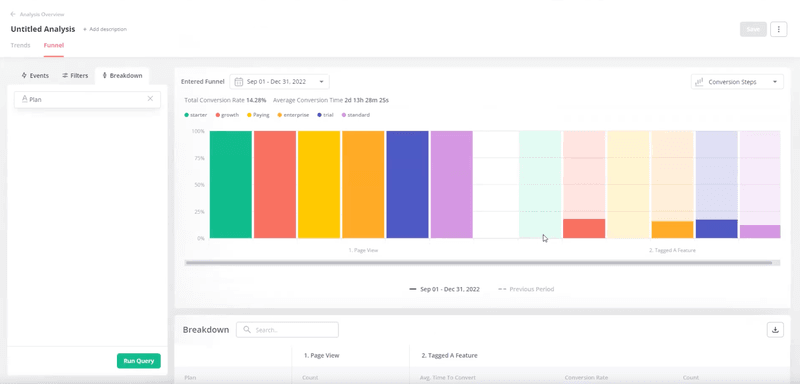
Introducing Userpilot Analytics: Funnel analysis.
Enhance app experiences through intuitive flow analytics
Flow analytics enables product teams to extract granular insights about user interactions with in-app experiences at the step level.
For example, if your onboarding flow consists of a number of in-app messages, you will be able to analyze in detail which users interacted with them and completed the step, and which of them dropped off.
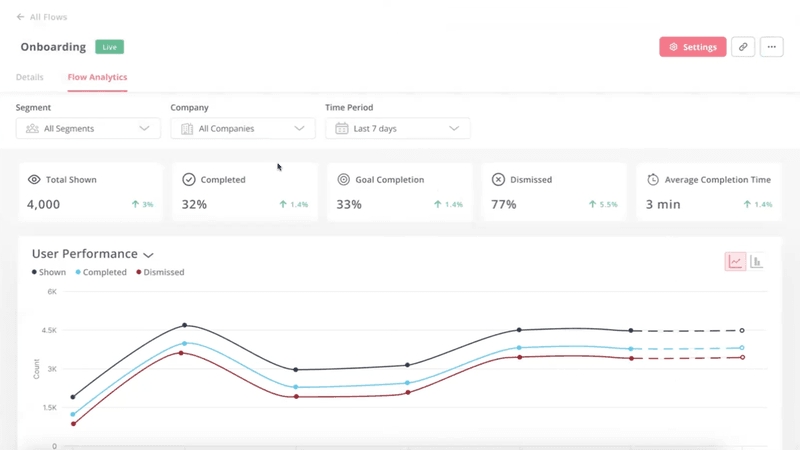
Introducing Userpilot analytics: Flow analytics.
Powerful A/B testing at your fingertips with different tests available
We’re expanding the A/B testing feature to allow you to conduct different experiments on your in-app flows. These are:
- Controlled A/B Test – to assess the effectiveness of a single flow by comparing its performance against a control group that doesn’t see the flow.
- Head-to-Head A/B Test – to compare the effectiveness of two different flows.
- Controlled Multivariate Test – to compare the performance of various flows against a control group.
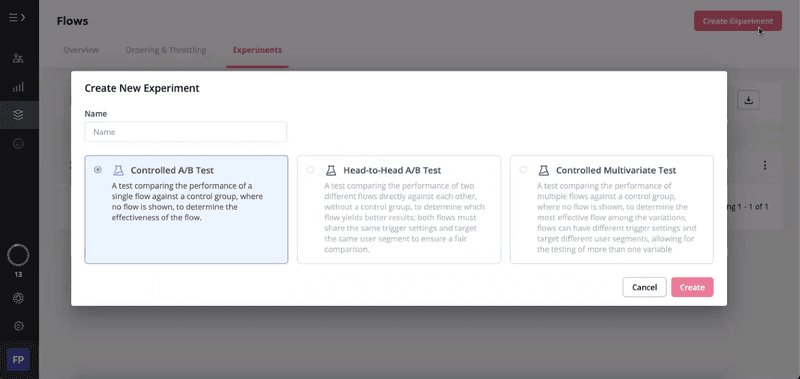
Introducing Userpilot analytics: A/B testing.
Coming soon: Userpilot analytics features to watch out for
In addition to the above features to launch in September, there are more features coming by the end of this year.
- Retention analysis – to effortlessly track and analyze user retention trends over time. You will be able to view the retention rate for the last 7 days, 30 days, and 180 days, as well as custom data ranges via cohort analysis.
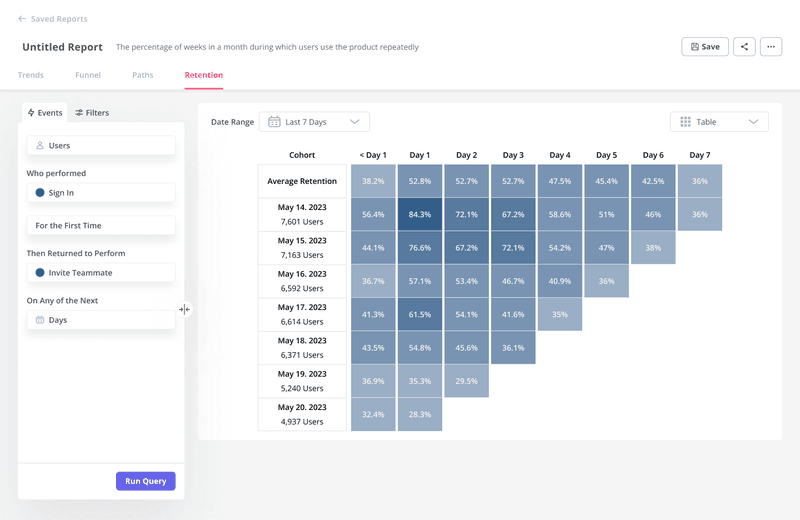
Introducing Userpilot Analytics: Retention analysis.
- Customizable dashboards – to easily spot user insights by tracking chosen metrics added to the dashboard as individual widgets.
- User profile analytics – for granular user behavior analysis of individual customers. Clicking on a specific user will display their profile with all the events and actions performed by them in a specific timeframe.
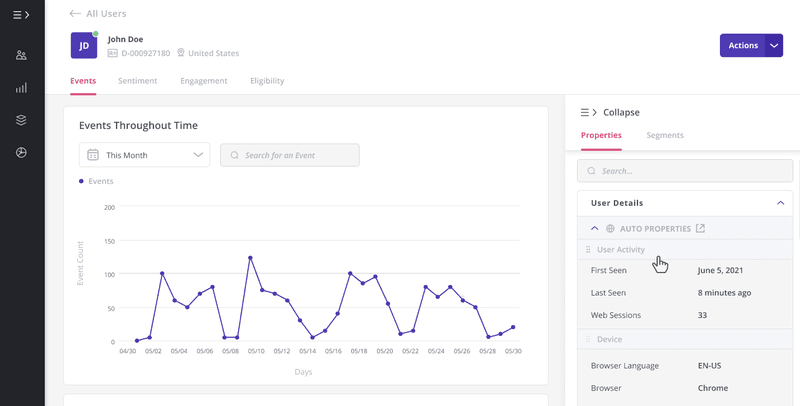
Introducing Userpilot Analytics: User Profile Analysis.
- AI-powered analytics – to supercharge qualitative user feedback analysis and leverage quantitative data for predictive analysis.
Conclusion
Despite being “only” a product adoption tool, Userpilot already offers fairly potent analytics features.
However, the new analytics features will bring its capabilities to a level offered only by dedicated analytics tools for SaaS. Thanks to them, product and marketing teams will be able to generate more granular and actionable insights and make data-driven decisions.
If you want to find out more about the new Userpilot analytics, book the demo!