User Data Analytics: An In-Depth Guide for SaaS Companies (original) (raw)
TL;DR
- User data analytics involves collecting and analyzing data about how users engage with a product to understand their behavior patterns and motivations.
- User behavior analysis enables the team to make data-driven product development decisions and identify opportunities to improve the product experience.
- Teams from across the organization, including product, marketing, design, and customer success, benefit from user analytics.
- To collect user data, you usually need to tag features and events to track in an analytics platform like Userpilot, Amplitude, or Google Analytics.
- The user analysis process starts by defining user personas representing main user segments.
- For each user persona, map their customer journey, focusing on the key touchpoints, actions, and challenges.
- Next, list the metrics to track at each user journey stage. For example, at the referral stage, it could be NPS or the referral count.
- Common data analysis techniques include funnel, path, trend, cohort, heatmap, and session recording analysis, to name just a few.
- For a complete picture of user behavior, collect user feedback. In-app surveys are the best tool for the job.
- Next, act on the user analytics insights, for example, by dealing with usability issues or improving onboarding.
- Make a habit of reviewing relevant metrics regularly, for example, weekly or monthly, depending on your current priorities.
- Common user analytics use cases include identifying friction in the user journey, finding happy paths, spotting trends in user behavior over time, and predicting user churn. However, there are many more applications possible.
- Want to learn more about Userpilot’s analytics features? Book the demo!
Is Your User Data Analytics Strategy Driving Engagement?
Collecting data is just the first step. To truly improve user data analytics to improve customer engagement, you need to turn raw numbers into personalized experiences. Take this quick check to see if you’re getting the full value.
How do you currently segment users based on their in-app behavior?
You notice a user persona struggling to activate. What is your automated response?
How do you validate the “why” behind the user data trends you see?
Turn Data Into Engagement
Don’t let your data sit in a dashboard. Userpilot helps you track, segment, and engage users in real-time, closing the loop between analytics and action.
What is user data analytics?
User analytics is the process of collecting, analyzing, and interpreting data about user interactions with digital products.
Its main purpose is to help teams understand how users behave on websites and inside products to enhance their experience, improve the product, and drive product goals.
Why is measuring user data analytics important?
Analyzing how users interact with the product is essential to make data-driven decisions.
For example, user analytics helps teams understand user needs, wants, and pain points. As a result, they can prioritize feature and product initiatives that deliver the most value.
Think about it:
Without user analytics, product teams would have to trust their intuition and experience when making decisions.
That’s not exactly the most reliable way. Our hunches can be wrong, and what you learned in the past may not apply to current circumstances because user needs and market conditions are constantly shifting.
Who benefits the most from tracking user analytics data?
User analytics benefit teams and stakeholders from across the organization:
- C-suite executives can leverage the insights to assess product performance and how well it drives business goals.
- Product managers use it to call better shots, justify their decisions, and secure senior leadership buy-in.
- Product teams harness it to inform their prioritization and resource allocation decisions and monitor product performance.
- Marketing teams use it to optimize their campaigns so that they better resonate with the target audiences.
- UX/UI designers lean into user analytics insights to make UX improvements.
- Customer success teams can better understand customer goals and pain points to guide how they onboard and support users.
How do I collect user analytics data?
Collecting user analytics data requires a web or product analytics tool.
Most, if not all of them rely on event tracking. This is done by tagging the features from the front end or attaching JS scripts from the backend.
What are the best user analytics tools? Check out the final section of the guide!
What does the user analysis process include?
The analysis of user data involves a sequence of steps.
1. Define your customer personas
The process starts by defining your user personas.
These are imaginary characters representing your typical users.
Why do you need personas?
Most likely, your user base isn’t homogenous. Instead, it’s made up of users with various use cases. For example, the product manager and product marketing manager are two of Userpilot’s personas.
As each of the two has different goals, how they use the product differs as well, and so we need to distinguish between the two when analyzing user behavior.
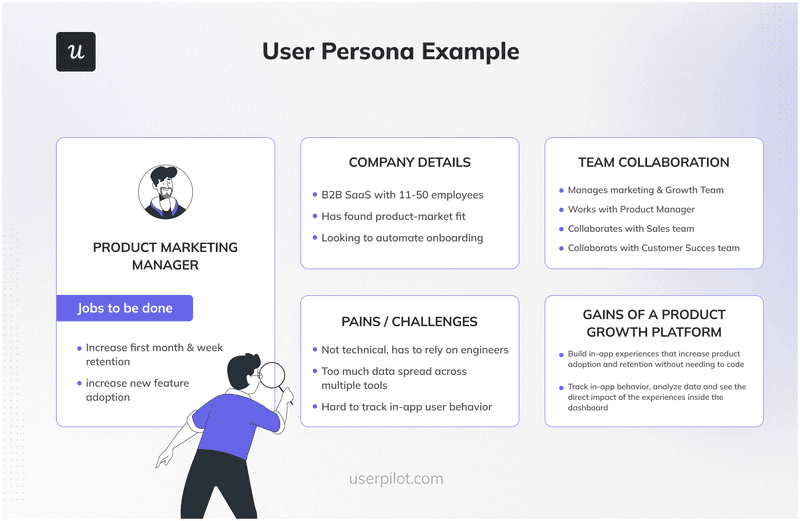
User persona example.
2. Map out the customer journey of the different personas
The customer journey map is a visualization of the key stages that the user goes through during their relationship with the product, from the moment they first learn about it until they stop being customers.
While the key stages in a typical customer journey are the same for all user personas, what happens at each stage may vary. That’s why you need a separate map of each persona.
What information should the map include?
For each stage, list:
- User goals (e.g., sign up for the trial)
- Main touchpoints (e.g., the sign-up form)
- Key actions (e.g., complete the form)
- Feelings (e.g., excited but a bit confused)
- Barriers (e.g., ambiguous questions)
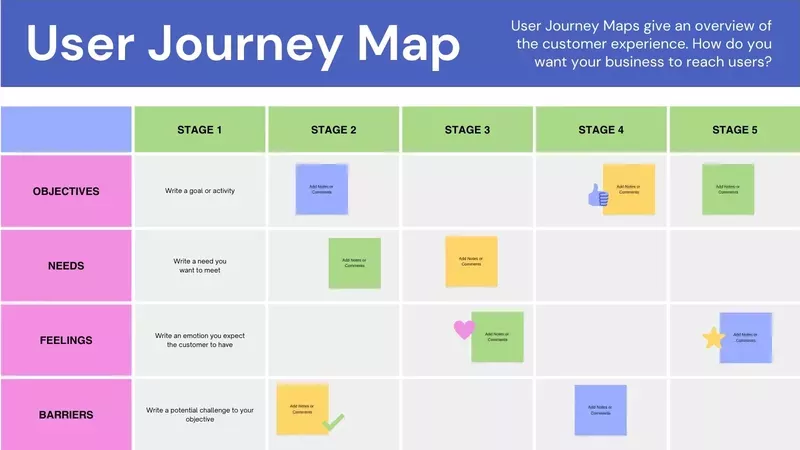
User journey map template from Canva.
3. Define the metrics for each customer journey stage
At each stage of the user journey, there are different metrics to track. That’s how you can evaluate the product’s performance and progress.
Examples of key metrics to consider include:
- Acquisition stage: trial sign-ups, demo bookings, customer acquisition cost (CAC).
- Activation stage: activation rate, time to value, primary onboarding completion rate.
- Adoption stage: feature adoption rate, daily/weekly/monthly active users (DAU/WAU/MAU), customer satisfaction score (CSAT).
- Retention stage: churn rate, retention rate.
- Referral stage: NPS, referral count.
- Revenue stage: customer lifetime value (CLV), annual recurring revenue (ARR).
While it’s possible to track dozens of metrics, it doesn’t mean you should. Make sure they’re aligned with your product and business goals.
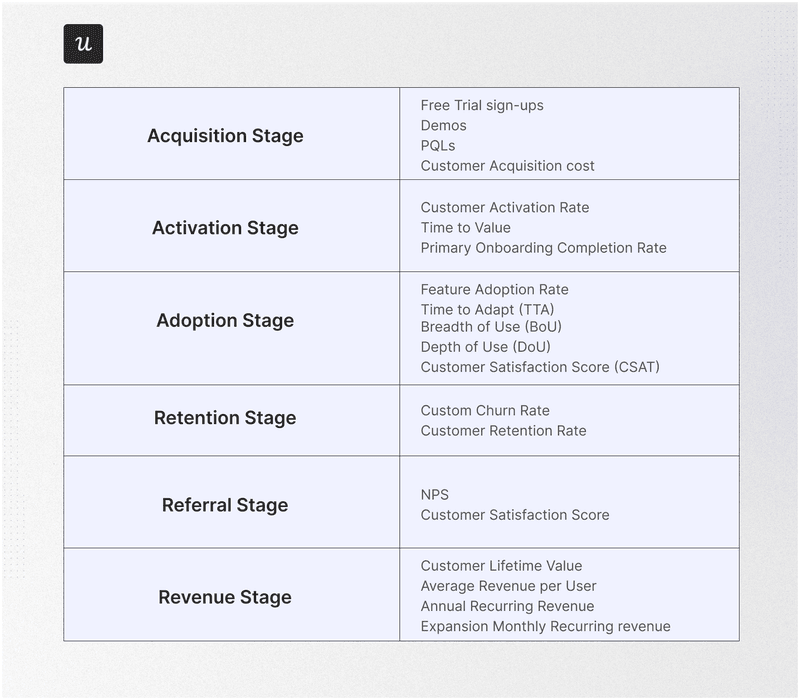
User journey metrics.
4. Analyze the user behaviors using different product analytics techniques
Your goals also determine the choice of user analytics techniques.
Popular data analysis techniques include:
- Funnel analysis – to track user progress between customer journey stages.
- Path analysis – for granular analysis of user actions at a particular stage, either before or after an event.
- Trend analysis – to track changes in key metrics over time.
- Cohort analysis – for analyzing user retention and churn over time.
- Heatmap analysis – to visualize how users interact with features on a page or screen, including their clicks, hovers, or text inputs.
- Session recordings – for in-depth analysis of user interactions with the product or website UI.
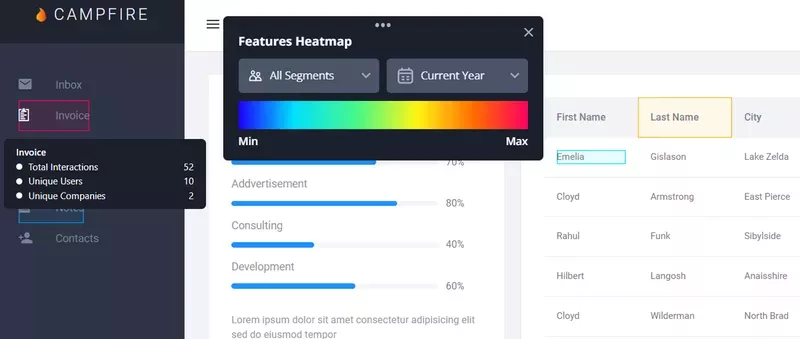
Userpilot heatmap.
5. Pair user behavior analysis with customer feedback
Quantitative data from product analytics gives you an objective view of what the user does inside the product. However, it may not always be enough to understand why they do it. That’s why it’s a good idea to supplement your user analysis strategy with qualitative feedback.
What’s the most efficient way to collect it?
Let me explain why:
- They’re easy to design.
- You can target thousands of users at once, so they make it possible to collect feedback at scale. Not many other methods have this advantage.
- Email surveys can do it as well, but they tend to have lower response rates – around 8% vs 15-25% for in-app surveys. The reason? It’s easier to capture user attention while they’re engaging with the product.
- With in-app surveys, you make sure it’s the users who respond, not somebody random at the company who manages the account.
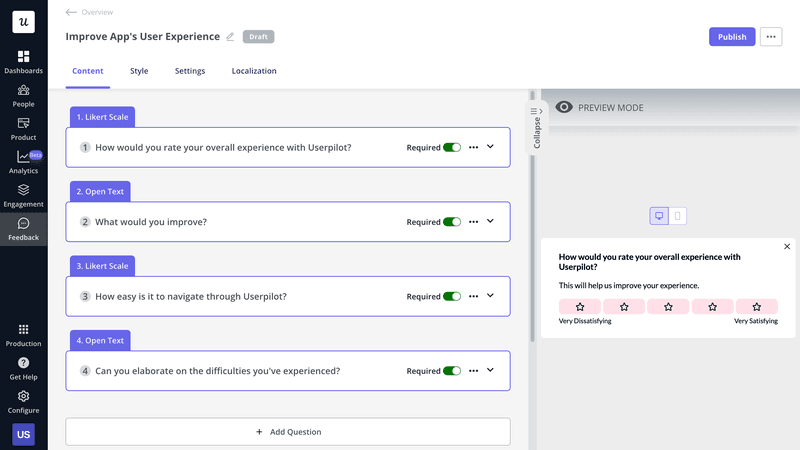
In-app survey created in Userpilot.
6. Act on the insights to optimize the user experience
Collecting insights from data analytics and feedback makes sense only if you act on them to optimize the user experience.
How you do it depends on the user pain points you’ve diagnosed and their requests.
For example:
- If the activation rate is too low, you may want to consider personalizing your onboarding process for different user personas so that they discover the functionality relevant to their use cases.
- When you’re struggling to drive upsells, you can trigger the upsell prompts contextually at the moment when the user needs a premium feature or is about to reach their usage limit.
- If users are dropping off at the sign-up stage, simplifying the sign-up form could improve the completion rate.
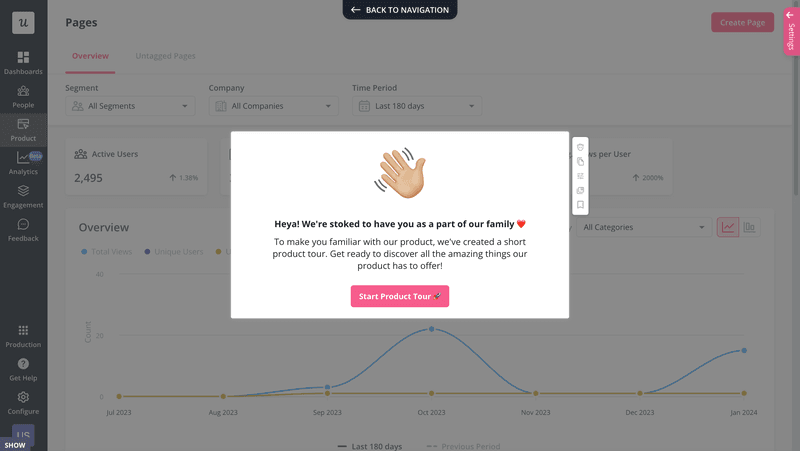
Welcome screen created in Userpilot.
7. Develop a cadence to analyze user behavior routinely
Tracking and analyzing user behavior data should be a routine part of your job.
How often should you do it?
It depends on the metrics, your goals as well as immediate objectives.
For example, an established product may track product adoption on a weekly or monthly basis.
However, if you’re implementing a new onboarding flow to improve adoption, you may do it on a daily or even hourly basis, depending on the product and new user acquisition rate.
To make sure user data analysis takes place regularly, make it a permanent element of your meetings, be it weekly, monthly, quarterly, or daily. Before it becomes second nature, set calendar reminders to not forget about it.
User behavior analytics use cases for SaaS companies
Now that we have covered the process in general, let’s look at a few specific use cases for user analytics for SaaS teams.
Identify drop-off points in the user journey
Product, design, and customer success teams leverage user analytics to identify friction points in the user journey and improve conversion rates.
What tools should you use?
You can find the exact stage where users drop off (and how many of them) from funnel analysis. In this kind of report, each bar represents one stage. So from the chart, you can often tell right away where the issue is. And if not, you can dive into the data by hovering over the bars.
Once you know the main area, path analysis, heatmaps, and session recordings enable you to find the exact cause of friction.
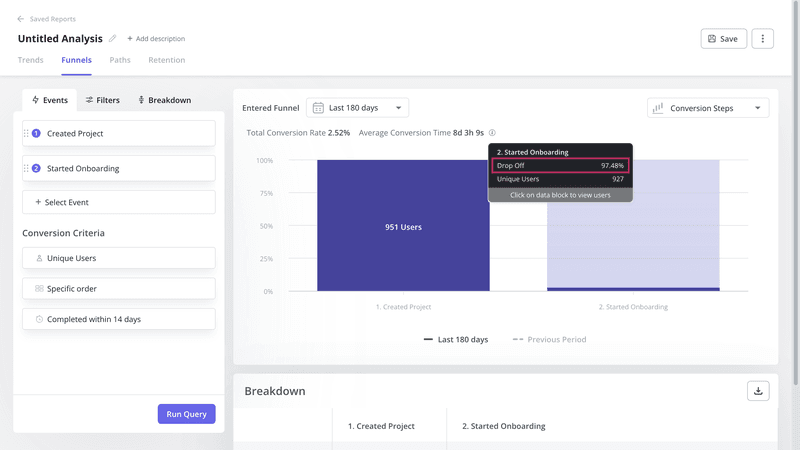
Funnel analytics in Userpilot.
Discover the happy path
Path analysis is the perfect tool for identifying the happy path to conversion.
The happy path is the most optimal way to an event, like activation or upgrade. You can find it by analyzing the actions of your power users leading up to that event. In Userpilot’s Paths report, this is easy because you can visualize the Top Path, which is the most common path taken.
You can then redesign how you onboard your users to help them emulate the happy path.
Naturally, different user personas have different happy paths, so take it into account when analyzing user behavior.
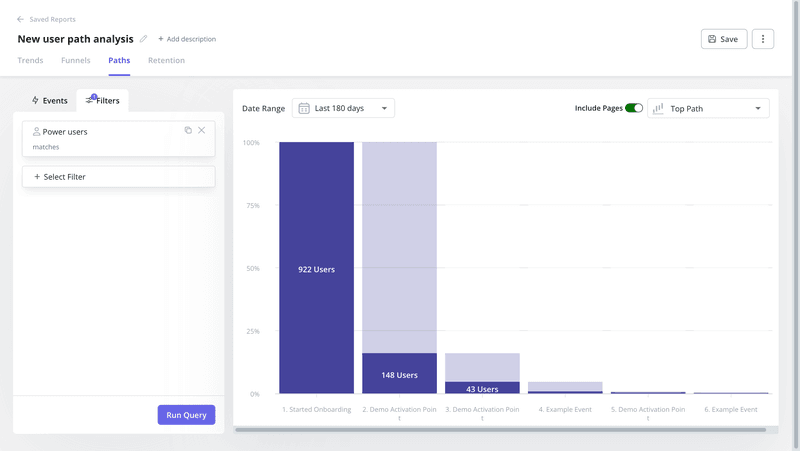
Top Path visualization in Userpilot.
Identify trends in user behavior data
Trend and pattern analysis is a common use case for user analytics.
For example, you could plot two or more data sets in one chart, such as onboarding completion rate and activation rate, to determine the correlation between the two.
If the two correlate, it’s possible that there’s also causation: one of them has an impact on the other.
You can also use trend analysis to track the performance of KPIs or identify seasonal patterns in user behavior. For instance, product usage can increase around public holidays or drop during the summer vacation season.
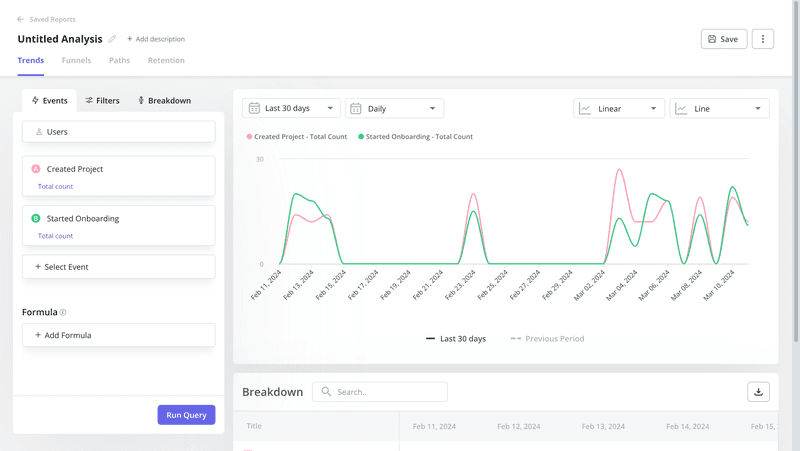
Trend analytics in Userpilot.
Track retention rates over time
Retention tracking is essential for product teams to make informed decisions.
Why?
Retention is an indication of how valuable users find the product or how satisfied they are with the user experience. Tracking it over time shows you have successful product changes and it enables you to predict future revenue.
Userpilot supports a user retention dashboard that allows you to track key retention metrics from one place, and you will soon be able to customize it.
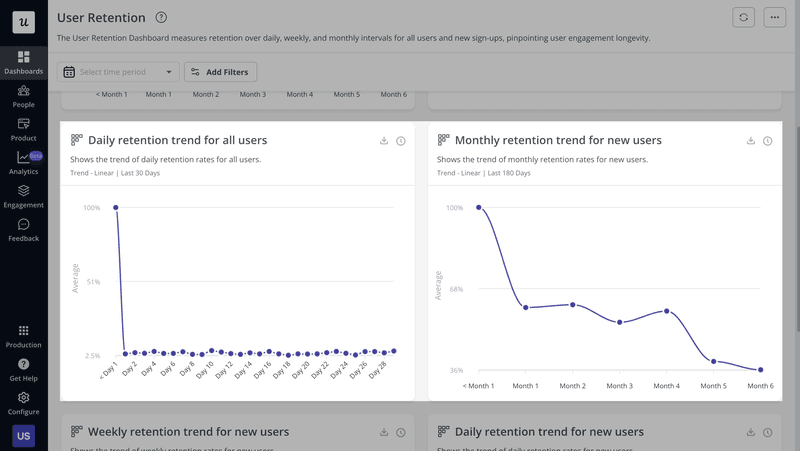
User retention dashboard in Userpilot.
Predict and reduce potential customer churn
Product teams apply user analytics to predict user churn.
You can do it by analyzing the behavior of the churned users, for example, with path analysis. Next, you can create custom events made up of the user actions that typically lead to churn. Tracking such custom events enables you to identify users who are at risk of churning.
It gets even better.
You can also use the events to trigger in-app experiences designed to re-engage at-risk users, and potentially reduce the churn rate.
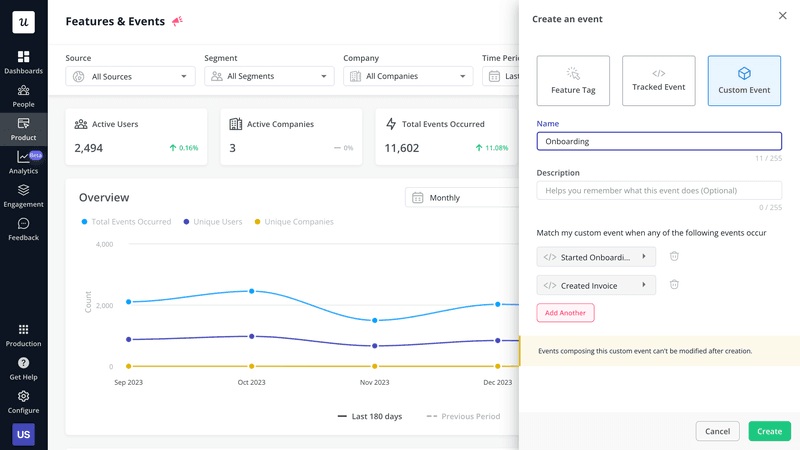
Custom events in Userpilot.
The best user analytics tools in the market
The effectiveness of your user analytics strategy depends on your tool stack. That’s why we’re finishing with a round-up of some of the best user analytics tools for SaaS teams.
Userpilot – the complete user engagement and analytics tool
Userpilot is a digital adoption platform (DAP). It means it doesn’t just do analytics. You can use it to collect user feedback and act on the insights to improve user experience with in-app flows.
Userpilot analytics functionality is code-free, so you can tag features to track events from the Chrome extension.
Feature tagging from Userpilot Chrome extension.
Once you have the data, you can visualize and analyze it in different reports.
There are also 4 analytics dashboards, and you will soon be able to create custom ones.
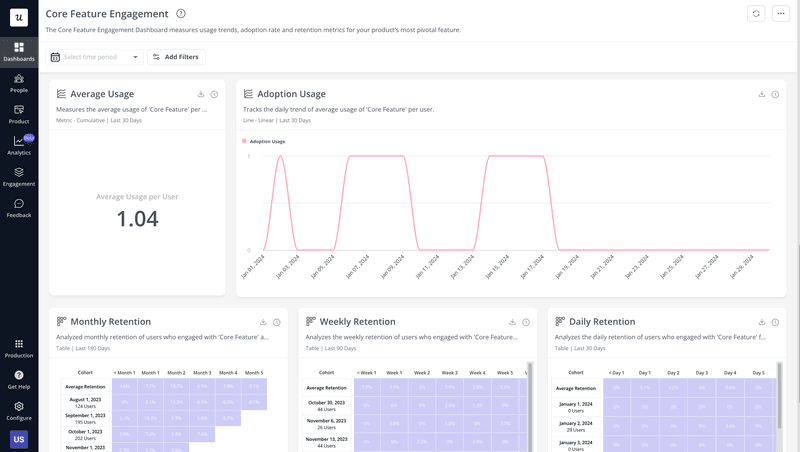
Core feature engagement dashboard in Userpilot.
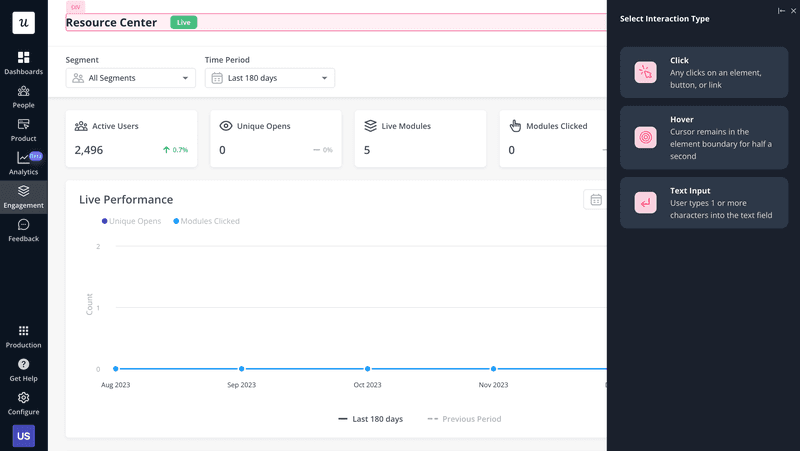
The dashboards are not limited to user behavior analytics.
There’s also a dedicated NPS dashboard with all the metrics and trends.
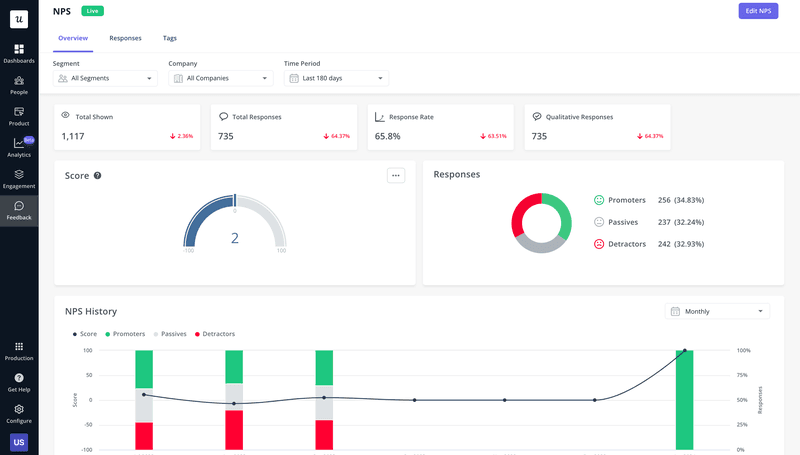
NPS dashboard in Userpilot.
Amplitude – standalone user analytics tool
Amplitude is a powerful dedicated analytics platform.
Apart from common reports, like funnels, paths, or cohorts, it also offers specialist analytics features like conversion driver, root cause analysis, and forecasting.
It also supports mobile apps, which isn’t the case with Userpilot.
However, it doesn’t offer any feedback functionality and to act on the data, you need to integrate it with a third-party engagement platform.
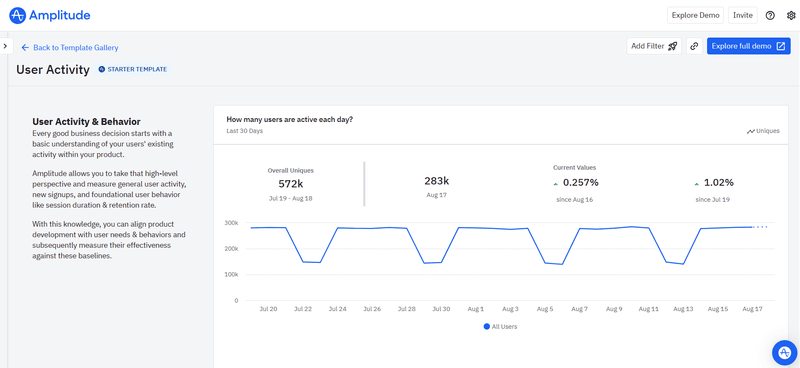
User analytics tool: Amplitude.
Google Analytics – free user analytics platform
Google Analytics 4 is a popular analytics platform that supports both web and mobile devices.
However, most teams use it for web traffic analytics – for example, to track user behavior on the website, before they sign up for the free trial or book a demo.
GA4 supports trend, funnel, cohort, and path analytics and offers high levels of customization for very granular insights.
Considering its powerful capabilities, it’s surprising to see that it’s a free tool.
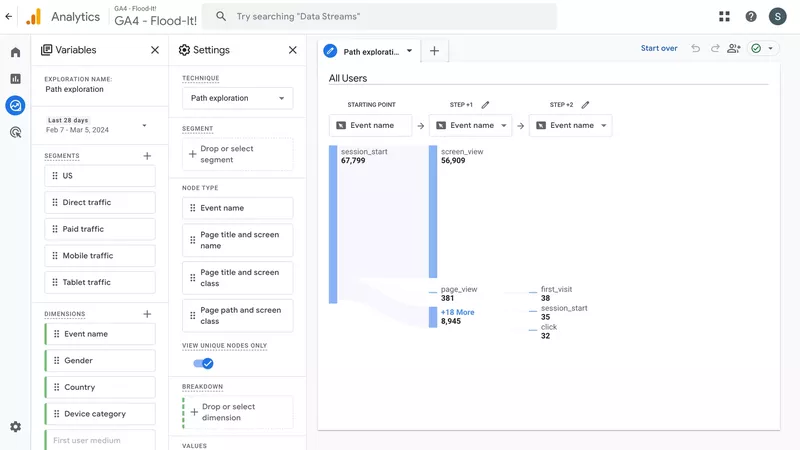
User analytics tool: Google Analytics.
Conclusion
User analytics help product teams understand user behavior inside the product along with their preferences, needs, and pain points. Such insights are essential to make informed development decisions and allocate resources adequately to improve user experience.
If you want to learn more about Userpilot’s analytics or how to use it to act on the insights, book the demo!