UserGuiding Analytics In-Depth Review: Features, Better Alternatives, and More (original) (raw)
UserGuiding Analytics (Summary)
- UserGuiding is a cloud-based platform specializing in user onboarding solutions with the necessary features to offer personalized onboarding flows and interactive product tours.
- You can use UserGuiding analytics to track and optimize your onboarding materials’ performance. Some of its standout features include:
- Guide analytics helps you track how your onboarding materials are doing after you publish them.
- Step analytics tracks the number of users who start and complete your onboarding guides and gives insights into the effectiveness of the guides.
- Hotspot analytics offers insights into all end-user interactions related to your published live hotspots.
- Checklist analytics helps you track the performance of your checklist with real-time insights.
- Resource center analytics provides information on how effective your published resource materials are to your customers.
- UserGuiding analytics offers integrations with the popular analytics platform but has limitations like the risk of data loss.
- It brings good value for money with its affordable plans but comes short in terms of analytical features.
- UserGuiding analytics offers 3 plans: Basic, Professional, and Corporate Plan.
- Userpilot is a better user onboarding tool for UserGuiding analytics, offering a more robust and comprehensive solution with its various features.
- It offers three pricing plans: Growth, Traction, and Enterprise, with a free demo on booking.
Is UserGuiding analytics giving you the full picture?
UserGuiding tracks guides well, but product growth requires more. Take this 4-step assessment to see if your UserGuiding analytics strategy is leaving money on the table.
How do you track user behavior *outside* of your guides?
We don’t, we only track guide completion
We use a separate, disconnected tool like GA4
We track native feature usage and events in one platform
When a user drops off a checklist, do you know why?
No, we just see the completion rate drop
We guess based on support tickets
Yes, we watch session recordings of the drop-off
How reliable is your CRM integration (e.g., HubSpot)?
It’s client-side, so we sometimes lose data
It’s one-way only (we can’t trigger flows based on CRM data)
It’s a robust, two-way server-side sync
Get Analytics That Drive Growth
Don’t settle for basic guide tracking. Userpilot offers deep product analytics, heatmaps, session replays, and reliable integrations to power your growth.
Track. Analyze. Optimize.
What is UserGuiding?
UserGuiding is a cloud-based digital adoption and user onboarding platform. It helps you create interactive product tours, generate custom onboarding flows, and analyze product adoption metrics.
You can also tailor your walkthroughs and tours to your brand and product offerings without any prior coding knowledge.
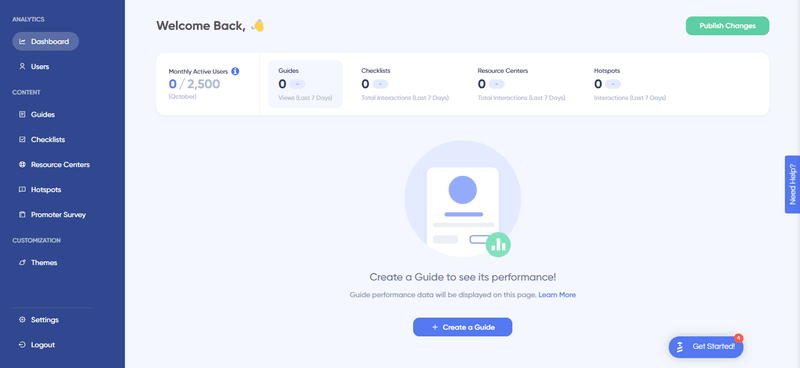
UserGuiding dashboard.
UserGuiding analytics functionality in-depth
How can UserGuiding analytics help you retain customers? Let’s see.
Guide analytics
You can track the performance of your onboarding tools with guide analytics. After publishing your content, you can see all user interactions related to it on the analytics dashboard.
UserGuiding analytics dashboard presents information from different content, like guides, hotspots, checklists, and resource centers, in one place.
The guide analytics dashboard also offers various interactive graphs, such as line charts, pie charts, and tables. These graphs help you visualize the data and better understand the data related to your onboarding performance. You can then drill down into specific data points and understand the behavior of your new customers at a granular level.
Last but not least, guide analytics allows you to export data in CSV format. You can export the data in a spreadsheet format by clicking the Export CSV button. This helps you analyze your onboarding data in-depth by integrating it with other business intelligence tools.
UserGuiding guide analytics.
Steps analytics
You can access in-depth insights into the efficiency of your onboarding guides by using step analytics from the analytics dashboard. Step analytics helps you assess the success of your onboarding strategy by tracking the number of users who start and complete your guides.
You can also identify drop-off points across each step within your guide. This helps you pinpoint where users may lose interest or become disengaged. After identifying the issues, you can optimize the user experience and improve the conversion rate.
Step analytics reports include the following metrics to help you measure the effectiveness of your guides:
- The total number of users who start and complete the guide in a given period.
- Overall guide completion rate.
- The number and percentage of users who dropped off at each step.
UserGuiding steps analytics.
Hotspot analytics
You can track user interactions with the hotspot on your product with the help of hotspot analytics. It provides all end-user interactions related to hotspots after you publish them on your platform. You can then take an in-depth look into the performance of each live hotspot.
Hotspot analytics presents a wealth of analytics data that can help you measure the success of your hotspots. This data makes it easier to make data-driven decisions and optimize your hotspots to improve user engagement.
Hotspot Tab has the following indicators:
- The total number of unique interactions between the end-users and all live hotspots within the last 7 days.
- Changes between last week’s numbers and this week’s numbers in terms of the total number of unique interactions.
UserGuiding hotspot interactions.
Checklist analytics
UserGuiding offers a comprehensive set of features to track the performance of your onboarding checklist. You will then know better to improve this interactive in-app widget checklist to keep a pulse on user engagement.
You can track the following key things using UserGuiding’s checklist analytics:
- The total number of unique guide trigger events between your end-users and all active checklists within the last week.
- Whether your unique guide trigger has increased or decreased compared to the previous week and by how much.
Checklist analytics lets you apply three filters to the “checklists – guide triggers” data:
- Dropdown
- Date Picker
- Interval Selector
It also offers a variety of visualization charts, like pie charts, line charts, etc., to help you better understand your onboarding data.
You can also export your onboarding checklist data in CSV format from other tools. It can be useful for creating custom reports, analyzing trends, and gaining insights about your onboarding strategy.
UserGuiding checklist analytics.
Resource center analytics
You can track your resource center‘s performance after going live using UserGuiding’s resource center analytics. It’ll help you improve your knowledge base and better support your customers.
You can track the following indicators with the resource centers tab:
- The number of unique interactions between the end-users and all active resource centers within the last week.
- Whether your unique interactions’ number increased or not and by how much.
It provides various visualization charts to analyze your resource center’s performance over time. You can also export your data in CSV format from programs like Microsoft Excel and Google Sheets.
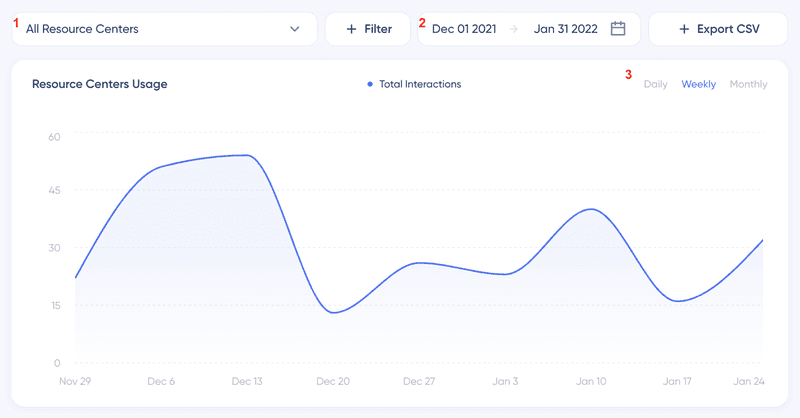
UserGuiding resource center analytics.
UserGuiding analytics integrations
You can integrate UserGuiding with top analytics platforms such as Mixpanel, Segment, Google Analytics, HubSpot, and more. UserGuiding’s integrations can help you keep all your tech stacks interconnected and make user onboarding better with ease.
However, it’s important to note that there are limitations to some of these integrations. One such limitation is HubSpot’s one-way integration that doesn’t let you trigger content based on HubSpot attributes and properties.
The integration mainly relies on installing both HubSpot and UserGuiding scripts on the client side, which can increase the data loss risk. As a result, UserGuiding is not as reliable as server-side integrations.
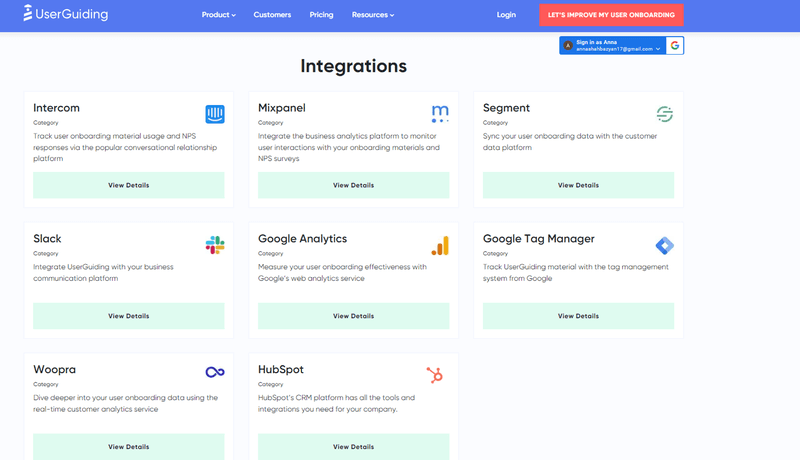
UserGuiding integrations.
Pros and cons of UserGuiding analytics
What are the advantages and drawbacks of UserGuiding analytics? Let’s see.
Pros of UserGuiding
- Has its pricing plans at reasonable price points, making it affordable.
- Its setup is simple and easy to do.
- Offers simple analytics, segmentation, and targeting features.
- Provides multilingual features for user onboarding.
- Offers a high level of customization to let you tailor their guides and tours according to your needs.
- An excellent customer support team to help you get the most out of the platform.
Cons of UserGuiding
While UserGuiding’s sole focus lies solely on engagement, there are some key areas where UserGuiding falls short:
- Does not support analytical features, like features & events, heatmaps, page tracking, and goals.
- Doesn’t support company-level identification and supports only user-level one.
- Does not offer native localization, so users must manually rewrite content for different languages.
What do users say about UserGuiding?
UserGuiding has a very good rating on popular user review sites like G2. The reviewers highly regarded it for its ease of use, pricing plans, and no-code solution.
Many users appreciated UserGuiding’s intuitive and user-friendly interface. This easy-to-use interface helped users create their desired walkthroughs and product tours without coding knowledge. Reviewers also mentioned that UserGuiding could provide value to their business almost immediately.
While most of the reviews for UserGuiding are positive, some users have expressed concerns about the quality of the analytics features of UserGuiding. Another drawback was that its localization is still not a standard feature to support translation to various languages.
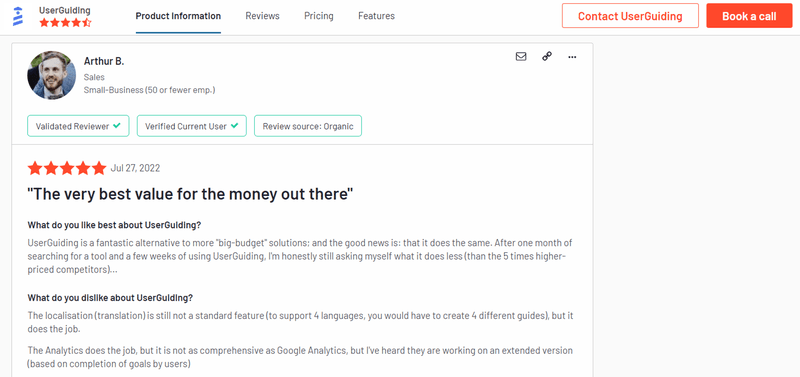
Reviews about UserGuiding.
UserGuiding pricing
There are 3 pricing plans – Basic, Professional, and Corporate plan. The monthly pricing ranges from 199to199 to 199to699+.
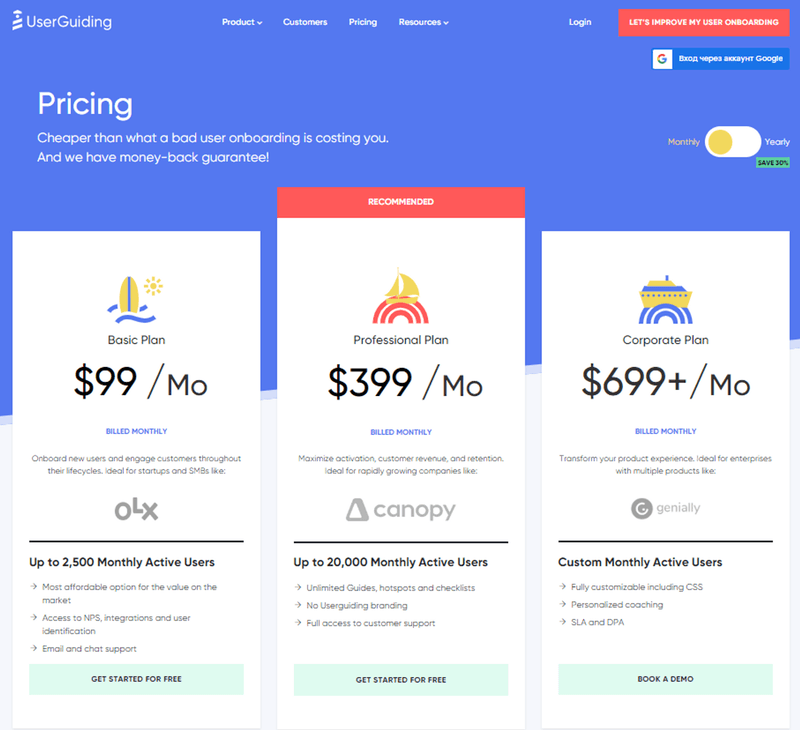
Basic plan
The basic plan comes at $199/month, with core features like NPS, integrations, user identification, etc. It is an affordable option for small and medium-sized businesses with little resources.
Professional plan
The professional plan costs $699/ month and includes unlimited guides, hotspots, checklists, and no UserGuiding branding. It suits medium and large-sized companies that need sophisticated user onboarding solutions.
Corporate plan
UserGuiding’s Corporate plan is custom-priced and offers enterprise-level features like CSS customization, SLA, DPA, etc. It best fits large companies that require custom solutions.
Userpilot: A better alternative for UserGuiding analytics
While UserGuiding focuses mainly on engagement it has some drawbacks. Userpilot can be a better solution for you.
Userpilot is a robust no-code product adoption platform that offers personalized and contextually relevant in-app experiences. It lets you easily create effective user onboarding experiences and in-app guidance flows.
Here are some of the best Userpilot features that can help you:
- Segmentation: Userpilot lets you create customer segments based on various parameters, like user behavior, demographics, etc. These segments can help you target specific user groups with personalized onboarding experiences.
- Advanced Analytics: Userpilot provides users with detailed insights into user behavior. It enables you to identify areas for improvement and optimize your onboarding and retention strategies.
- Real-time Insights: You can see how users interact with your onboarding materials using Userpilot’s real-time insights about user behavior and engagement levels. It can help you maintain a proven strategy, identify issues or areas for improvement, and take action quickly.
- Mobile App Engagement: Onboard and engage mobile app users by creating personalized messaging, push notifications, and surveys with Userpilot.
- Features & Events: This feature shows how much more Userpilot prioritizes analytics than UserGuiding analytics. Features and events tool gives you insight into feature usage and helps you make custom event triggers to prompt engagement.
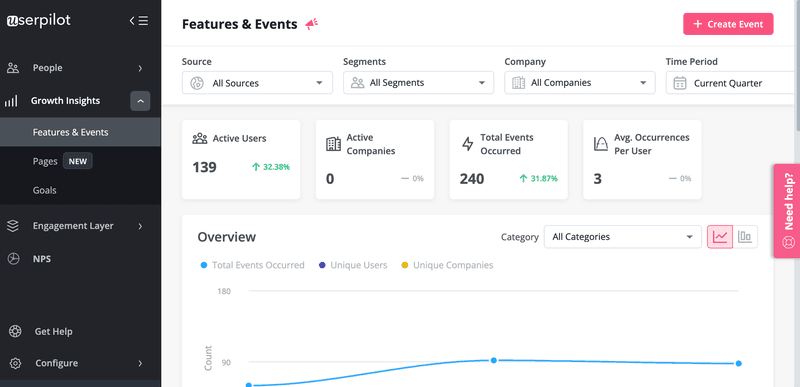
Userpilot dashboard.
Userpilot pricing
Userpilot offers flexible pricing based on your monthly active users (MAUs). Plans start at $299 per month for smaller teams and scale as your user base grows.
Below are the pricing tiers you can choose from:
- The Starter plan begins at $299/month (billed annually) for up to 2,000 monthly active users. It includes in-app user engagement, usage trend analysis, NPS surveys, and essential product analytics—ideal for mid-market SaaS teams getting started.
- The Growth plan offers custom pricing and adds advanced analytics, retroactive event auto-capture, in-app surveys, session replay, and more. It’s the most popular choice for growing teams that need deeper insights and scale.
- The Enterprise plan offers custom pricing and includes everything in Growth, plus bulk data handling, custom roles and permissions, SOC 2 Type 2 compliance, and enterprise-level support.

Not sure which plan is right for you? Book a demo to talk with the team and find the best fit for your needs.
Conclusion
While UserGuiding analytics is a dependable user onboarding tool, it lags behind because of its limited features and analytics. Its alternatives, such as Userpilot, can be a better choice for your business with advanced analytics features and more value for money.
Want to nail your user onboarding without coding a single line? Book a Userpilot demo and see the improvement first-hand!