What’s the Worst Month for the Stock Market? (original) (raw)
Is September the worst month for the US stock market? Depending on who you ask, maybe. This belief is so common that it has a name: the “September effect.”
In this post, we’ll look at nearly a century of US stock market data to investigate whether there’s any truth to the idea that September is a bad month for investment returns. We’ll also look for patterns in both weekly and daily returns since 1926, and explain what our findings mean for you as an investor.
September has the worst returns on average
It’s true: September is the worst month for US stock market returns on average. We analyzed US stock market performance as far back as 1926 and found that the average return for September has been -0.85%. Over the same time period, every other month has had positive average returns.
The chart below plots the average total returns of the US stock market from July 1926 through May 2024.
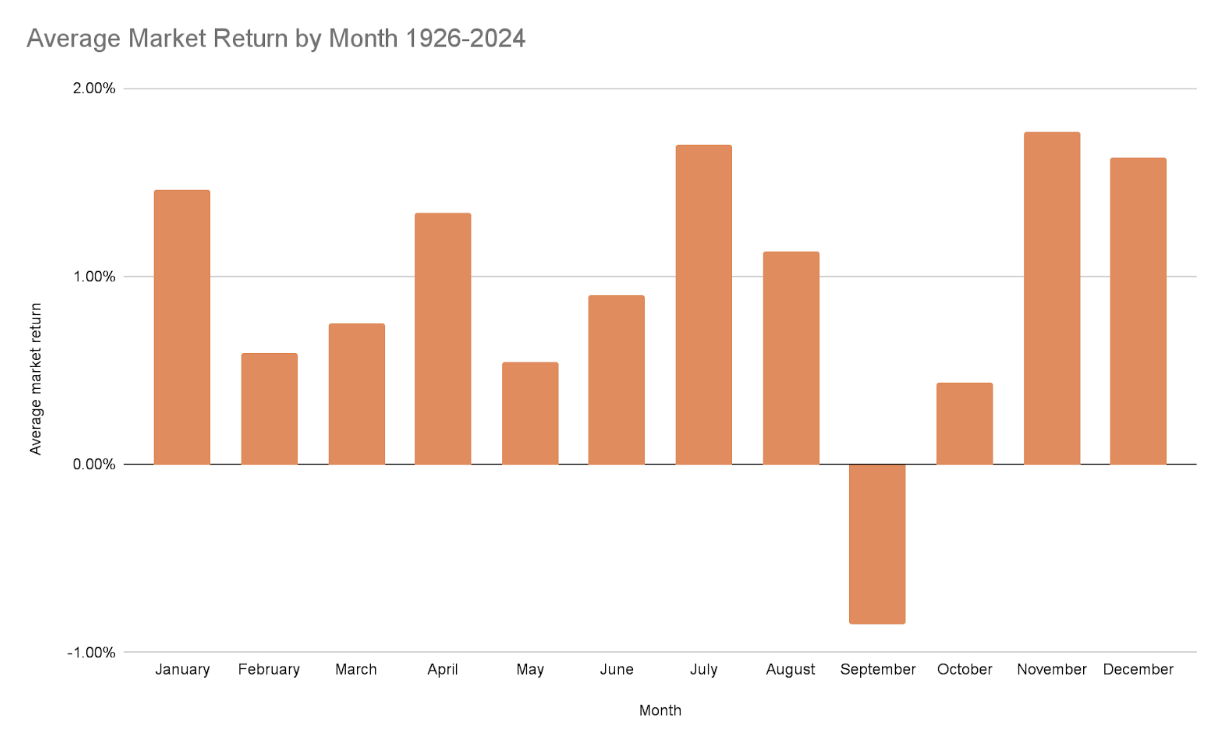
Source: Kenneth French Data Library
Does this mean investors should sell their positions in US stocks in August and buy again in October? We don’t think so.
First of all, past performance doesn’t guarantee future results. In hindsight, sitting out every September over the last 98 years would have paid off, at least on a pre-tax basis. But that doesn’t mean the trend will continue into the future.
Second, US stock returns are noisy and variable. The average monthly return in our analysis is just under 1% (0.95% to be exact), but there is a huge amount of variation around that average. About 64% of monthly returns since 1926 are below -1% or higher than 3%, and there are some months with very large-magnitude values (both positive and negative).
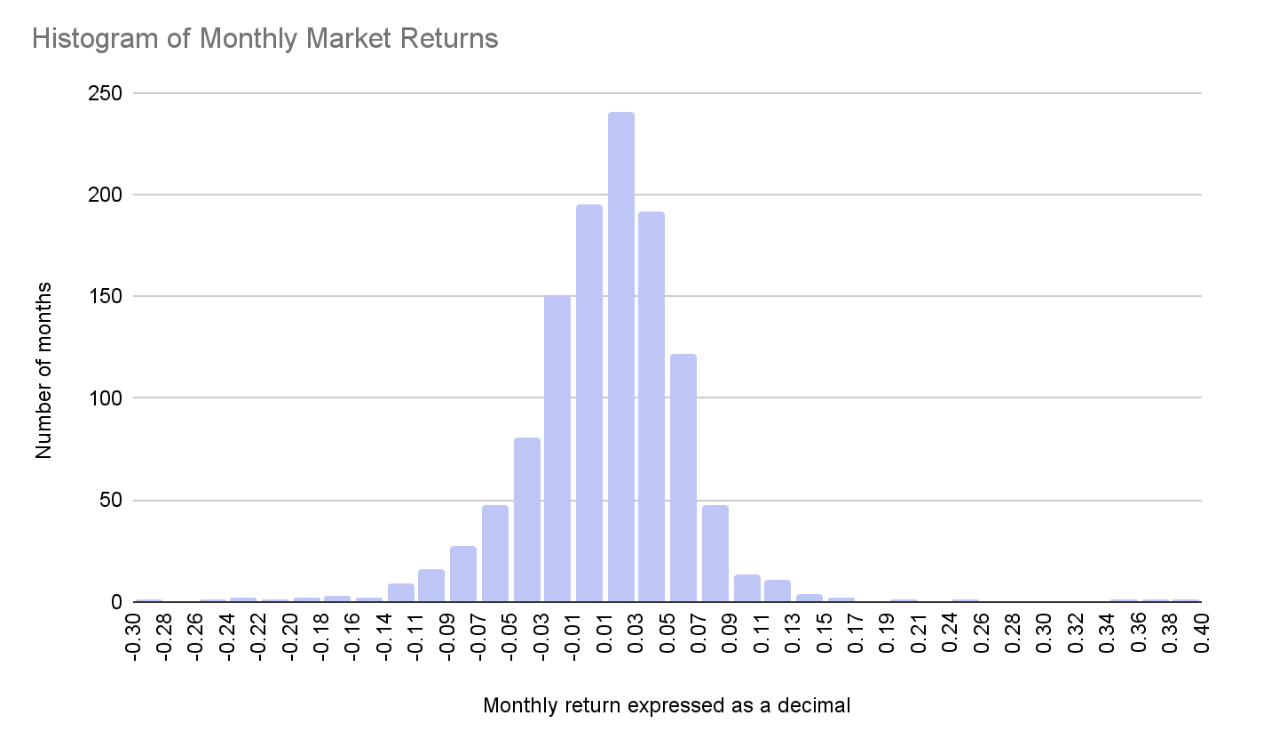
Source: Kenneth French Data Library
And finally, keep in mind that investment gains are taxed at different rates depending on how long you hold the investment before selling. If you hold an investment for at least a year before selling, any profits you earn can be treated as long-term capital gains instead of short-term capital gains. Long-term capital gains are taxed at a maximum rate of 20% at the federal level, whereas short-term capital gains are taxed at a maximum federal rate of 37% in 2024. If you sell your investments every August and buy them again in October, any potential profits you earn will be treated as short-term capital gains, and are likely to be taxed at a higher rate.
The worst weeks for the US stock market
We decided to dig in more and look at individual weeks instead of just monthly returns. To do this, we calculated the average return of each week of the year (with each week starting on a Monday and ending on a Friday). We found that since 1926, most weeks have had a positive return on average, but not all: 12 weeks out of the year (about 23%) have averaged negative returns. The week with the worst return on average, week 38, falls during September.
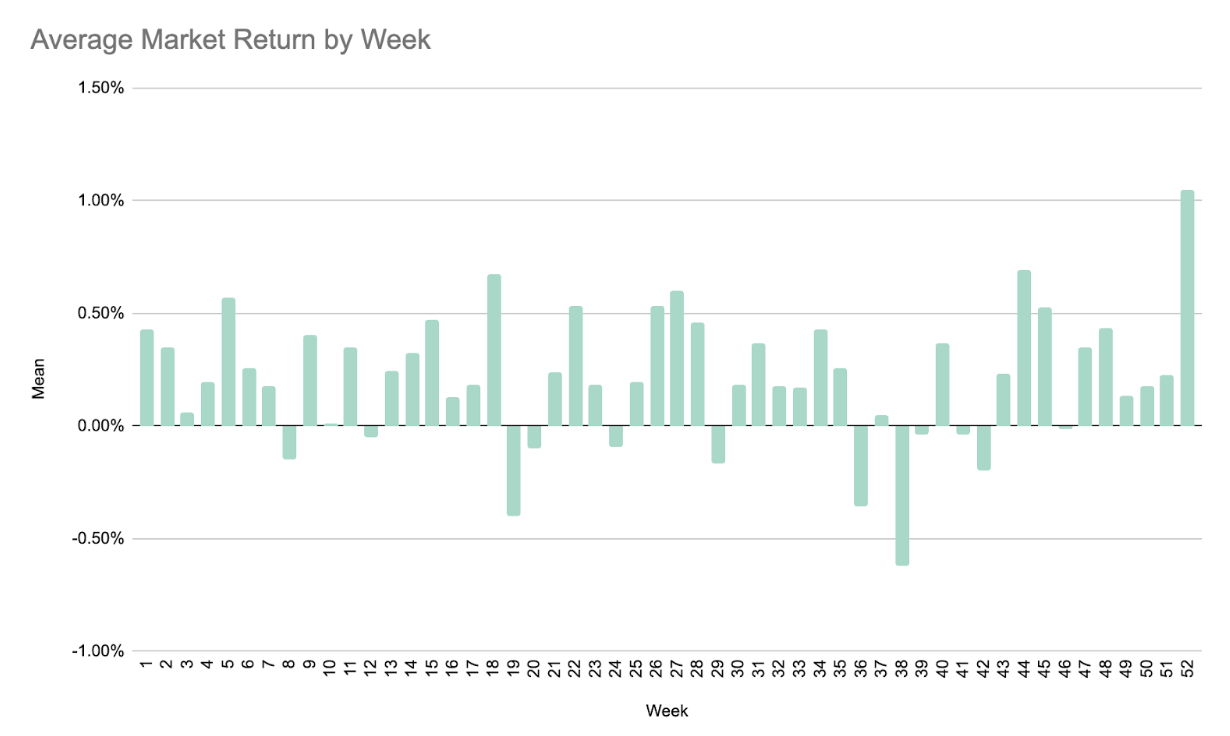
Source: Kenneth French Data Library
Does this mean that going forward, we think you should sell on the Friday before each one of the weeks with negative average returns and buy the Monday after? Again, the answer is no for the same three reasons we gave above.
The worst day for the US stock market
We can go one step further in granularity and calculate the average return for each day of the year. The majority of days have a positive average, but not nearly all—about 37% of the days have had negative returns on average since 1926. You might be surprised to learn that the worst day on average for the US stock market is not in September—it’s actually October 19, with an average daily return of -0.39%. This is partially due to October 19, 1987, which is known as “Black Monday”—the single worst day for the US stock market in the period we analyzed. The second-worst day on average, however, is September 26, with an average daily return of -0.32%.
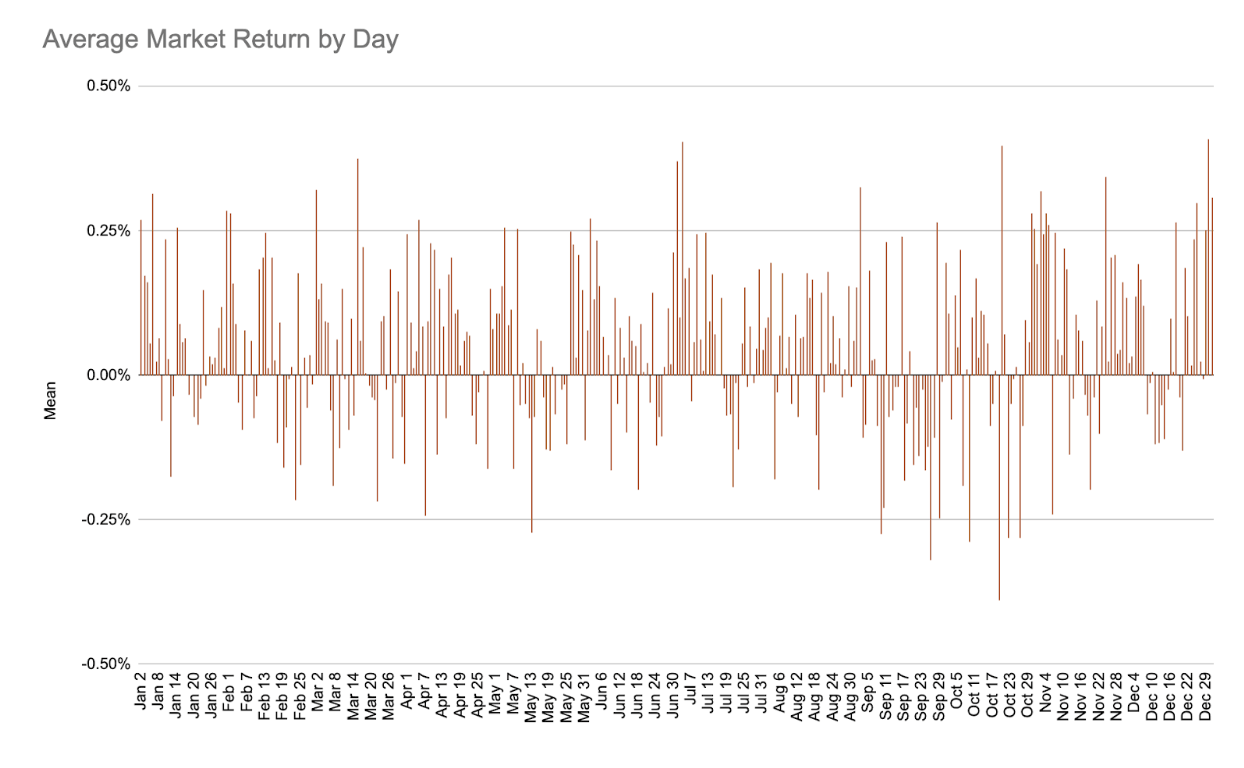
Source: Kenneth French Data Library
Of course, a strategy that only invests on days with positive historical average returns is even more absurd (not to mention time-consuming to execute) than the weekly or monthly strategies above. We don’t recommend doing this.
Why we think you should ignore the “September effect”
The patterns described in this post might be interesting, but we don’t think they should inform your strategy as an investor (keep in mind that we only looked at these patterns over one time frame, too). Stocks compensate investors for taking risk. The expected return from investing in stocks is positive over the long term, but over any given short-term period, the return may be negative. The same can be true looking at averages over the same period of time each year, whether that period is a day, a week, or even a month. News outlets that want to get your attention may write stories about the “September effect,” but we largely ignore them—and we think you should, too.
Instead, we suggest that you focus on what you can control: diversifying your portfolio, lowering your taxes, and minimizing your fees. At Wealthfront, we make this easy: our Automated Investing Account is tailored to your risk tolerance, designed to maximize your after-tax returns, and available for our low 0.25% advisory fee. You can also take advantage of a strategy known as “dollar cost averaging” where you invest a set amount of money on a regular schedule (for example, you might invest $1,000 every month) regardless of whether the market is up or down. As we explained in a blog post earlier this year, dollar cost averaging can help investors to make money even when the market doesn’t go up.
You've successfully subscribed to our blog.
Disclosure
The information contained in this communication is provided for general informational purposes only, and should not be construed as investment advice. Nothing in this communication should be construed as an offer, recommendation, or solicitation to buy or sell any security. Any links provided to other server sites are offered as a matter of convenience and are not intended to imply that Wealthfront Advisers or its affiliates endorses, sponsors, promotes and/or is affiliated with the owners of or participants in those sites, or endorses any information contained on those sites, unless expressly stated otherwise.
Wealthfront Advisers and its affiliates do not provide legal or tax advice and do not assume any liability for the tax consequences of any client transaction. Clients should consult with their personal tax advisors regarding the tax consequences of investing with Wealthfront Advisers and engaging in these tax strategies, based on their particular circumstances. Clients and their personal tax advisors are responsible for how the transactions conducted in an account are reported to the IRS or any other taxing authority on the investor’s personal tax returns. Wealthfront Advisers assumes no responsibility for the tax consequences to any investor of any transaction.
The effectiveness of the tax-loss harvesting strategy to reduce the tax liability of the client will depend on the client’s entire tax and investment profile, including purchases and dispositions in a client’s (or client’s spouse’s) accounts outside of Wealthfront Advisers and type of investments (e.g., taxable or nontaxable) or holding period (e.g., short- term or long-term).
Wealthfront Advisers’ investment strategies, including portfolio rebalancing and tax loss harvesting, can lead to high levels of trading. High levels of trading could result in (a) bid-ask spread expense; (b) trade executions that may occur at prices beyond the bid ask spread (if quantity demanded exceeds quantity available at the bid or ask); (c) trading that may adversely move prices, such that subsequent transactions occur at worse prices; (d) trading that may disqualify some dividends from qualified dividend treatment; (e) unfulfilled orders or portfolio drift, in the event that markets are disorderly or trading halts altogether; and (f) unforeseen trading errors. The performance of the new securities purchased through the tax-loss harvesting service may be better or worse than the performance of the securities that are sold for tax-loss harvesting purposes.
Tax loss harvesting may generate a higher number of trades due to attempts to capture losses. There is a chance that trading attributed to tax loss harvesting may create capital gains and wash sales and could be subject to higher transaction costs and market impacts. In addition, tax loss harvesting strategies may produce losses, which may not be offset by sufficient gains in the account and may be limited to a 3,000deductionagainstincome.Theutilizationoflossesharvestedthroughthestrategywilldependupontherecognitionofcapitalgainsinthesameorafuturetaxperiod,andinadditionmaybesubjecttolimitationsunderapplicabletaxlaws,e.g.,ifthereareinsufficientrealizedgainsinthetaxperiod,theuseofharvestedlossesmaybelimitedtoa3,000 deduction against income. The utilization of losses harvested through the strategy will depend upon the recognition of capital gains in the same or a future tax period, and in addition may be subject to limitations under applicable tax laws, e.g., if there are insufficient realized gains in the tax period, the use of harvested losses may be limited to a 3,000deductionagainstincome.Theutilizationoflossesharvestedthroughthestrategywilldependupontherecognitionofcapitalgainsinthesameorafuturetaxperiod,andinadditionmaybesubjecttolimitationsunderapplicabletaxlaws,e.g.,ifthereareinsufficientrealizedgainsinthetaxperiod,theuseofharvestedlossesmaybelimitedtoa3,000 deduction against income and distributions. Losses harvested through the strategy that are not utilized in the tax period when recognized (e.g., because of insufficient capital gains and/or significant capital loss carryforwards), generally may be carried forward to offset future capital gains, if any.
Investment advisory services are provided by Wealthfront Advisors, an SEC-registered investment adviser, and brokerage products and services are provided by Wealthfront Brokerage LLC, member FINRA / SIPC.
All investing involves risk, including the possible loss of money you invest, and past performance does not guarantee future performance. Please see our Full Disclosure for important details.
Wealthfront Advisers, Wealthfront Brokerage, and Wealthfront are wholly owned subsidiaries of Wealthfront Corporation.
© 2024 Wealthfront Corporation. All rights reserved.
About the author(s)
Alex Michalka, Ph.D, has led Wealthfront’s investment research team since 2019. Prior to Wealthfront, Alex held quantitative research positions at AQR Capital Management and The Climate Corporation. Alex holds a B.A. in Applied Mathematics from the University of California, Berkeley, and a Ph.D. in Operations Research from Columbia University. View all posts by Alex Michalka, Ph.D