Starch granules identification and automatic classification based on an extended set of morphometric and optical measurements (original) (raw)
Abstract
Starch granules have been found to be preserved in association with archaeological remains and their identification may provide direct botanical evidences of the plants used by ancient humans. However, subtle morphological differences between starch granules make their taxonomic identifications difficult. In order to improve the identification of these plant remains, we used an image analysis program that measures up to 123 different optical and morphological characters. With Random Forest tests we analyzed~5000 starch granules extracted from underground storage organs (USO), seeds, and fruits of 20 different East African edible plant species. Our results show that correct identification rates are up to 74% for some species (Echinochloa colona, Cyperus rodundus),~80% for some suprageneric taxa (Poaceae, Fabaceae), and 80% for underground storage organs. However, on average, success rates are just~53% for species (up to 70% with a dataset reduced to herbaceous species), 60% for families, and 72% for plant parts. Yet, this automated system is not perfect, but it is still more powerful than the human eye, for which the average success rate is just of 25% for species level identifications. We evaluated the performance of our system and found that accuracy rates of identifications of starch granules are highly sensitive to the number of groups (species) to identify (r 2 = 0.83) and, to a lesser extent to the number of characters used by the identification system (r 2 = 0.87). It is therefore crucial to narrow down as much as possible the number of target species, by analyzing additional proxies. We conclude that better results can be achieved if the candidate field is narrowed. If not, the automated identification of starch granules will remain unsatisfactory to provide acceptable interpretations in archaeological contexts.
Figures (12)

Fig. 1. Selection of starch granules of all the species used in our study, viewed under polarized light (left) and natural light (right) (1000). a: Faidherbia albida (mesocarp), b: Vigna vexillata (USO), c: Emina antennulifera (USO), d: Portulaca oleracea (USO), e: Ficus salicifolia (mesocarp), f: V. frutescens (USO), g: Echinochloa colona (seed), h: Persicaria senegalensis (mesocarp), i: Setaria pumila (seed), j: Cadaba farinosa (mesocarp), k: Olyra latifolia (seed), 1: Adansonia digitata (mesocarp), m: Hibiscus micranthus (mesocarp), n: Typha latifolia (USO), 0: Cyperus rotundus (USO), p: Brachiaria deflexa (seed), q: Capparis fascicularis (mesocarp), r: Cynodon dactylon (USO), s: Panicum subalbidum (seed), t: Zantedeschia aethiopica (USO). lamellae, the position of the hilum, surface features, shape, size, etc. (Fig. 1). In archaeology, starch granules are identified by comparison with reference collections (Horrocks and Nunn, 2007; Mercader et al., 2008; Pearsall et al., 2004a, 2004b; Yang et al., 2009). However, few studies on the taxonomic potential of starch granules have been backed up by statistical analyses to measure the accuracy of identifications, de- spite the fact that starch granules exhibit morphological variations within a given species and that a given morphology may be redundant among taxa. Torrence et al. (2004) carried out the first statistical study of starch granules. They measured 18 characters (manually) on 50 to 100 granules from 29 different species. These authors showed that cor- rect identifications (75% of accuracy in average) could only be obtained for species with granules viewed in eccentric orientation, therefore lim- iting the application of their system to a set of grains presented or visible in the correct (i.e. eccentric) angle. Restricting the analysis to eccentri- cally oriented grains is a real problem when studying fossil material, where sediment or organic remains sometimes prevent the granule from being turned and viewed in another position. Previous studies on Middle Stone Age African stone tools, for example, showed that fossil starch granules are usually rare, e.g. about 6 to 36 per stone tool (Mercader et al., 2008; Mercader, 2009). In such cases it is crucial to make use of all available material. To improve starch granules identifica- tion, Wilson et al. (2010) automated the measurements and used a sta- tistical classification. They measured 14 morphometric characters to identify 9 species. They obtained rates of accuracy of 62% on average (lower than Torrence et al., 2004) despite the fact that their dataset in- cluded a smaller number of species. Other studies used different optical and morphological characters but with such a limited number of gran- ules that it is unlikely that starch granule variability could properly be taken into account (Choy et al., 2009; Fernandez Pierna et al., 2005). A successful method based on morphological and optical characters of identification (focused on granule outline) developed by Coster and We chose 20 species from a list of edible plants from East Africa that are part of the diet of modern humans, chimpanzees and baboon: (Copeland, 2007; Peters, 1993). Several of these plants are consumec

Plant species considered for this study. Herbarium codes as per Index Herbariorum. Table 1

Fig. 2. Combination of three polarized photographs (0°, 35°, 45°) of a Portulaca olerace¢ starch granule to suppress the extinction cross.

Fig. 3. Photo of different sized and shaped starch granules in natural and polarized light, the extracted binary image and the extracted outline. 1: Cyp. rot., 2-3: Vig. vex., 4: Aca. alb. 5: Per. sen. The example 5 shows the advantage of using the polarized light to extract the shape (Appendix A). The (absolute) difference between the outline of the granule and its fitted/ normalized circle permits to measure the shape of the granule. If it is perfectly round, the difference will be very small (<5 pixels) and, confused with the noise of few pixels (Example 1 is round a regular and 5 is also round but irregular). If the granule has a more complex shape, the variations (of th of pixels) will reflect it with larger variations and asymmetry (examples 2, 3 and 4). The larger variations express the global shape but the smaller variations express if a face is flattened or rounded. Some parameters are measured to quantify those variations (length, kurtosis, skewness, mean, standard deviation, fundamental frequency, amplitude, SINAD, frequency, phase...).

Random Forest test confusion matrix with rates of allocations in percentage using the dataset of selected granules and all characters. Species names are coded using the three first chat acters of genus and specific epithet. Table 3

* Vigna vexillata and V.frutescens were considered as one single taxon for the blind test. Summary table of success rates (in percent) obtained from confusion matrices using gran- ules grouped by a) species, b) families, c) order Poales, d) histological origin (plant parts). And e) results of the human eye identification blind test. Species names are coded using the three first characters of genus and specific epithet.

Fig. 4. Discriminant analysis. Plot with all granules showing differences between groups (left graph) and vectorial graph showing class scores for granules grouped by species (right). In th left plot, ellipses show 95% confidence intervals for each taxonomic group (note the intense overlap). In the right plot, arrow length shows the amount of variance explained by each tax. group. Species names are coded using the three first characters of genus and specific epithet.
![system (Table 2). For this test of identification using human eye, howev- er, the best conditions would have been to observe granules in a liquid mounting medium. Instead, the identification was carried out on the photographs taken for the automated experiment. In these conditions, starch granules could not be observed in the three dimensions, which may have improved the ARI by human eye. The ARI of starch granule with human eye may have been higher, also, if performed by an analyst with more experience. The replicability of identification needs to be tested thoroughly as done in some phytolith studies (e.g. dealing with maize identifications (Pearsall et al., 2003). This is particularly needed when plant species inference (e.g. maize (Zea mays) against non- maize Zea and non-Zea grasses) is based on a single proxy (e.g. phytoliths [Pearsall et al., 2003]), which can easily be questioned by other researchers (e.g. Pearsall et al., 2004a, 2004b; Rovner, 2004). An automated system like the one we have used here also enables carrying out statistical analysis and measuring and analyzing a large number of starch granules, (i.e. to handle the large intraspecific variability that one can observe in starch granules). Fig. 5. Vectorial graph showing variables scores for the test with granules grouped by species. The 50 variables (characters) with highest Random Forest mean decrease accuracy and mean decrease gini values are plotted in the graph. Arrow length shows the importance and contribution of each variable to the final multidimensional solution. Variables are described in Appendix B.](https://figures.academia-assets.com/113330441/figure_005.jpg) ](
](system (Table 2). For this test of identification using human eye, howev- er, the best conditions would have been to observe granules in a liquid mounting medium. Instead, the identification was carried out on the photographs taken for the automated experiment. In these conditions, starch granules could not be observed in the three dimensions, which may have improved the ARI by human eye. The ARI of starch granule with human eye may have been higher, also, if performed by an analyst with more experience. The replicability of identification needs to be tested thoroughly as done in some phytolith studies (e.g. dealing with maize identifications (Pearsall et al., 2003). This is particularly needed when plant species inference (e.g. maize (Zea mays) against non- maize Zea and non-Zea grasses) is based on a single proxy (e.g. phytoliths [Pearsall et al., 2003]), which can easily be questioned by other researchers (e.g. Pearsall et al., 2004a, 2004b; Rovner, 2004). An automated system like the one we have used here also enables carrying out statistical analysis and measuring and analyzing a large number of starch granules, (i.e. to handle the large intraspecific variability that one can observe in starch granules). Fig. 5. Vectorial graph showing variables scores for the test with granules grouped by species. The 50 variables (characters) with highest Random Forest mean decrease accuracy and mean decrease gini values are plotted in the graph. Arrow length shows the importance and contribution of each variable to the final multidimensional solution. Variables are described in Appendix B.
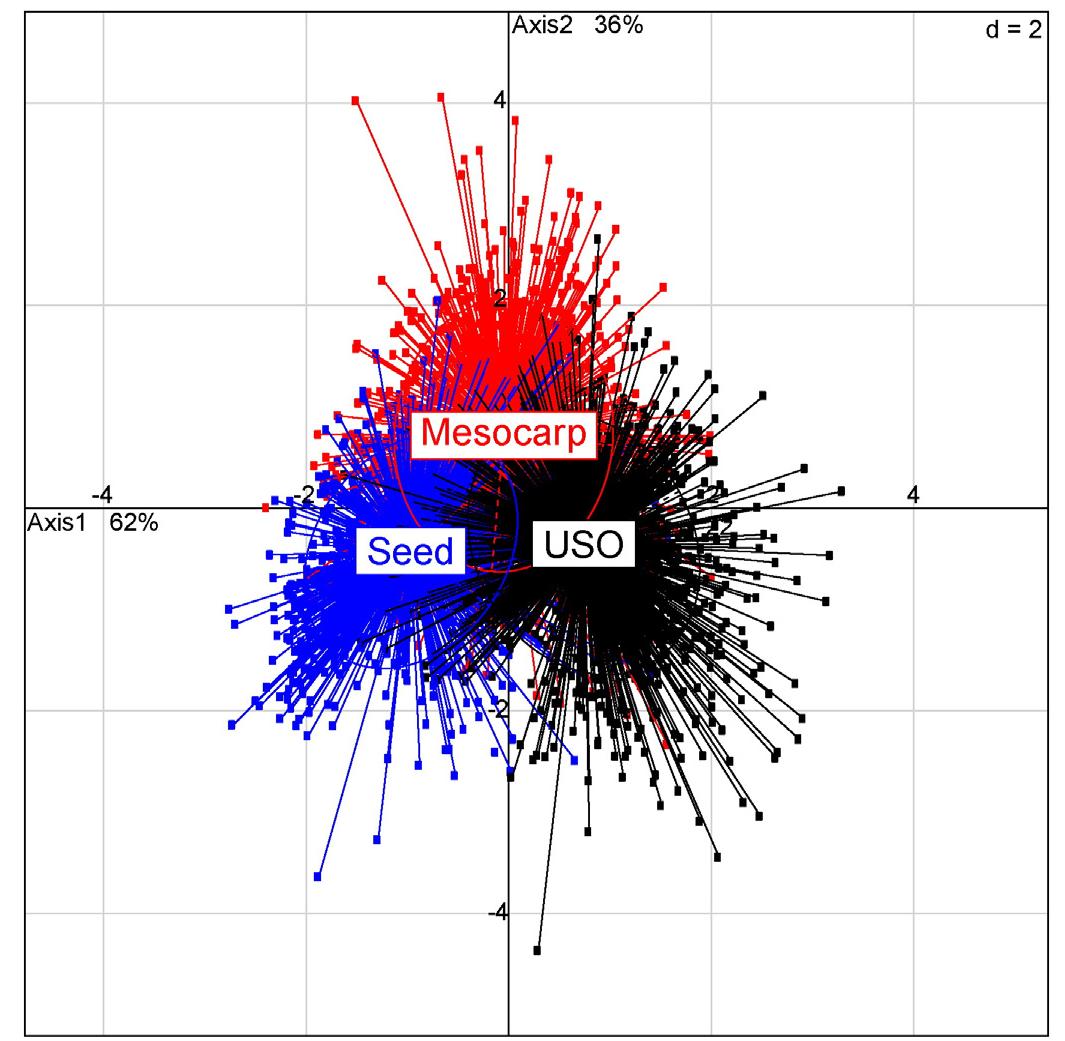
Fig. 6. Discriminant analysis showing differences between granules grouped by plant part origin (Seed, Mesocarp, and Underground Storage Organs). Ellipses show 95% confidence interval.

Fig. 7. Vectorial graph showing variables scores for the test with granules grouped by histological origin. The 50 variables (characters) with highest Random Forest mean decrease accuracy and mean decrease gini values are plotted in the graph. Arrow length shows the importance and contribution of each variable to the final multidimensional solution. Variables are described in Appendix B. Our results show that by reducing the number of target species, ARI improves (Fig. 8b). If the number of target species cannot be reduced, the chances for getting wrong identifications are very high. As an exam- ple, we can consider two species that are poorly discriminated by our system such as Z. aethiopica and C. farinosa. If just those two are consid- ered in the “reference collection”, our system easily separates them (ARI are of 90% and 86% respectively). If our full “reference collection” of 20 species is considered, then ARI for Z. aethiopica and C. farinosa drop to 25% and 23%, respectively. We note that we obtained averaged ARI as high as 72% in the test for discriminating among three plant parts meso- carp, seed and underground storage organs (Table 2d). Yet, it is likely that such high ARI relates to the fact that just three groups were consid- ered rather than to real differences between granules from different his- tological origins. It is therefore crucial to constrain as much as possible the pool of target species. To reduce the pool of target species, it may be useful to combine the analysis of starch granules with the analysis of other proxies e.g. resins, fibers (Gibson et al., 2004; Lombard, 2004), phytoliths (Dickau et al., 2012; Ezell et al., 2006; Piperno, 2009), or the analysis of use-wear (Barton et al., 1998; Kealhofer et al., 1999), to Our results do not question the taxonomic value of starch granules, because if just two species are considered e.g. Brachiaria deflexa and F, albida, the discrimination can be made with both human eye and our automated system (Table 2). The difficulty arises when the pool of target species is large. When dealing with the identification of plants processed by early hominin stone tools for example, the pool includes several hundreds of target species, as diets of both modern human and other African primates should be considered (Copeland, 2007; Peters, 1993). The use of a large reference collection, however, implies the use of a large set of characters (e.g Dollfus and Beaufort, 1999).

Fig. 8. Correlations between the numbers of characters (a), the numbers of groups (b) and the average accuracy rates of identification for the starch granules of our reference collection. Squares: Cyperus rotundus; Triangles: average rate.


Loading Preview
Sorry, preview is currently unavailable. You can download the paper by clicking the button above.